. 2023 Mar;12(3):e12311.
doi: 10.1002/jev2.12311.

Accessory ESCRT-III proteins are conserved and selective regulators of Rab11a-exosome formation

Affiliations

Accessory ESCRT-III proteins are conserved and selective regulators of Rab11a-exosome formation

Pauline P Marie et al. J Extracell Vesicles. 2023 Mar.

Erratum in

Abstract

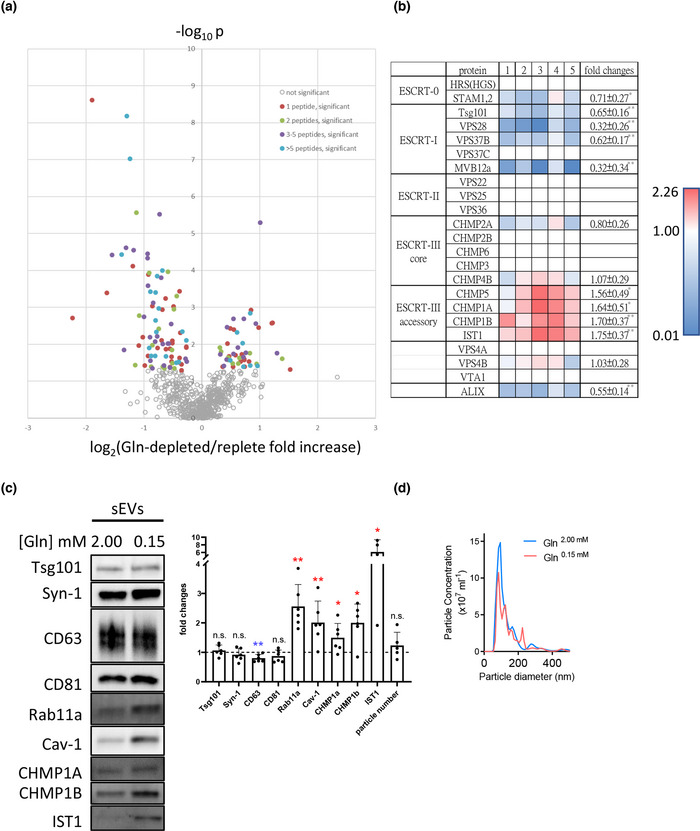
Exosomes are secreted nanovesicles with potent signalling activity that are initially formed as intraluminal vesicles (ILVs) in late Rab7-positive multivesicular endosomes, and also in recycling Rab11a-positive endosomes, particularly under some forms of nutrient stress. The core proteins of the Endosomal Sorting Complex Required for Transport (ESCRT) participate in exosome biogenesis and ILV-mediated destruction of ubiquitinylated cargos. Accessory ESCRT-III components have reported roles in ESCRT-III-mediated vesicle scission, but their precise functions are poorly defined. They frequently only appear essential under stress. Comparative proteomics analysis of human small extracellular vesicles revealed that accessory ESCRT-III proteins, CHMP1A, CHMP1B, CHMP5 and IST1, are increased in Rab11a-enriched exosome preparations. We show that these proteins are required to form ILVs in Drosophila secondary cell recycling endosomes, but unlike core ESCRTs, they are not involved in degradation of ubiquitinylated proteins in late endosomes. Furthermore, CHMP5 knockdown in human HCT116 colorectal cancer cells selectively inhibits Rab11a-exosome production. Accessory ESCRT-III knockdown suppresses seminal fluid-mediated reproductive signalling by secondary cells and the growth-promoting activity of Rab11a-exosome-containing EVs from HCT116 cells. We conclude that accessory ESCRT-III components have a specific, ubiquitin-independent role in Rab11a-exosome generation, a mechanism that might be targeted to selectively block pro-tumorigenic activities of these vesicles in cancer.

Analysis in complementary fly and human models shows accessory ESCRT‐III components selectively regulate Rab11(a)‐exosome production in endosomes labelled by recycling endosomal marker Rab11(a). Furthermore, blocking this class of ESCRTs suppresses both pathological and physiological functions associated with exosomes.

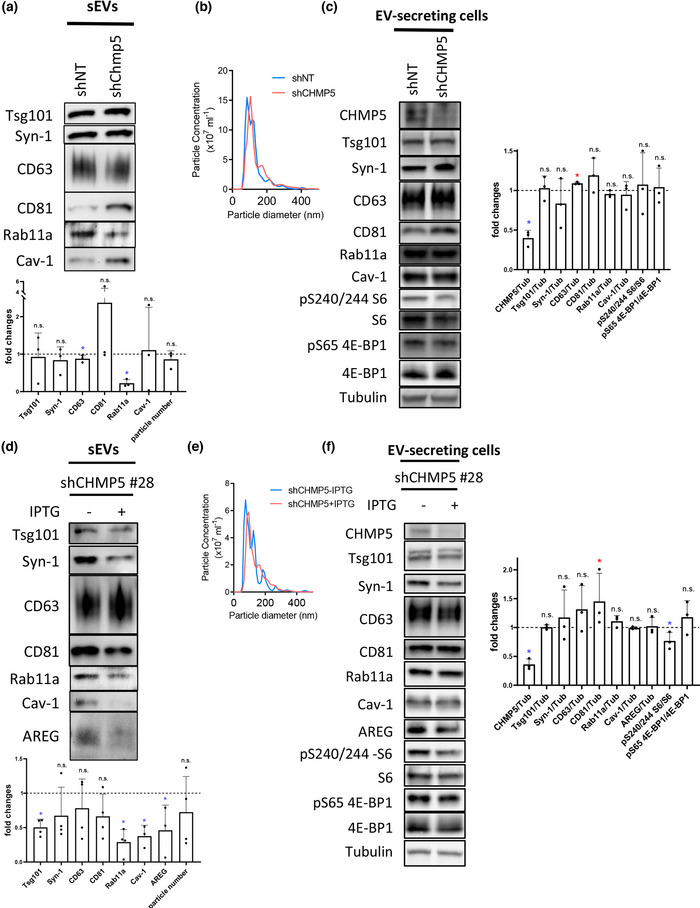
  1. Levels of accessory‐ESCRT‐III proteins are increased in small extracellular vesicle (sEV) preparations enriched with Rab11a‐exosomes; which are preferentially released following glutamine‐depletion of human cancer cell lines.

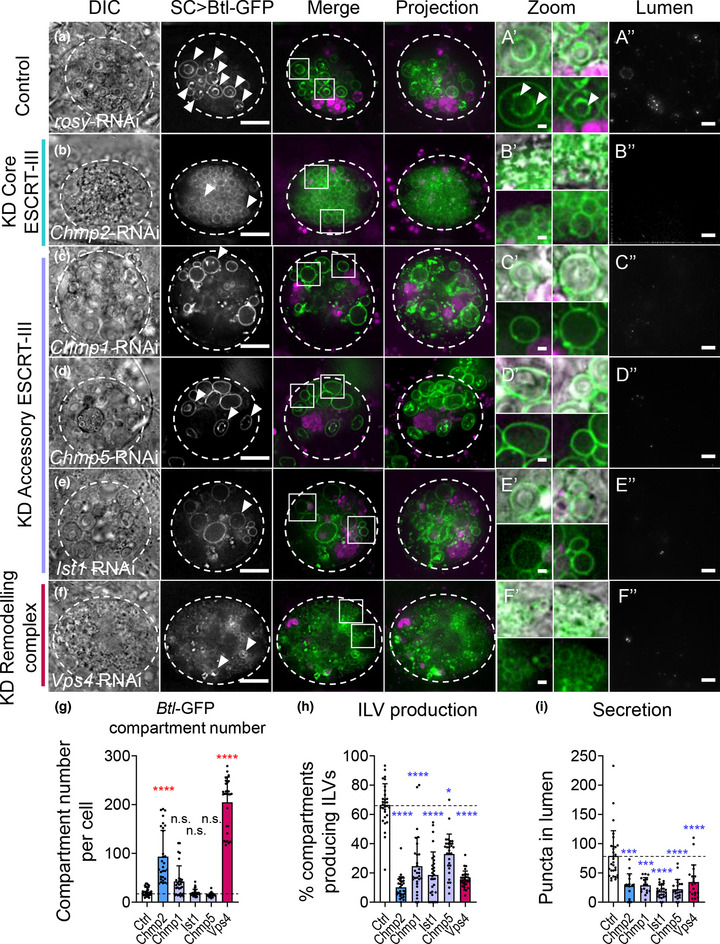
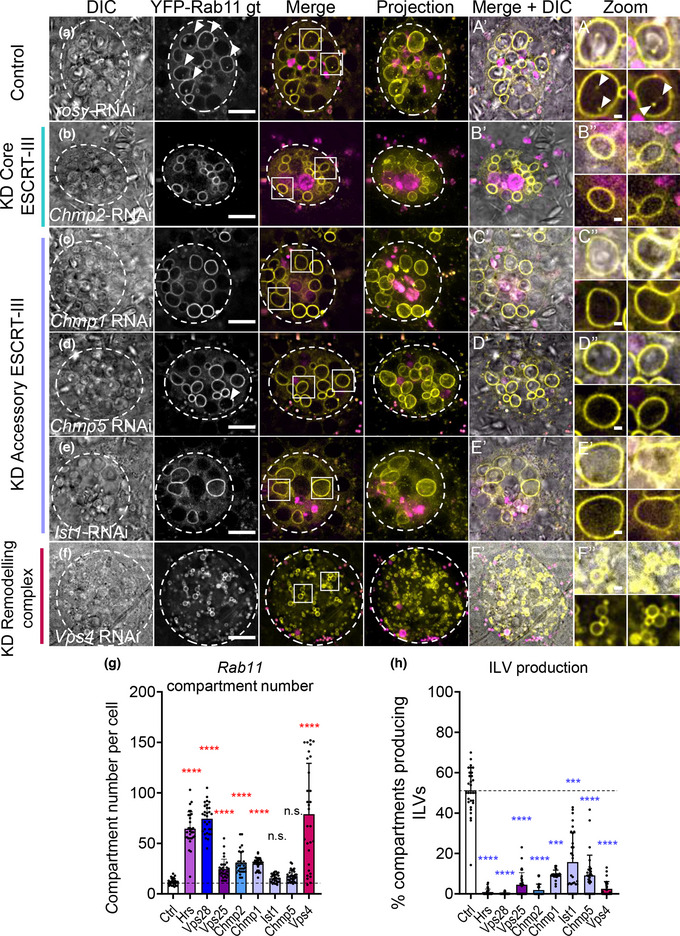
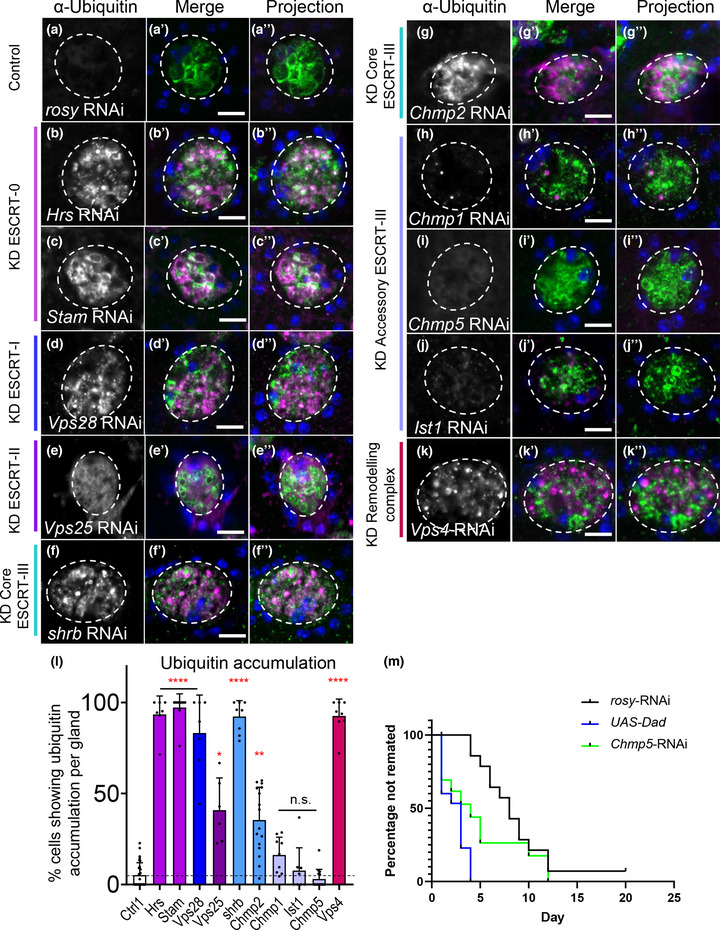
  2. Accessory ESCRT‐III proteins are required for Rab11(a)‐exosome biogenesis in recycling endosomes, but not for ESCRT‐dependent processing of ubiquitinylated, late endosomal intraluminal vesicle cargos.

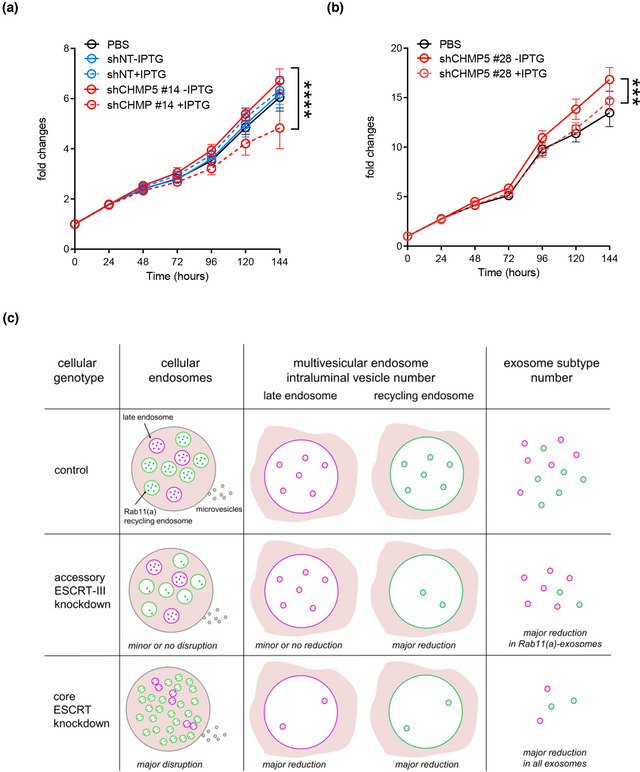
  3. Accessory ESCRT‐III knockdown has a much milder effect on the cellular endolysosomal network than core ESCRT knockdown.

  4. Knockdown of accessory ESCRT‐III proteins suppresses Rab11(a)‐exosome‐mediated human cancer cell growth and post‐mating responses in female flies.

Keywords: CHMP5; ESCRT; Rab11a-exosome; extracellular vesicle; recycling endosome.


Conflict of interest statement

The authors declare that they have no conflicts of interest in relation to this work.

Figures

FIGURE 1
FIGURE 1
sEV preparations from glutamine‐depleted HCT116 colorectal cancer cells contain elevated levels of accessory ESCRT‐III proteins. Five paired protein samples made from sEVs isolated by differential ultracentrifugation from glutamine‐depleted and glutamine‐replete HCT116 cells were subjected to TMT‐labelled comparative proteomics analysis. (a) Volcano plot showing mean log2 fold change in specific protein levels in sEV preparations from glutamine‐depleted conditions versus glutamine‐replete conditions plotted against ‐log10 p value for null hypothesis that levels are unchanged. Coloured data points represent proteins that are significantly altered in levels between the two conditions, with colours representing number of peptides detected. (b) Heat map showing change in levels of core and accessory ESCRT proteins in five paired sEV samples (labelled 1 to 5) from glutamine‐depleted versus glutamine‐replete HCT116 cells. Red shows an increase in protein levels and blue indicates a reduction following glutamine depletion. (c) Western blot of sEV preparations confirms that accessory ESCRT‐III proteins CHMP1A, CHMP1B and IST1 are all increased in sEVs produced by glutamine‐depleted (0.15 mM) HCT116 cells. Bar chart shows protein levels and sEV number normalised to cell lysate. Data derived from five independent experiments and analysed by the Kruskal‐Wallis test. Significantly changed levels are denoted by a blue (decreased) and red (increased) asterisks. *p < 0.05; n.s. = not significant. (d) Nanosight Tracking Analysis of sEV size and number for samples produced as in (c)
FIGURE 2
FIGURE 2
ESCRT‐0, ‐I and ‐II components regulate exosome biogenesis in non‐acidic compartments of Drosophila SCs. (a) Schematic of accessory gland (AG), marking position of secondary cells (SCs) at distal tips of both lobes (first panel), transverse section through AG lumen and secondary cells (second panel) and schematic representation of a basal Z‐plane view of a single SC (third panel), which corresponds to the SC images in columns 1–3 (B‐E). This SC schematic highlights large non‐acidic compartments in green (marked by Btl‐GFP), and late endosomes and lysosomes in magenta. Schematic of a Z‐stack projection through the same SC (fourth panel). The outline of each SC in the schematics and images is approximated by a dashed circle. Note that both SCs and main cells are binucleate. As in the images (b‐e), two boxed non‐acidic compartments (third panel) are magnified in separate zoom images (A’). This allows DCGs to be visualised via DIC (top), and without DIC (bottom) highlights ILVs. In some cases (B’), the DCG is completely surrounded by fluorescent puncta, so the DIC outline cannot be easily seen. The central region of the lumen is shown schematically (A’’; 10 μm projection with 0.3 μm spacing) and in images (B’’‐E’’).Panels B‐E (columns 1–3) show basal wide‐field fluorescence views of living SCs from 6‐day‐old males expressing a UAS‐Btl‐GFP (green) and a UAS‐RNAi construct under temperature‐induced, SC‐specific GAL4 control from eclosion onwards. Acidic compartments are marked by LysoTracker Red (magenta). (B) SC expressing Btl‐GFP and rosy‐RNAi construct (control). Btl‐GFP‐positive ILVs (arrowheads; B’ bottom) are observed inside large non‐acidic compartments (arrowheads in SC > Btl‐GFP) and as puncta in AG lumen (B’’). DCGs are visible in mature Btl‐GFP‐positive compartments (DIC; B’ top). (c) SCs expressing Hrs‐RNAi lack DCGs (DIC; first column) and have a reduced proportion of Btl‐GFP‐positive ILV‐containing compartments (c’ bottom, g) and secreted puncta, representing secreted exosomes (c’’, h). (d) SCs expressing Vps28‐RNAi also have less DCGs and ILV‐containing compartments (D’ bottom, F), and have reduced exosome secretion (D’’, H). (e) SCs expressing Vps25‐RNAi form DCGs and enlarged ILVs in some non‐acidic compartments (E’ bottom; arrowhead). Exosome secretion is reduced (E’’, H). (f) Bar chart showing the number of non‐acidic Btl‐GFP‐positive compartments per SC with diameter > 0.4 μm in control versus ESCRT‐0 (Hrs), ‐I (Vps28), and ‐II (Vps25) knockdowns (n = 30 SCs). (g) Bar chart showing percentage of Btl‐GFP compartments containing Btl‐GFP‐positive ILVs for different genotypes (n = 30 SCs). (h) Bar chart showing number of Btl‐GFP‐positive fluorescent puncta in the lumen of AGs with ESCRT knockdown compared to control (n ≥ 10). Genotypes are: w; P[w+, tub‐GAL80ts]/+; dsx‐GAL4/P[w+, UAS‐btl‐GFP]/+ with UAS‐rosy‐RNAi knockdown construct (b), UAS‐Hrs‐RNAi‐#1 (c), UAS‐Vps28‐RNAi‐#1 (d), UAS‐Vps25‐RNAi‐#1 (e). Scale bars in B‐E and B’’‐E’’, 10 μm; in B’‐E’, 1 μm. Data were analysed by Kruskal‐Wallis test. ***p < 0.001 and ****p < 0.0001 relative to control. See also Figure S3 for additional ESCRT knockdowns tested, Figure S4 for second RNAi lines analysed (#2) and YFP‐Rab11 analysis, Figure S5 for representative DCG images
FIGURE 3
FIGURE 3
Both core and accessory ESCRT‐III components regulate exosome biogenesis in non‐acidic compartments of SCs. Panels A‐F show basal wide‐field fluorescence views of living SCs expressing Btl‐GFP (green; control schematic, Figure 2a, third panel). SC outline approximated by dashed white circles. Acidic compartments are marked by LysoTracker Red (magenta). Boxed non‐acidic compartments are magnified in A’‐F’ (Zoom). Transverse image projections of AG lumens are shown in A’’‐F’’. (a) Control SC expressing rosy‐RNAi. Btl‐GFP‐positive vesicle membranes are observed inside nearly 70% of large non‐acidic compartments (arrowheads; A’) and as puncta in AG lumen (A’’). (b) SC expressing Chmp2‐RNAi. Non‐acidic compartment number is increased (g). Btl‐GFP‐positive ILVs (B’ bottom, H) and puncta in the AG lumen are reduced (B’’, I), as are DCGs. Note the large lysosomes in surrounding main cells (B Projection), which are sometimes observed in glands containing ESCRT‐knockdown SCs. (c) SC expressing Chmp1‐RNAi. In this cell, non‐acidic compartment number is increased (g). Btl‐GFP‐positive ILVs, DCGs and puncta in the AG lumen are reduced (C’’, I). (d) SC expressing Chmp5‐RNAi. Btl‐GFP‐positive ILVs and puncta in the AG lumen are reduced (D’’, I). (e) SC expressing Ist1‐RNAi. Btl‐GFP‐positive ILVs, DCGs and puncta in the AG lumen are reduced (E’’, I). (f) SC expressing Vps4‐RNAi. Btl‐GFP‐positive compartments are greatly increased. Btl‐GFP‐positive ILVs, DCGs and puncta in the AG lumen are reduced (F’’, I). (g) Bar chart showing the number of non‐acidic Btl‐GFP‐positive compartments with diameter > 0.4 μm per SC in control vs ESCRT‐III knockdowns. Note that accessory ESCRT‐III knockdowns do not significantly affect overall compartment organisation and morphology, unlike Chmp2 and Vps4 knockdown. n = 30 SCs. (h) Bar chart showing percentage of Btl‐GFP‐positive compartments containing Btl‐GFP‐positive ILVs. n = 30 SCs. (i) Bar chart showing Btl‐GFP fluorescent puncta number in the lumen of AGs with ESCRT‐III knockdowns compared to controls. n ≥ 10 AG lumens.All data are from 6‐day‐old male flies shifted to 29°C at eclosion to induce expression of transgenes. Genotypes are: w; P[w+, tub‐GAL80ts]/+; dsx‐GAL4/P[w+, UAS‐btl‐GFP]/+ with UAS‐rosy‐RNAi knockdown construct (a), UAS‐Chmp2‐RNAi‐#1 (b), UAS‐Chmp1‐RNAi‐#1 (c), UAS‐Chmp5‐RNAi‐#1 (d), UAS‐Ist1‐RNAi‐#1 (e), UAS‐Vps4‐RNAi‐#1 (f). Scale bars in A‐F and A’’‐F’’, 10 μm, and in A’‐F’, 1 μm. Data were analysed by Kruskal‐Wallis test. *p < 0.05, ***p < 0.001 and ****p < 0.0001 relative to control. See Figure S4a‐c for additional RNAi lines tested
FIGURE 4
FIGURE 4
ESCRT‐III knockdown inhibits exosome biogenesis in non‐acidic SC compartments, but does not change compartment identity. Panels a‐f show basal wide‐field fluorescence views of living SCs expressing YFP‐Rab11 from its endogenous genomic location (yellow). SC outline approximated by dashed white circles. Acidic compartments are marked by LysoTracker® Red (magenta). Boxed non‐acidic compartments are magnified in A’‐F’ Zoom. (a) Control SC expressing rosy‐RNAi. Rab11‐positive ILV puncta are present inside approximately 50% of Rab11‐compartments (arrowheads; Zoom). (b) In SCs expressing Chmp2‐RNAi, YFP‐Rab11‐compartment number is increased (g), but YFP‐Rab11‐positive ILVs are strongly reduced (h) and DCGs modestly reduced. (c) In SCs expressing Chmp1‐RNAi, YFP‐Rab11‐compartment number is increased (g). YFP‐Rab11‐positive ILVs are reduced (h), but DCGs are not affected. (d) In SCs expressing Chmp5‐RNAi, YFP‐Rab11‐compartment number is unchanged (g). YFP‐Rab11‐positive ILVs are reduced (h), but DCGs are not affected. (e) In SCs expressing Ist1‐RNAi, YFP‐Rab11‐compartment number is unchanged (g). YFP‐Rab11‐positive ILVs are reduced (h), but DCGs are not affected. (f) In SCs expressing Vps4‐RNAi, YFP‐Rab11‐compartment number is greatly increased (g). YFP‐Rab11‐positive ILVs and DCGs are greatly reduced (h). (g) Bar chart showing the number of non‐acidic YFP‐Rab11‐positive compartments with diameter > 0.4 μm per SC in control vs ESCRT knockdowns. n = 30. (h) Bar chart showing percentage of YFP‐Rab11 compartments containing YFP‐Rab11‐positive ILV puncta. n = 30.All data are from 6‐day‐old males shifted to 29°C at eclosion to induce transgene expression. Genotypes are: w; P[w+, tub‐GAL80ts]/+; dsx‐GAL4; TI{TI}Rab11EYFP/+ with RNAi #1 lines for each gene. Scale bars in A‐F, 10 μm and in A’‐F’, 1 μm. Data were analysed by Kruskal‐Wallis test. ***p < 0.001 and ****p < 0.0001 relative to control. See also Figure S5 for images of gene knockdowns not depicted here, and Figure S4d, S4e for additional RNAi lines tested
FIGURE 5
FIGURE 5
Accessory ESCRT‐III proteins are not required for processing of ubiquitinylated ILV cargos in SCs. Panels a‐k show confocal basal images of fixed SCs isolated from males expressing Btl‐GFP and selected ESCRT‐RNAis from eclosion onwards. SC outline approximated by dashed white circles. Ubiquitin (magenta), GFP (green) and DAPI (blue; cells are binucleate) staining is shown. Nuclear staining with anti‐ubiquitin is sometimes observed, even in controls, but appears non‐specific. (a) Control SC expressing rosy‐RNAi. Essentially no cytoplasmic accumulation of ubiquitin is observed in contrast to core ESCRT knockdowns (b‐g), where ubiquitin accumulates strongly in the cytosol and some Btl‐GFP‐positive compartments (colocalization in white; L). (b) SC expressing Hrs‐RNAi. (c) SC expressing Stam‐RNAi. (d) SC expressing Vps28‐RNAi. (e) SC expressing Vps25‐RNAi. (f) SC expressing shrub‐RNAi. (g) SC expressing Chmp2‐RNAi. (h) SC expressing Chmp1‐RNAi, as for other accessory ESCRT‐III knockdowns (i‐k), does not accumulate ubiquitin in the cytoplasm (l). (i) SC expressing Chmp5‐RNAi. (j) SC expressing Ist1‐RNAi. (k) SC expressing Vps4‐RNAi. (l) Bar chart showing proportion of SCs per gland that accumulate ubiquitin in the cytoplasm in control and ESCRT knockdowns. n ≥ 6 AGs. (m) Kaplan–Meier plot of remating for females initially mated with males expressing rosy‐RNAi, Chmp5‐RNAi or BMP antagonist Dad in adult SCs under esgF/Ots control. Inhibiting BMP signalling, which suppresses secretion, or Chmp5 expression is associated with more rapid remating of females. Similar effects were observed in three independent experiments. All data are from 6‐day‐old male flies shifted to 29°C at eclosion to induce transgene expression. Note that fixation required for ubiquitin visualisation disrupts SC subcellular morphology, when compared to live imaging. Genotypes are: w; P[w+, tub‐GAL80ts]/+; dsx‐GAL4/P[w+, UAS‐btl‐GFP] with rosy‐ or RNAi #1 lines (a‐l) and w; esg‐GAL4 tub‐GAL80ts UAS‐FLP/CyO; UAS‐GFPnls actin > FRT > CD2 > FRT > GAL4/TM6 with rosy‐RNAi, chmp5‐RNAi #2 or UAS‐Dad (m). Scale bars in A‐K, 10 μm. Ubiquitinylation data were analysed by Kruskal‐Wallis test. The remating data were analysed versus rosy‐RNAi control using a Gehan‐Breslow‐Wilcoxon test. *p < 0.05, **p < 0.01, ***p < 0.001 and ****p < 0.0001 relative to control
FIGURE 6
FIGURE 6
Inducible knockdown of CHMP5 selectively reduces Rab11a‐exosome production from glutamine‐depleted HCT116 cells. (a) Western blot analysis of putative exosome proteins in sEV preparations isolated by size‐exclusion chromatography (SEC) from glutamine‐depleted (0.15 mM) EV‐secreting HCT116 cells transduced with a CHMP5 (shCHMP5) compared to a non‐targeting (shNT) shRNA construct. Proteins were detected from gels with sample loading normalised to total cell lysate protein levels and the fold change in CHMP5 knockdown cells determined. Note the more variable effects of knockdown on some of the sEV markers, but not Rab11a, in the bar chart. This is presumably the result of different levels of transient CHMP5 knockdown. Data derived from three independent experiments. (B) Nanosight tracking analysis of sEVs for diluted samples (normalised to cell lysate protein levels) shows no change in particle size and number. (C) Western blot analysis of putative exosome proteins from glutamine‐depleted (0.15 mM) EV‐secreting HCT116 cells transduced with a CHMP5 (shCHMP5) compared to a non‐targeting (shNT) shRNA construct shows selective reduction in CHMP5 protein levels. The activity of mTORC1 was assessed via phosphorylation of S6 and 4E‐BP1, using phospho‐specific antibodies and a pan 4E‐BP1 antibody. Bar chart shows protein levels normalised to tubulin. Data derived from three independent experiments. (D) Western analysis of sEV preparations isolated by SEC from HCT116 colorectal cancer cells, which contain a stable IPTG‐inducible CHMP5 shRNA knockdown construct (clone #28; shCHMP5 #28), cultured in glutamine‐depleted (0.15 mM) conditions for 24 h. sEVs were collected from cells cultured in the absence (‐) or presence (+) of IPTG, both for 96 h previously and during the collection period. Putative exosome proteins were detected from gels with sample loading normalised to total cell lysate protein levels. Bar charts represent changes in levels of these putative exosome proteins relative to levels in the non‐IPTG‐induced sample. Data derived from five independent experiments. (E) Nanosight Tracking Analysis of sEVs for the shCHMP5 #28 samples produced in (D) show no change in particle size and number. (F) Western blot analysis of putative exosome proteins in EV‐secreting cells carrying a stable IPTG‐inducible CHMP5 (shCHMP5 #28) shRNA construct, under glutamine‐depleted (0.15 mM) conditions, in the presence or absence of IPTG, reveals selective reduction in CHMP5 protein levels. Bar charts derived from three independent experiments. All data for bar charts were analysed by the Kruskal‐Wallis test: *p < 0.05; n.s. = not significant. Bars and error bars denote mean ± SD
FIGURE 7
FIGURE 7
Inducible knockdown of CHMP5 reduces the growth‐promoting effects of glutamine‐depletion‐induced sEVs on HCT116 recipient cells. (A) Growth curves in low (1%) serum are for HCT116 recipient cells cultured in glutamine‐depleted medium, pre‐treated with the sEV preparations from HCT116 cells carrying an inducible‐CHMP5 (clone #14; red lines, solid without IPTG and dashed following IPTG induction of CHMP5 knockdown) or an inducible‐non‐targeting (NT; blue lines, solid without IPTG and dashed following IPTG induction) shRNA knockdown construct compared to PBS (black solid line). Note that sEV preparations from this clone under glutamine depletion and in the absence of IPTG do not induce more growth than controls, suggesting that there is already some effect on the activity of these sEVs before induction of knockdown, probably because of leaky expression of the CHMP5‐shRNA. sEVs were separated by SEC. Growth curves were reproduced in three independent experiments and analysed by one‐way ANOVA. **** p ≤ 0.0001. (B) Growth curves in low (1%) serum are for HCT116 recipient cells cultured in glutamine‐depleted medium, pre‐treated with the sEV preparations, from HCT116 cells carrying an inducible‐CHMP5 (clone #28; red lines, solid without IPTG and dashed following IPTG induction of CHMP5 knockdown) shRNA knockdown construct compared to PBS (black solid line). sEVs were separated by SEC. Growth curves were reproduced in three independent experiments and analysed by one‐way ANOVA. *** ≤ 0.001. (C) Schematic model illustrating the mild effect of inducing accessory‐ESCRT‐III knockdown on the endosomal network compared to control cells, most clearly apparent in Drosophila secondary cells. This is accompanied by a major reduction in intraluminal vesicle formation within multivesicular endosomes labelled with the recycling endosomal marker Rab11(a) and selective reduction in exosomes secreted from these compartments, termed ‘Rab11(a)‐exosomes’, a subset of which are labelled with Rab11(a). In contrast, knockdown of the core ESCRT components leads to disruption of the endosomal network and also has a major impact on intraluminal vesicle formation from both late and recycling multivesicular endosomes

References

    1. Agromayor, M. , Carlton, J. G. , Phelan, J. P. , Matthews, D. R. , Carlin, L. M. , Ameer‐Beg, S. , Bowers, K. , & Martin‐Serrano, J. (2009). Essential role of hIST1 in cytokinesis. Molecular Biology of the Cell, 20, 1374–1387. 10.1091/mbc.e08-05-0474 - DOI - PMC - PubMed
    1. Azmi, I. , Davies, B. , Dimaano, C. , Payne, J. , Eckert, D. , Babst, M. , & Katzmann, D. J. (2006). Recycling of ESCRTs by the AAA‐ATPase Vps4 is regulated by a conserved VSL region in Vta1. Journal of Cell Biology, 172, 705–717. 10.1083/jcb.200508166 - DOI - PMC - PubMed
    1. Azmi, I. F. , Davies, B. A. , Xiao, J. , Babst, M. , Xu, Z. , & Katzmann, D. J. (2008). ESCRT‐III family members stimulate Vps4 ATPase activity directly or via Vta1. Developmental Cell, 14, 50–61. 10.1016/j.devcel.2007.10.021 - DOI - PubMed
    1. Babst, M. , Katzmann, D. J. , Estepa‐Sabal, E. J. , Meerloo, T. , & Emr, S. D. (2002a). Escrt‐III: An endosome‐associated heterooligomeric protein complex required for mvb sorting. Developmental Cell, 3, 271–282. 10.1016/S1534-5807(02)00220-4 - DOI - PubMed
    1. Babst, M. , Wendland, B. , Estepa, E. J. , & Emr, S. D. (1998). The Vps4p AAA ATPase regulates membrane association of a Vps protein complex required for normal endosome function. Embo Journal, 17, 2982–2993. 10.1093/emboj/17.11.2982 - DOI - PMC - PubMed

Publication types

Substances

LinkOut - more resources