. 2023 Mar 5;18(1):8.
doi: 10.1186/s13062-023-00364-y.

S-adenosylhomocysteine hydrolase-like protein 1 (AHCYL1) inhibits lung cancer tumorigenesis by regulating cell plasticity

Affiliations

S-adenosylhomocysteine hydrolase-like protein 1 (AHCYL1) inhibits lung cancer tumorigenesis by regulating cell plasticity

Melina Muñoz-Bernart et al. Biol Direct. .

Erratum in

Abstract

Background: Lung cancer is one of the most frequently diagnosed cancers characterized by high mortality, metastatic potential, and recurrence. Deregulated gene expression of lung cancer, likewise in many other solid tumors, accounts for their cell heterogeneity and plasticity. S-adenosylhomocysteine hydrolase-like protein 1 (AHCYL1), also known as Inositol triphosphate (IP(3)) receptor-binding protein released with IP(3) (IRBIT), plays roles in many cellular functions, including autophagy and apoptosis but AHCYL1 role in lung cancer is largely unknown.

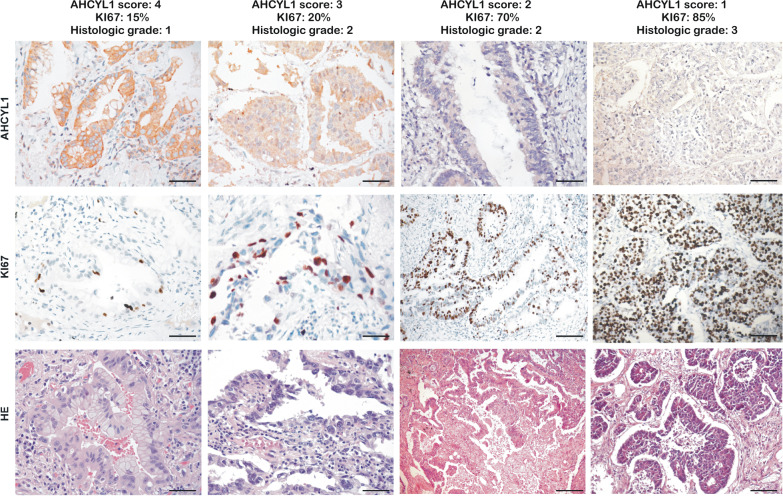
Results: Here, we analyzed the expression of AHCYL1 in Non-Small Cell Lung Cancer (NSCLC) cells from RNA-seq public data and surgical specimens, which revealed that AHCYL1 expression is downregulated in tumors and inverse correlated to proliferation marker Ki67 and the stemness signature expression. AHCYL1-silenced NSCLC cells showed enhanced stem-like properties in vitro, which correlated with higher expression levels of stem markers POU5F1 and CD133. Also, the lack of AHCYL1 enhanced tumorigenicity and angiogenesis in mouse xenograft models highlighting stemness features.

Conclusions: These findings indicate that AHCYL1 is a negative regulator in NSCLC tumorigenesis by modulating cell differentiation state and highlighting AHCYL1 as a potential prognostic biomarker for lung cancer.

Keywords: Biomarker; IRBIT; Lung cancer stem cells (LCSC); NSCLC.


Conflict of interest statement

The authors have no relevant financial or non-financial interests to disclose.

Figures

Fig. 1
Fig. 1
Transcriptomic analysis and immunohistochemistry assay of AHCYL1 in human lung cancer. A Column scatter plot showing the normalized (log2 (normcount + 1)) expression of AHCYL1 mRNA in normal tissue (n = 110) versus primary tumor (n = 1016) (Mann–Whitney Test, p = 0.0008). B IHC analysis of representative tissue samples from normal lung and lung adenocarcinoma tumor stained with an anti-AHCYL1 and Ki67antibodies. Scale bars = 100 µm. Original magnification × 200. C Column scatter plot showing the normalized (log2 (normcount + 1)) expression of AHCYL1 mRNA in primary tumors (n = 13) vs. corresponding recurrence (n = 38) (p = 0.0403) vs. distant metastasis (n = 67) (p = 0.0209) (One-Way ANOVA, Tukey’s multiple comparisons test). D Spearman’s correlation analysis o AHCYL1 expression vs. Ki67 expression (n = 1105; p < 0.0001). E Kaplan–Meier for patients with Low AHCYL1-High Ki67 versus High AHCYL1-Low Ki67 analyzed with Mantel-Cox test (n = 1925; p = 0.00012). F Spearman’s correlation and linear regression analysis of AHCYL1 expression versus stemness score (n = 1105; p < 0.0001). G High AHCYL1 Low Ki67 (n = 279) versus Low AHCYL1 High Ki67 (n = 381) stemness index (RNA expression based) (unpaired T test, p < 0.0001). H High AHCYL1 Low Ki67 (n = 279) versus Low AHCYL1 High Ki67 (n = 381) stemness index (epigenetically regulated RNA expression based) (unpaired T test with Welch correction, p < 0.0001). *p < 0.05, ***p < 0.001, ****p < 0.0001
Fig. 2
Fig. 2
IHC staining of representative tissue samples with different types and grades of lung tumor. Sample sections stained with an anti–AHCYL1 antibody (top), anti-Ki67 antibody (middle) and Hematoxylin–Eosin (HE, bottom) for histologic grade score (n = 20). Scale bar, 100 µm
Fig. 3
Fig. 3
AHCYL1 expression in 3D-culture in A549 cell line and cell differentiation states of stably silenced AHCYL1 cells. A Representative phase-contrast microscopy images of human A549 LC cells grown as monolayers (2D) and spheroids (3D) culture enriched in LCSCs at 3 and 7 days. Ref: 1 mm. B Western Blot analysis of AHCYL1 (60 kDa), POU5F1 (48 kDa), and CD44 (75 kDa) protein levels of 2D and 3D culture of A549 lung adenocarcinoma cell line. GAPDH (37 kDa) was used as a loading control. The samples correspond to spheroids of 7 days. The blot corresponds to a representative experiment of three. C FACS analysis of CD133 expression in A549 monolayer vs spheres cultures. A549 spheres are enriched in CD133 expression. D qRT-PCR analysis of AHCYL1, stem cell markers POU5F1 and CD44 and lung marker MUC5B. Gene expression levels in sphere were normalized to their expression in monolayer cultures. RPL19 was used as a normalization control. T-test with Welch's correction (n = 3–5). E qRT-PCR analysis of KD-AL1-1, AL1-2, AL-1-3, and AL-1-4 A549 cells lines showing significantly decreased expression of AHCYL1 mRNA levels compared to non-targeting (NT) control cells. RPL19 was used as a normalization control. ANOVA followed by Dunnet's test (n = 3). Western blot analysis showing AHCYL1 protein level decreased for each line and increased POU5F1 (48 kDa) protein level. GAPDH (37 kDa) was used as a loading control. The blot corresponds to a representative experiment of three. F RT-qPCR analyzing the expression of the pluripotency markers POU5F1, AHCY, CD133, and MUC5B as differentiation marker in the lung in KD-AL1-2 and KD-AL1-4 cells compared to NT control cells. RPL19 was used as a normalization control. ANOVA followed by Dunnet’s test (n = 3). G Stem cell frequency was calculated using online Extreme Limiting Dilutions Assay (ELDA) analysis program. Significant differences in stem cell frequencies was determined between NT (1/49.83) and KD-AL1-2 (1/13.10) or KD-AL-1–4 (1/7.46) cells. The graph corresponds to a representative test (n = 3, p ≤ 0.001, in six replicates). The solid line shows the mean and the dotted lines show the confidence interval. *p < 0.05, **p < 0.01, ***p < 0.001, ****p < 0.0001
Fig. 4
Fig. 4
Silencing of AHCYL1 increases the tumorigenic and angiogenic capacities in vivo. AF NODscid Female mice (n = 8–11 mice per group), and Male (n = 7–8 mice per group) were subcutaneously injected with 2 × 106 A549 cells stably expressing control shRNA (NT) or AHCYL1 shRNA (KD-AL1-4). Average tumor volume ± SD is plotted against time (in days). Different shading corresponds to two independent experiments. Differences were evaluated using a Repeated Measures Design. Final tumor weight and volume are also shown. Means were compared using ANOVA followed by Dunnet’s test. B A549 cells (106, cells, each condition) were intradermal injected in the right flank of NODscid male mice (n = 6–7 mice per group). Vehicle (DMEM without FBS) was injected in the left flank. After 7 days, photographs of skin were taken under magnification glass to quantify vessel density. Representative photograph for each condition (NT vs KD-AL1-4) are shown. Bar: 5 mm. C Quantification (mm2) of vessel density in each condition (n = 13–15 per group). Circles and triangles are used to identify individuals from two independent experiments. Means were compared using a T-test. D Western Blot of VEGF-A (23, 27 and 42 kDa) in NT control and AHCYL1-depleted cells (KD-AL1-4). Quantification of VEGF band (23 kDa) from the western blot of D showing decreased VEGF protein level in AHCYL1 silenced cells (KD-AL1-4). *p < 0.05, **p < 0.01, ***p < 0.001
Fig. 5
Fig. 5
Detection of SAM and SAH by UPLC-QTOF-MS. A Schematic representation of the methionine cycle, the proposed inhibitory action of AHCYL1 on AHCY, and the interaction with SAH. MTR: Methionine synthase. MAT2A: Methionine adenosyl transferase 2A. Normalized chromatographic peak areas for SAM (B) and SAH (C) for NT and KD-AHCYL1-4 cells (n = 16 for each cell line, p = 0.026). D SAM/SAH ratio for NT and KD-AHCYL1-4 cells calculated for each sample (n = 16, p = 0.007). *p ≤ 0.05, **p ≤ 0.01. E Western blot analysis of AHCYL1 protein level and H3K4,-K9 and -27 methylation levels. Total histone H3 was used as a loading control. The blot corresponds to a representative experiment of two or three blots with similar results

References

    1. Herbst RS, Morgensztern D, Boshoff C. The biology and management of non-small cell lung cancer. Nature. 2018;553(7689):446–454. doi: 10.1038/nature25183. - DOI - PubMed
    1. Hanahan D, Weinberg RA. Hallmarks of cancer: the next generation. Cell. 2011;144(5):646–674. doi: 10.1016/j.cell.2011.02.013. - DOI - PubMed
    1. Shenoy S. Cell plasticity in cancer: a complex interplay of genetic, epigenetic mechanisms and tumor micro-environment. Surg Oncol. 2020;34(February):154–162. doi: 10.1016/j.suronc.2020.04.017. - DOI - PubMed
    1. MacDonagh L, Gray SG, Breen E, et al. Lung cancer stem cells: the root of resistance. Cancer Lett. 2016;372(2):147–156. doi: 10.1016/j.canlet.2016.01.012. - DOI - PubMed
    1. Jen J, Tang Y, Lu Y, Lin C, Lai W, Wang Y. Oct4 transcriptionally regulates the expression of long non-coding RNAs NEAT1 and MALAT1 to promote lung cancer progression. Mol Cancer. 2017;16(1):104. doi: 10.1186/s12943-017-0674-z. - DOI - PMC - PubMed

Publication types

Substances