

Visual atrophy rating scales and amyloid PET status in an Alzheimer's disease clinical cohort
- PMID: 36872523
- PMCID: PMC10109315
- DOI: 10.1002/acn3.51749
Visual atrophy rating scales and amyloid PET status in an Alzheimer's disease clinical cohort
Abstract
Objectives: Visual rating scales (VRS) are the quantification method closest to the approach used in routine clinical practice to assess brain atrophy. Previous studies have suggested that the medial temporal atrophy (MTA) rating scale is a reliable diagnostic marker for AD, equivalent to volumetric quantification, while others propose a higher diagnostic utility for the Posterior Atrophy (PA) scale in early-onset AD.
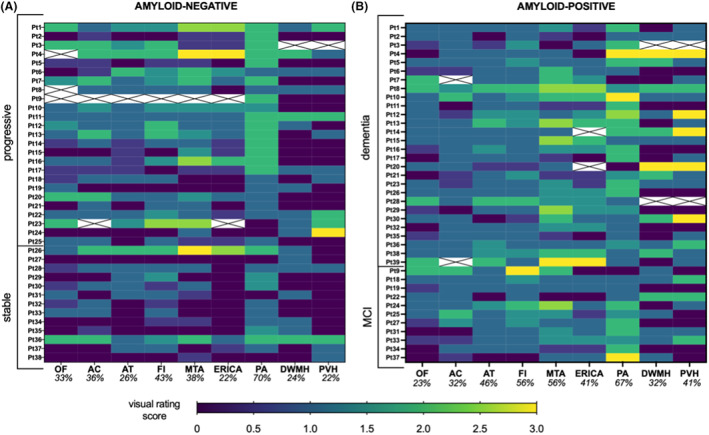
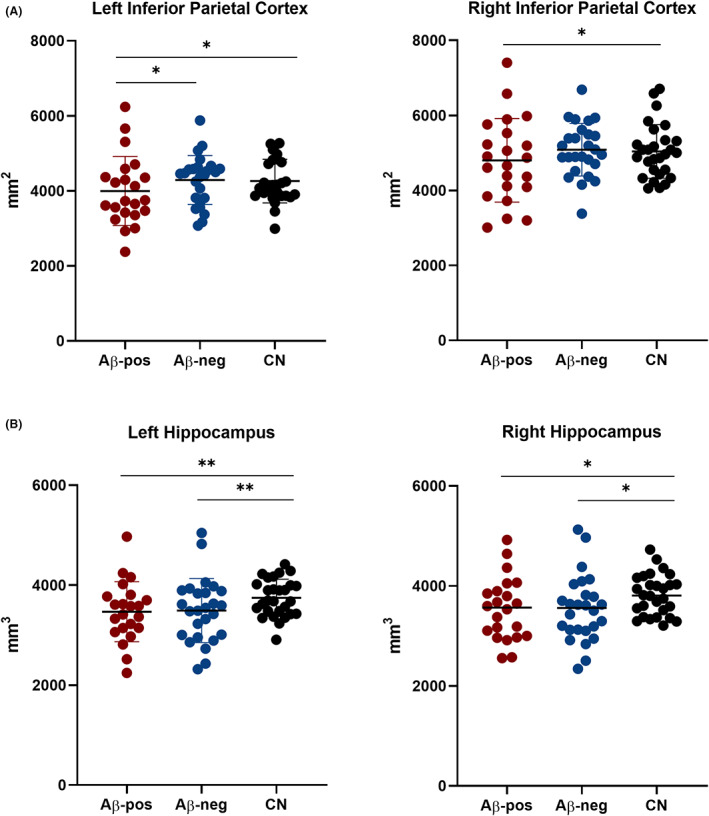
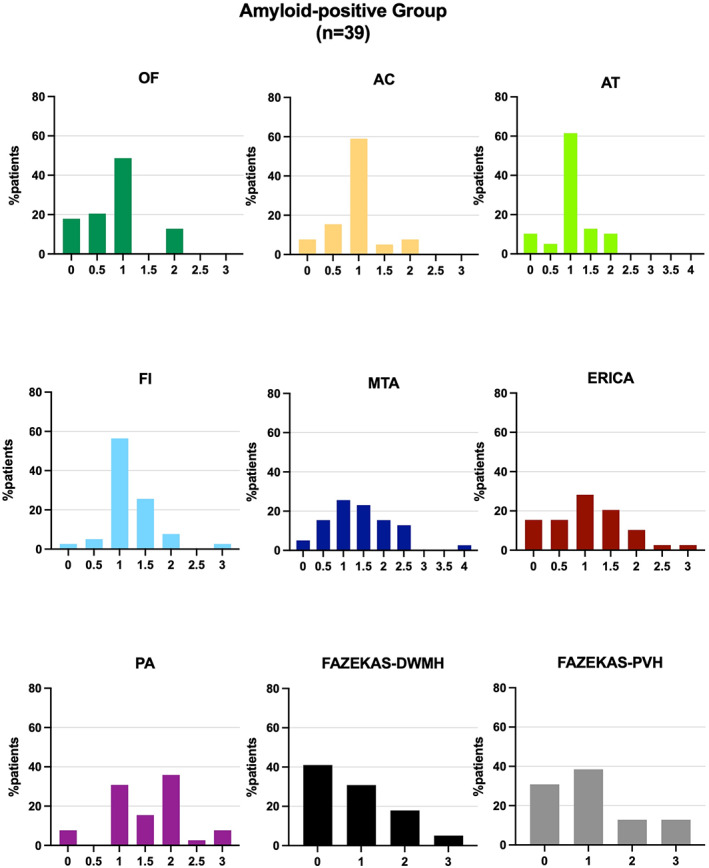
Methods: Here, we reviewed 14 studies that assessed the diagnostic accuracy of PA and MTA, we explored the issue of cut-off heterogeneity, and assessed 9 rating scales in a group of patients with biomarker-confirmed diagnosis. A neuroradiologist blinded to all clinical information rated the MR images of 39 amyloid-positive and 38 amyloid-negative patients using 9 validated VRS assessing multiple brain regions. Automated volumetric analyses were performed on a subset of patients (n = 48) and on a group of cognitively normal individuals (n = 28).
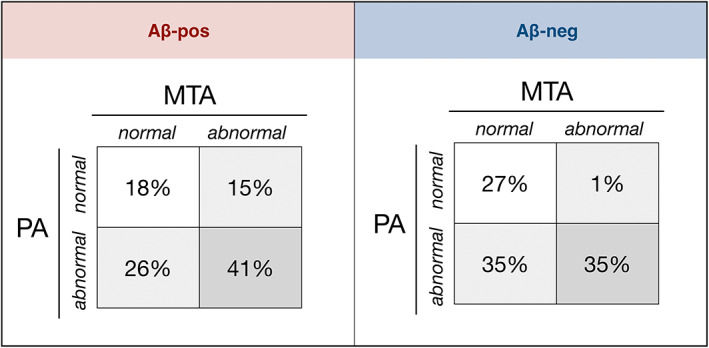
Results: No single VRS could differentiate amyloid-positive from amyloid-negative patients with other neurodegenerative conditions. 44% of amyloid-positive patients were deemed to have age-appropriate levels of MTA. In the amyloid-positive group, 18% had no abnormal MTA or PA scores. These findings were substantially affected by cut-off selection. Amyloid-positive and amyloid-negative patients had comparable hippocampal and parietal volumes, and MTA but not PA scores correlated with the respective volumetric measures.
Interpretation: Consensus guidelines are needed before VRS can be recommended for use in the diagnostic workup of AD. Our data are suggestive of high intragroup variability and non-superiority of volumetric quantification of atrophy over visual assessment.
© 2023 The Authors. Annals of Clinical and Translational Neurology published by Wiley Periodicals LLC on behalf of American Neurological Association.
Conflict of interest statement
ZW previously participated in the Eli Lilly PET advisory board and was an amyloid‐PET read trainer. CC has taken part in an advisory panel for Roche Pharmaceuticals. RP previously sat on an advisory board for Eli Lilly and received support from GE for research imaging from 2014 to 2018. PM has given an educational talk at a meeting organized by GE. None of the authors currently have funding or support from any commercial organization involved in amyloid PET imaging. FL, AG, GS, and NP report not disclosures relevant to the manuscript.
Figures
References
-
- Dubois B, Feldman HH, Jacova C, et al. Advancing research diagnostic criteria for Alzheimer's disease: the IWG‐2 criteria. Lancet. 2014;13:614‐629. - PubMed
Publication types
MeSH terms
Grants and funding
LinkOut - more resources
Full Text Sources
Medical