. 2023 Feb 13;4(2):100184.
doi: 10.1016/j.xhgg.2023.100184. eCollection 2023 Apr 13.

Low and differential polygenic score generalizability among African populations due largely to genetic diversity

Affiliations

Low and differential polygenic score generalizability among African populations due largely to genetic diversity

Lerato Majara et al. HGG Adv. .

Abstract

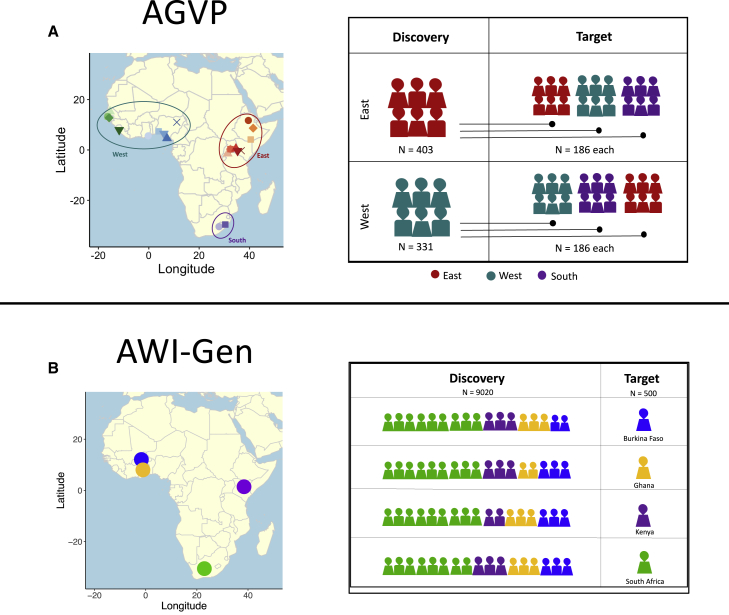
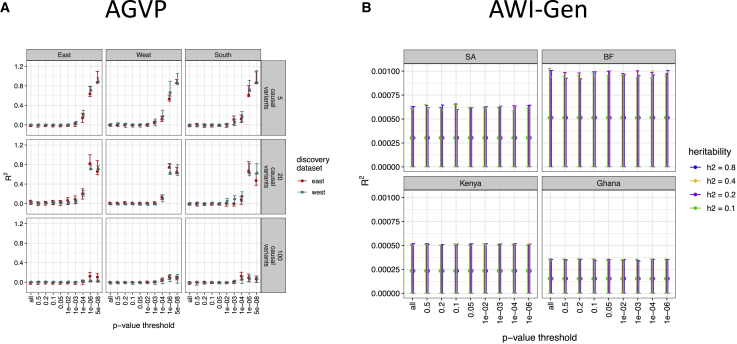
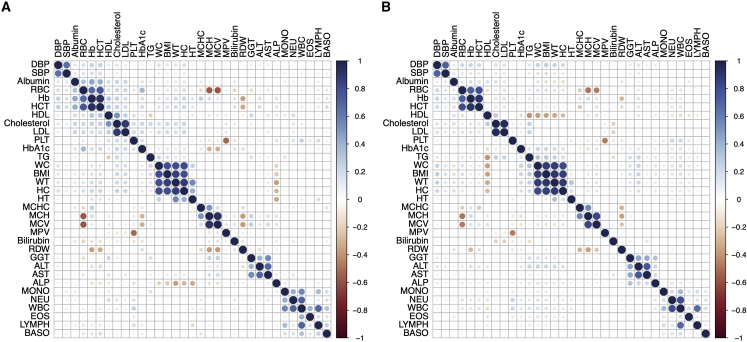
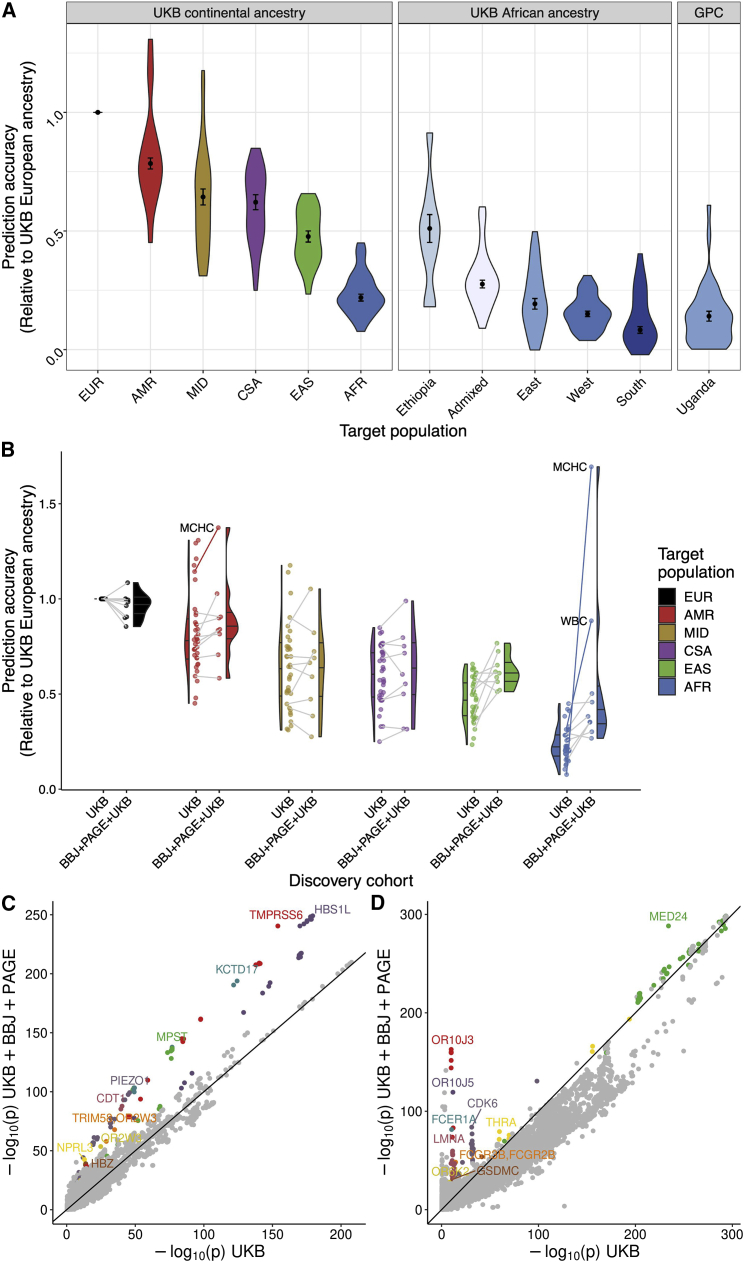
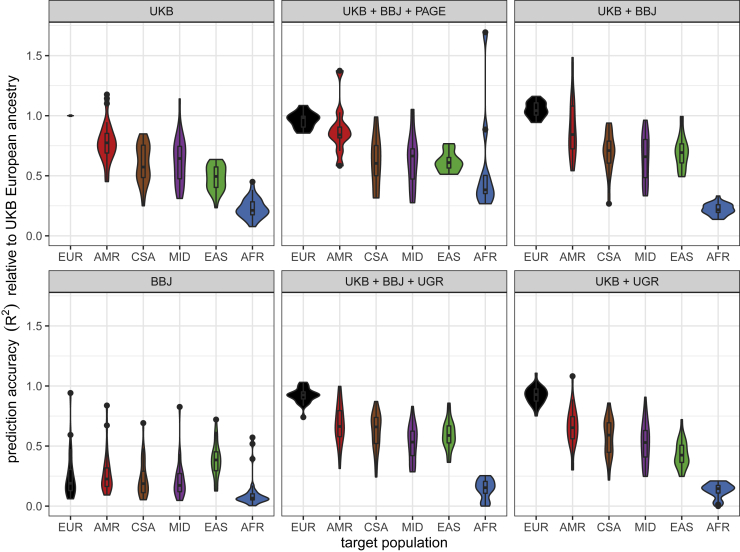
African populations are vastly underrepresented in genetic studies but have the most genetic variation and face wide-ranging environmental exposures globally. Because systematic evaluations of genetic prediction had not yet been conducted in ancestries that span African diversity, we calculated polygenic risk scores (PRSs) in simulations across Africa and in empirical data from South Africa, Uganda, and the United Kingdom to better understand the generalizability of genetic studies. PRS accuracy improves with ancestry-matched discovery cohorts more than from ancestry-mismatched studies. Within ancestrally and ethnically diverse South African individuals, we find that PRS accuracy is low for all traits but varies across groups. Differences in African ancestries contribute more to variability in PRS accuracy than other large cohort differences considered between individuals in the United Kingdom versus Uganda. We computed PRS in African ancestry populations using existing European-only versus ancestrally diverse genetic studies; the increased diversity produced the largest accuracy gains for hemoglobin concentration and white blood cell count, reflecting large-effect ancestry-enriched variants in genes known to influence sickle cell anemia and the allergic response, respectively. Differences in PRS accuracy across African ancestries originating from diverse regions are as large as across out-of-Africa continental ancestries, requiring commensurate nuance.

Keywords: Africa; GWAS; global health; health disparities; polygenic scores; population genetics.


Conflict of interest statement

The authors declare no competing interests.

Figures

Figure 1
Figure 1
Simulation strategy overview (A) We used AGVP for simulations in West, East, and South African populations that were grouped based on the United Nations geoscheme groupings. Each group was divided into discovery and target subgroups. GWAS discovery cohorts included East (n = 403) and West (n = 331) African individuals, which were independent of each target cohort (n = 186 individuals per region). South African individuals were excluded from the discovery population due to the limited total sample size (two populations and 186 individuals total). (B) We used AWI-Gen for simulations in Burkina Faso (n = 1703), Ghana (n = 1,661), Kenya (n = 1,701), and South Africa (n = 4,455). For these simulations we withheld 500 individuals from each of the groups, which were used as the target cohort. The GWAS discovery cohort included the 9,020 individuals who were not in the target cohort. Each figure represents roughly 500 individuals. BF, Burkina Faso; SA, South Africa.
Figure 2
Figure 2
Simulated GWAS and polygenic scores indicate differential prediction accuracy across diverse regions of Africa (A) Predictive accuracy of the simulated quantitative trait in AGVP at the heritability of 0.8. The predictive accuracy was calculated for six categories of causal variants for the West and East discovery cohorts, across 10 p-value thresholds. Only the top three categories are shown here, the rest can be found in Figures S1–S4. (B) Predictive accuracy of simulated quantitative traits in AWI-Gen for various trait heritability rates across 10 p-value thresholds. The error bars represent the lower and upper limits of 95% confidence interval.
Figure 3
Figure 3
Phenotype correlations among 33 quantitative traits measured in the Uganda GPC data and the UK Biobank (A) Phenotypic correlations measured in traits in the Uganda GPC among unrelated individuals. (B) Phenotypic correlations in the unrelated UK Biobank European ancestry individuals. (A and B) Phenotypes were mean centered and adjusted for age and sex within each cohort prior to correlation analysis. The order of each phenotype correlation is determined by hierarchical clustering in the Uganda GPC.
Figure 4
Figure 4
PRS accuracy and corresponding genetic variant contributions for up to 34 traits within and across diverse ancestries (A) PRS accuracy relative to European ancestry individuals in diverse target ancestries. Discovery data consisted of GWAS summary statistics from UK Biobank (UKB) European ancestry data. Target data consisted of globally diverse continental ancestries (including withheld European target individuals) and regional African ancestry participants from UKB, or unrelated individuals from the Uganda GPC cohort. Traits were filtered to those with a 95% confidence interval range in PRS accuracy <0.08. (B) PRS accuracy from a homogeneous versus multi-ancestry discovery dataset. GWAS discovery data consisted of summary statistics from UKB European ancestry data only or from the meta-analysis of UKB, BioBank Japan (BBJ), and Population Architecture using Genomics and Epidemiology (PAGE). Target populations are from the UKB. Lines connect the 10 traits available in both discovery cohorts to indicate how accuracy changed for the same trait in the UKB only versus meta-analyzed discovery data, while half violin plots show the distribution across all phenotypes in each discovery cohort. When lines are missing, the trait is absent in PAGE. Trait outliers are labeled in text and with solid lines. (A and B) Relative PRS accuracies are compared to the maximum for each trait in target samples withheld from discovery consisting of UKB European ancestry individuals. To simplify comparisons, only the polygenic scores with the highest prediction accuracy are shown here. Colors in these two panels correspond to the same continental ancestries. (C and D) Trait-specific genetic outlier plots. QQ-like plot showing p values in UKB only versus multi-cohort meta-analysis of UKB, BBJ, and PAGE. The 10 regions that are genome-wide significant in both dataset and show the most significant differences are colored and labeled for (C) MCHC, and (D) WBC.
Figure 5
Figure 5
Relative PRS accuracy using the same target individuals and varying discovery cohorts All relative comparisons are with respect to accuracy in withheld EUR when predicting with UKB European GWAS summary statistics alone as the discovery cohort.

References

    1. Visscher P.M., Wray N.R., Zhang Q., Sklar P., McCarthy M.I., Brown M.A., Yang J. 10 Years of GWAS discovery: biology, function, and translation. Am. J. Hum. Genet. 2017;101:5–22. - PMC - PubMed
    1. Morales J., Welter D., Bowler E.H., Cerezo M., Harris L.W., McMahon A.C., Hall P., Junkins H.A., Milano A., Hastings E., et al. A standardized framework for representation of ancestry data in genomics studies, with application to the NHGRI-EBI GWAS Catalog. Genome Biol. 2018;19:21. - PMC - PubMed
    1. Popejoy A.B., Fullerton S.M. Genomics is failing on diversity. Nature. 2016;538:161–164. - PMC - PubMed
    1. Martin A.R., Kanai M., Kamatani Y., Okada Y., Neale B.M., Daly M.J. Clinical use of current polygenic risk scores may exacerbate health disparities. Nat. Genet. 2019;51:584–591. - PMC - PubMed
    1. Manrai A.K., Funke B.H., Rehm H.L., Olesen M.S., Maron B.A., Szolovits P., Margulies D.M., Loscalzo J., Kohane I.S. Genetic misdiagnoses and the potential for health disparities. N. Engl. J. Med. 2016;375:655–665. - PMC - PubMed

Publication types

MeSH terms

LinkOut - more resources