. 2023 Feb;13(2):577-597.
doi: 10.1016/j.apsb.2022.07.019. Epub 2022 Aug 10.

Honokiol alleviated neurodegeneration by reducing oxidative stress and improving mitochondrial function in mutant SOD1 cellular and mouse models of amyotrophic lateral sclerosis

Affiliations

Honokiol alleviated neurodegeneration by reducing oxidative stress and improving mitochondrial function in mutant SOD1 cellular and mouse models of amyotrophic lateral sclerosis

Yujun Zhou et al. Acta Pharm Sin B. 2023 Feb.

Abstract

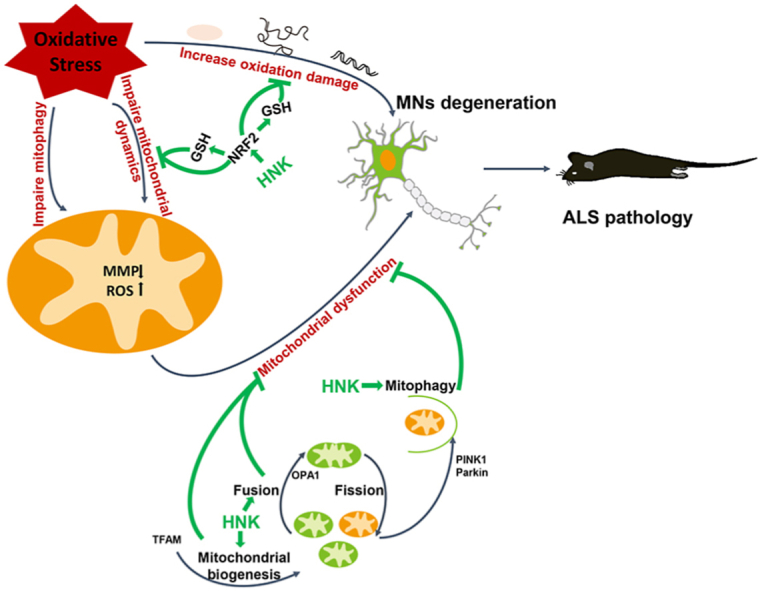
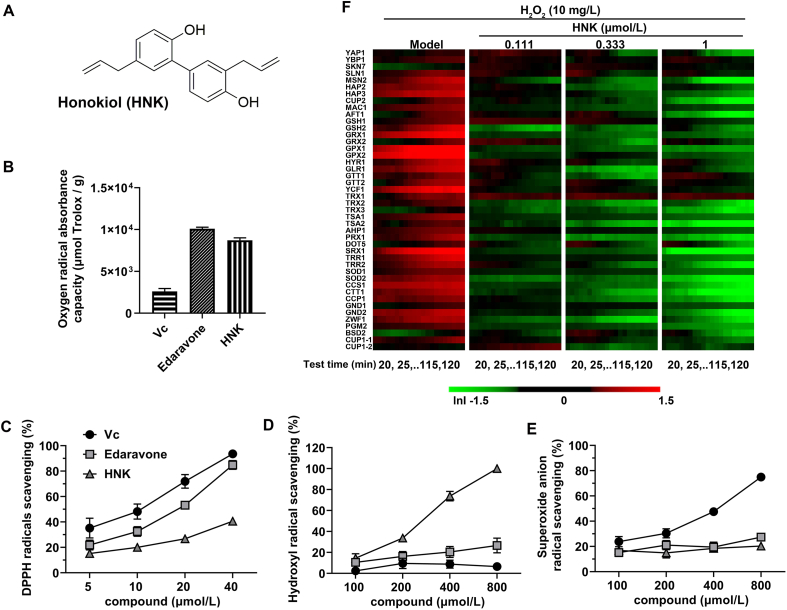
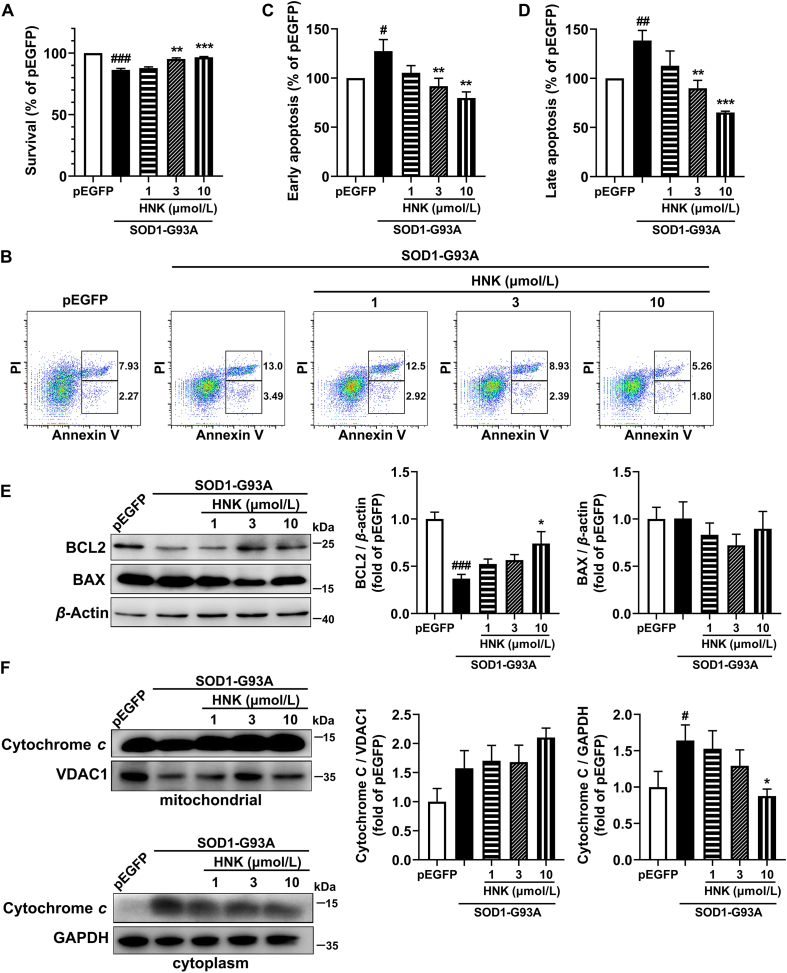
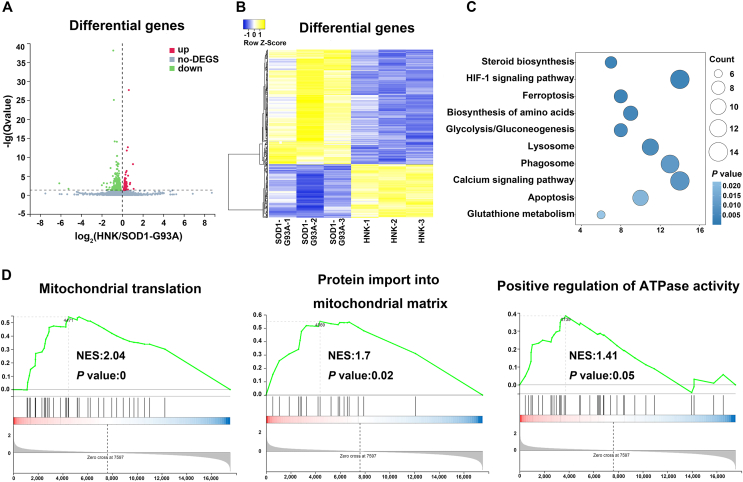
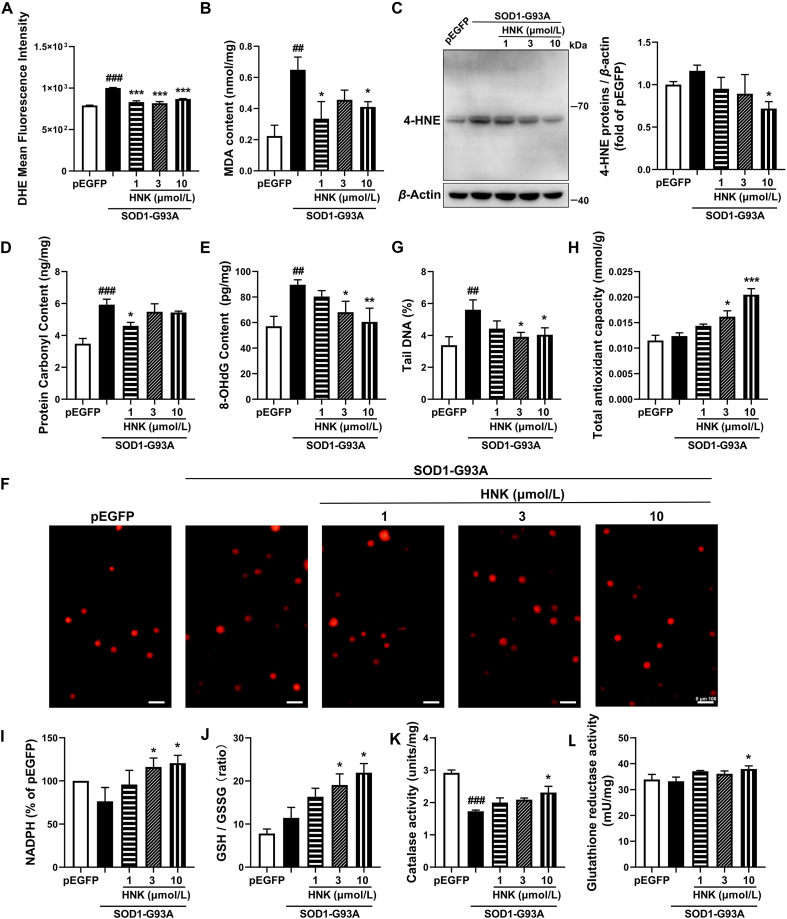
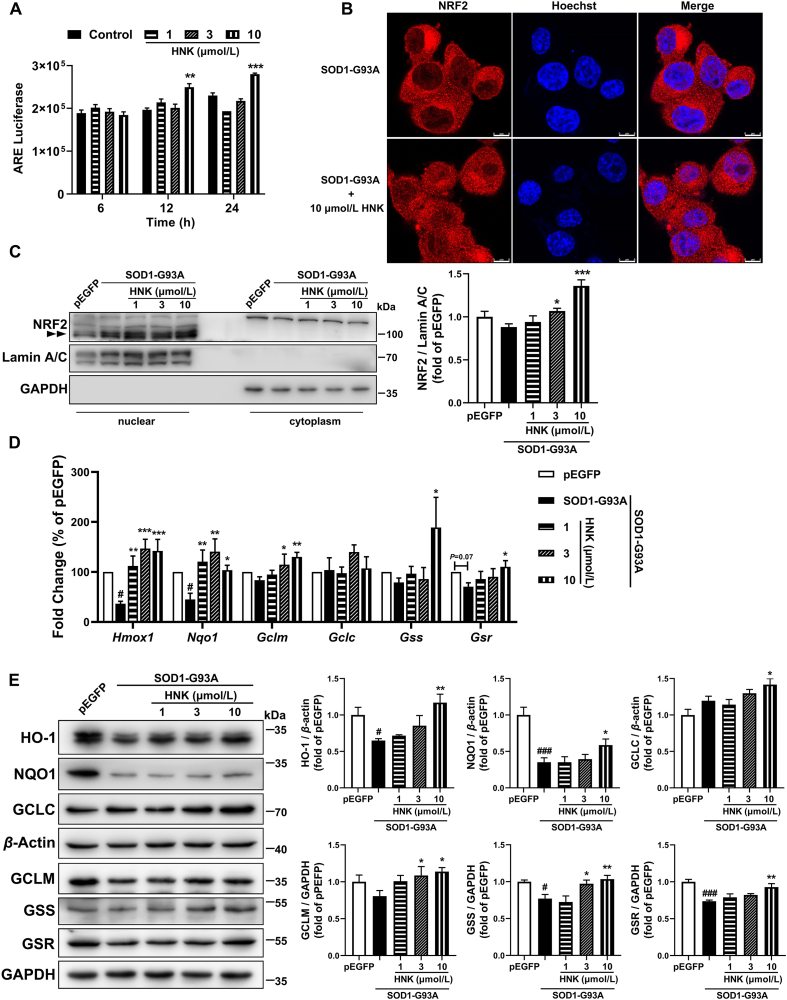
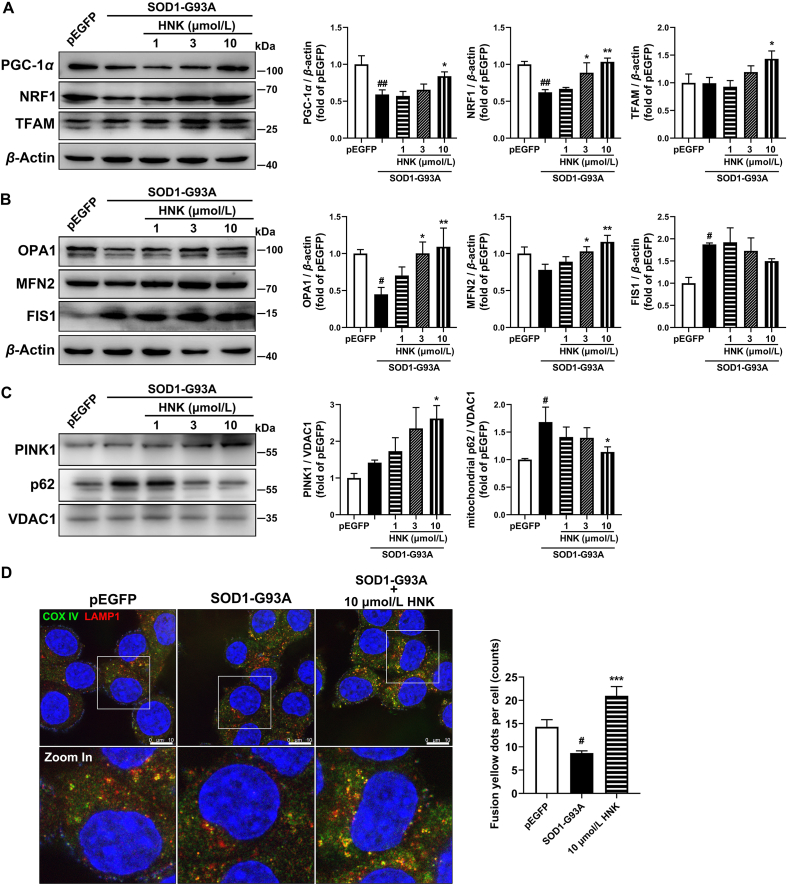
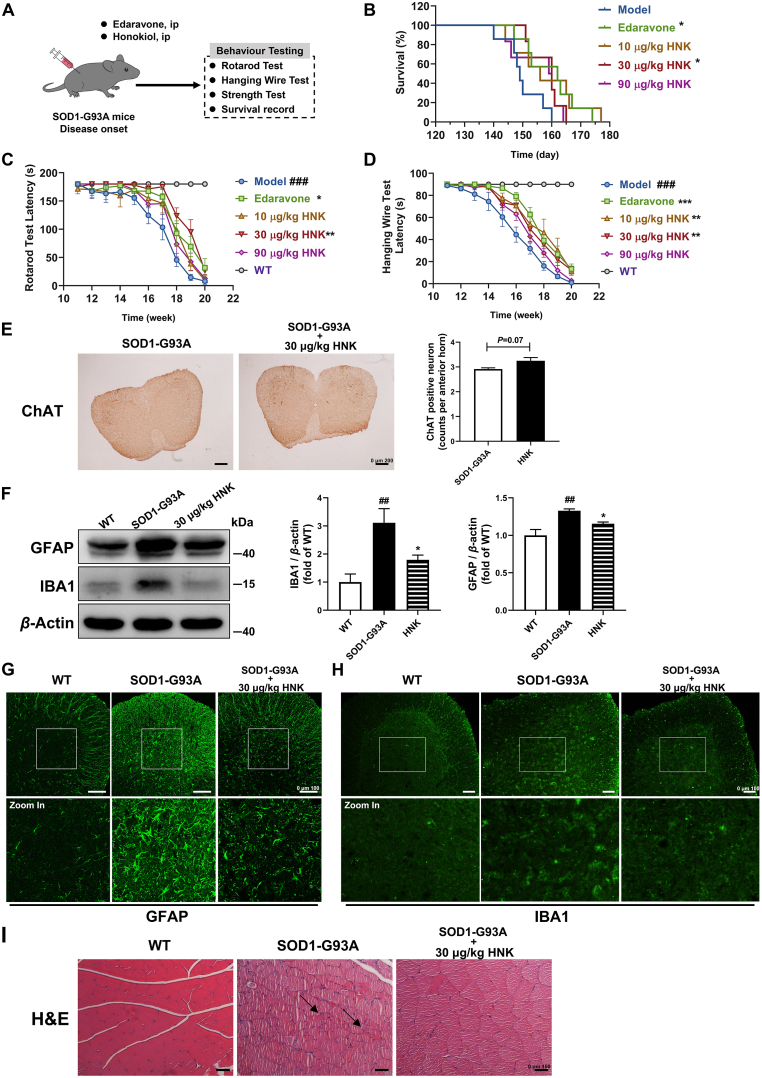
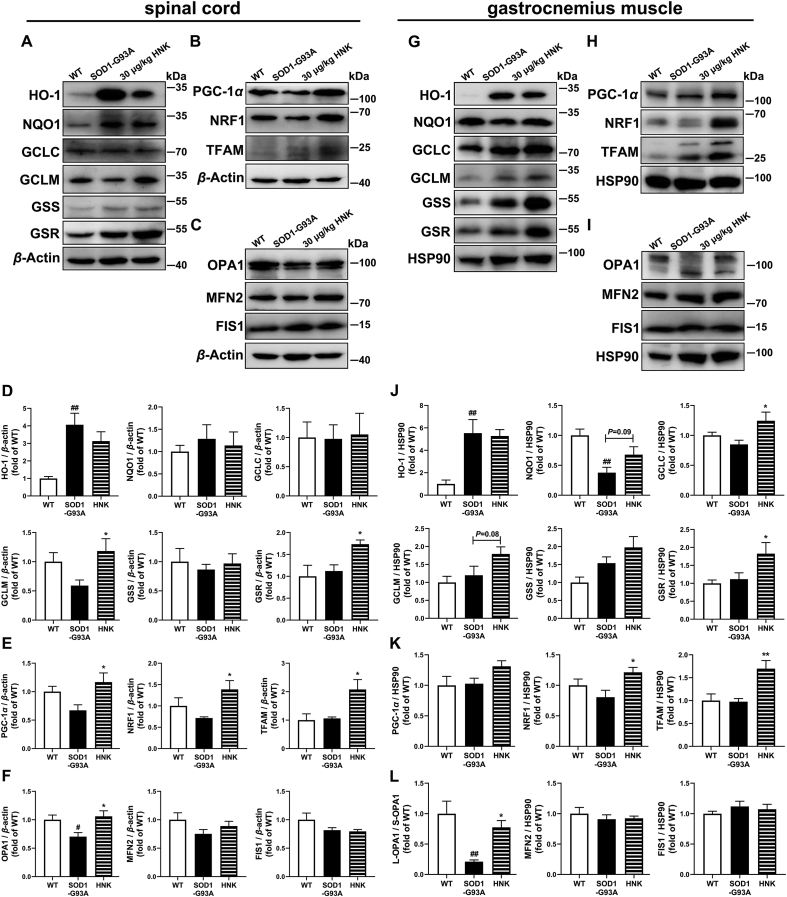
Amyotrophic lateral sclerosis (ALS) is a progressive neurodegenerative disease affecting both upper and lower motor neurons (MNs) with large unmet medical needs. Multiple pathological mechanisms are considered to contribute to the progression of ALS, including neuronal oxidative stress and mitochondrial dysfunction. Honokiol (HNK) has been reported to exert therapeutic effects in several neurologic disease models including ischemia stroke, Alzheimer's disease and Parkinson's disease. Here we found that honokiol also exhibited protective effects in ALS disease models both in vitro and in vivo. Honokiol improved the viability of NSC-34 motor neuron-like cells that expressed the mutant G93A SOD1 proteins (SOD1-G93A cells for short). Mechanistical studies revealed that honokiol alleviated cellular oxidative stress by enhancing glutathione (GSH) synthesis and activating the nuclear factor erythroid 2-related factor 2 (NRF2)-antioxidant response element (ARE) pathway. Also, honokiol improved both mitochondrial function and morphology via fine-tuning mitochondrial dynamics in SOD1-G93A cells. Importantly, honokiol extended the lifespan of the SOD1-G93A transgenic mice and improved the motor function. The improvement of antioxidant capacity and mitochondrial function was further confirmed in the spinal cord and gastrocnemius muscle in mice. Overall, honokiol showed promising preclinical potential as a multiple target drug for ALS treatment.

Keywords: Amyotrophic lateral sclerosis; Glutathione; Honokiol; Mitochondrial biogenesis; Mitochondrial dynamics; NRF2; Oxidative stress; SOD1-G93A.


Figures

Image 1
Graphical abstract
Figure 1
Figure 1
Honokiol showed strong radicals scavenging capacity and antioxidant capacity in vitro. (A) Chemical structure of honokiol; (B) oxygen radical absorbance capacity (n = 3); (C) scavenging capacity of DPPH radicals (n = 3); (D) scavenging capacity of hydroxyl radicals (n = 3); (E) scavenging capacity of superoxide radicals of Vc, edaravone, and honokiol (n = 4); (F) Temporal protein expression profiles of biomarkers indicative of different oxidative stress-related pathways upon exposure to H2O2 in the yeast (n = 3). Data are presented as the mean ± SEM.
Figure 2
Figure 2
Honokiol promoted the cell viability and reduced apoptosis in SOD1-G93A cells. (A) Cell viability analyzed by MTT assays (n = 3); (B) Apoptosis assay analyzed by flow cytometry, and early apoptosis (C) and late apoptosis (D) were analyzed by FlowJo (n = 4); (E) Western blot analysis and quantification of BCL2 and BAX in total cell lysates (n = 4); (F) Western blot analysis and quantification of cytochrome c in mitochondrial and cytoplasm cell lysates (n = 5). Cells were incubated with honokiol for 24 h in the experiments. One-way ANOVA followed by post-hoc LSD test was used for the comparisons among three or more groups (SPSS 16.0). Data are presented as the mean ± SEM. #P < 0.05, ##P < 0.01, ###P < 0.001 versus pEGFP control group; ∗P < 0.05, ∗∗P < 0.01, ∗∗∗P < 0.001 versus SOD1-G93A model group.
Figure 3
Figure 3
Honokiol regulated the antioxidant capacity and the mitochondrial function in SOD1-G93A cells. (A) Heatmap of the differential expressed genes; (B) Cluster analysis of the differential expressed genes; (C) KEGG enrichment analysis of the differential expressed genes; (D) GSEA of the differential expressed genes between SOD1-G93A model group and honokiol-treated group (n = 3).
Figure 4
Figure 4
Honokiol alleviated the oxidative stress damage in SOD1-G93A cells. Effect of honokiol on (A) DHE intensity analyzed by flow cytometry (n = 3); (B) MDA content (n = 3); (C) 4-HNE protein level (n = 4); (D) PCO level (n = 3); (E) 8-OHdG level (n = 4); (F) and (G) DNA damage analyzed by comet assay (n = 3). Scale bars, 100 μm; (H) T-AOC capacity (n = 3); (I) NADPH content (n = 4); (J) GSH content (n = 5); (K) CAT activity (n = 3); (L) GSR activity (n = 4). Cells were incubated with honokiol for 24 h in the experiments. One-way ANOVA followed by post hoc LSD test was used for the comparison among three or more groups (SPSS 16.0). Data are presented as the mean ± SEM. ##P < 0.01, ###P < 0.001 versus pEGFP control group; ∗P < 0.05, ∗∗P < 0.01, ∗∗∗P < 0.001 versus SOD1-G93A model group.
Figure 5
Figure 5
Honokiol activated the NRF2 anti-oxidant pathway in the SOD1-G93A cells. (A) Luminescence intensity of HEK293-ARE reporter cells after treatment with indicated concentrations of honokiol for 6, 12 and 24 h (n = 3); (B) Representative images of NRF2 nuclear translocalization after 24 h honokiol treatment. Scale bars, 8 μm; (C) Western blot analysis and quantification of NRF2 in nuclear and cytoplasmic cell lysates after 24 h honokiol treatment (n = 4); (D) RT-qPCR analysis of transcription levels of Hmox1, Nqo1, Gclm, Gclc, Gss and Gsr after 12 h honokiol treatment (n = 3–7); (E) Western blot analysis and quantification of HO-1, NQO1, GCLC, GCLM, GSS and GSR in total cell lysates after 24 h honokiol treatment (n = 3–6). One-way ANOVA followed by post hoc LSD test was used for the comparison among three or more groups (SPSS 16.0). Data are presented as the mean ± SEM. #P < 0.05, ###P < 0.001 versus pEGFP control group; ∗P < 0.05, ∗∗P < 0.01, ∗∗∗P < 0.001 versus SOD1-G93A model group.
Figure 6
Figure 6
Honokiol preserved the mitochondrial function and mitochondrial morphology in the SOD1-G93A cells. (A) The MMP assessment analyzed by flow cytometry with the fluorescent probe TMRE (n = 3–4); (B) ATP content analysis (n = 3); (C) Mitochondrial complex II activity determination (n = 5); (D) Mitochondrial complex IV activity determination (n = 6); (E) Representative confocal microscopy images of mitochondrial morphology stained by mitotracker. Scale bars, 8 μm; (F–J) Mitochondrial morphology assessment including individuals, networks, mean network size, mean branch length, and footprint analyzed by MiNA. Cells were incubated with honokiol for 24 h in the experiments (n = 3). One-way ANOVA followed by post hoc LSD test was used for the comparisons among three or more groups (SPSS 16.0). Data are presented as the mean ± SEM. ###P < 0.001 versus pEGFP control group; ∗P < 0.05, ∗∗∗P < 0.001 versus SOD1-G93A model group.
Figure 7
Figure 7
Honokiol improved the mitochondrial biogenesis, mitochondrial fusion–fission balance and mitophagy. (A) Western blot analysis and quantification of PGC-1α, NRF1, and TFAM in total cell lysates (n = 4–6); (B) Western blot analysis and quantification of OPA1, MFN2, and FIS1 in total cell lysates (n = 3–5); (C) Western blot analysis and quantification of PINK1 and p62 in mitochondrial lysates (n = 3–4); (D) Representative confocal microscopy images of COX IV and LAMP1 co-immunofluorescence staining and the quantification of yellow fusion dots (n = 3). Scale bars, 10 μm. Cells were incubated with honokiol for 24 h in the experiments. One-way ANOVA followed by post hoc LSD test was used for the comparisons among three or more groups (SPSS 16.0). Data are presented as the mean ± SEM. #P < 0.05, ##P < 0.01 versus pEGFP control group; ∗P < 0.05, ∗∗P < 0.01, ∗∗∗P < 0.001 versus SOD1-G93A model group.
Figure 8
Figure 8
Honokiol improved the motor function, extended the lifespan, and alleviated the pathology of the SOD1-G93A transgenic mice. (A) The experimental process of in vivo studies; (B) The survival determination (n = 6–8); (C) The rotarod latency determination (n = 6–8); (D) The hanging wire test latency determination (n = 6–8); (E) Immunohistochemistry of ChAT positive MNs of the spinal cord (n = 3). Scale bars, 200 μm; (F) Western blot analysis and quantification of GFAP and IBA1 in the spinal cord tissue lysates (n = 4); (G) and (H) Representative images of GFAP and IBA1 immunofluorescence staining of the spinal cord. Scale bars, 100 μm; (I) Representative images of H&E staining of the gastrocnemius muscle. Scale bars, 100 μm. Kaplan–Meier analysis with log rank statistic test was used for the comparisons of the survival curves among the indicated groups (SPSS 16.0). Repeated measures ANOVA followed by post hoc LSD test was used for the comparisons of rotarod latency and hanging wire test latency determination among the indicated groups (SPSS 16.0). Student's t-test was used for the comparison of the ChAT positive MNs between SOD1-G93A mice and honokiol-treated mice (SPSS 16.0). One-way ANOVA followed by post hoc LSD test was used for the comparisons among the indicated groups in the Western blot quantification (SPSS 16.0). Data are presented as the mean ± SEM. ##P < 0.01, ###P < 0.001 versus WT control group; ∗P < 0.05, ∗∗P < 0.01, ∗∗∗P < 0.001 versus SOD1-G93A model group.
Figure 9
Figure 9
Honokiol activated the NRF2–GSH pathway and improved mitochondrial function in the spinal cord and gastrocnemius muscle of SOD1-G93A mice. (A) and (D) Western blot analysis and quantification of HO-1, NQO1, GCLC, GCLM, GSS and GSR in the spinal cord (n = 3–4); (B) and (E) Western blot analysis and quantification of PGC-1α, NRF1 and TFAM in the spinal cord (n = 4); (C) and (F) Western blot analysis and quantification of OPA1, MFN2 and FIS1 in the spinal cord (n = 4); (G) and (J) Western blot analysis and quantification analysis of HO-1, NQO1, GCLC, GCLM, GSS and GSR in the gastrocnemius muscle (n = 4); (H) and (K) Western blot analysis and quantification of PGC-1α, NRF1 and TFAM in the gastrocnemius muscle (n = 4–6); (I) and (L) Western blot analysis and quantification of OPA1, MFN2 and FIS1 in the gastrocnemius muscle (n = 4). One-way ANOVA followed by post hoc LSD test was used for the comparisons among three or more groups (SPSS 16.0). Data are presented as the mean ± SEM (n = 3–6, repeated independent experiments). #P < 0.05, ##P < 0.01 versus WT control group; ∗P < 0.05, ∗∗P < 0.01 versus SOD1-G93A model group.

Similar articles

Cited by

References

    1. Longinetti E., Fang F. Epidemiology of amyotrophic lateral sclerosis: an update of recent literature. Curr Opin Neurol. 2019;32:771–776. - PMC - PubMed
    1. Pasinelli P., Brown R.H. Molecular biology of amyotrophic lateral sclerosis: insights from genetics. Nat Rev Neurosci. 2006;7:710–723. - PubMed
    1. Renton A.E., Chio A., Traynor B.J. State of play in amyotrophic lateral sclerosis genetics. Nat Neurosci. 2014;17:17–23. - PMC - PubMed
    1. Chen L.X., Xu H.F., Wang P.S., Yang X.X., Wu Z.Y., Li H.F. SOD1 mutation spectrum and natural history of ALS patients in a 15-year cohort in southeastern China. Front Genet. 2021;12 - PMC - PubMed
    1. Liu X., He J., Gao F.B., Gitler A.D., Fan D. The epidemiology and genetics of amyotrophic lateral sclerosis in China. Brain Res. 2018;1693:121–126. - PMC - PubMed

LinkOut - more resources