. 2023 Feb;13(2):662-677.
doi: 10.1016/j.apsb.2022.07.021. Epub 2022 Aug 3.

Impeding the combination of astrocytic ASCT2 and NLRP3 by talniflumate alleviates neuroinflammation in experimental models of Parkinson's disease

Affiliations

Impeding the combination of astrocytic ASCT2 and NLRP3 by talniflumate alleviates neuroinflammation in experimental models of Parkinson's disease

Yang Liu et al. Acta Pharm Sin B. 2023 Feb.

Abstract

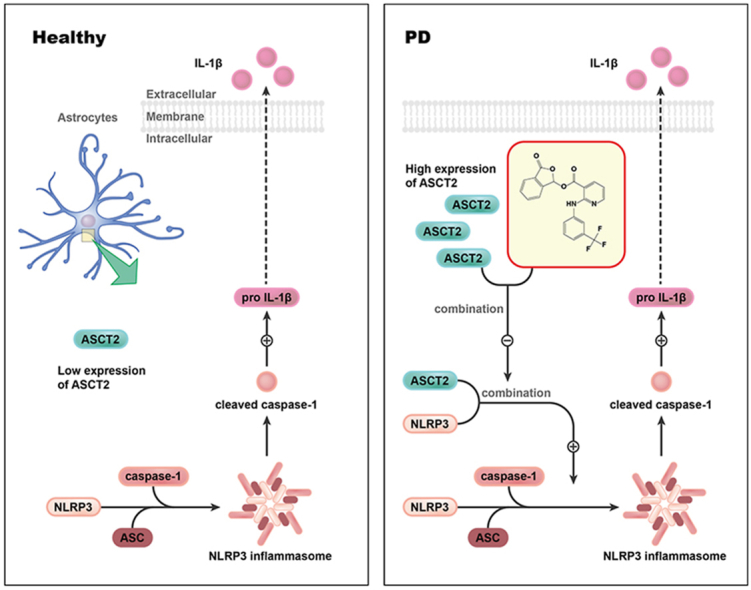
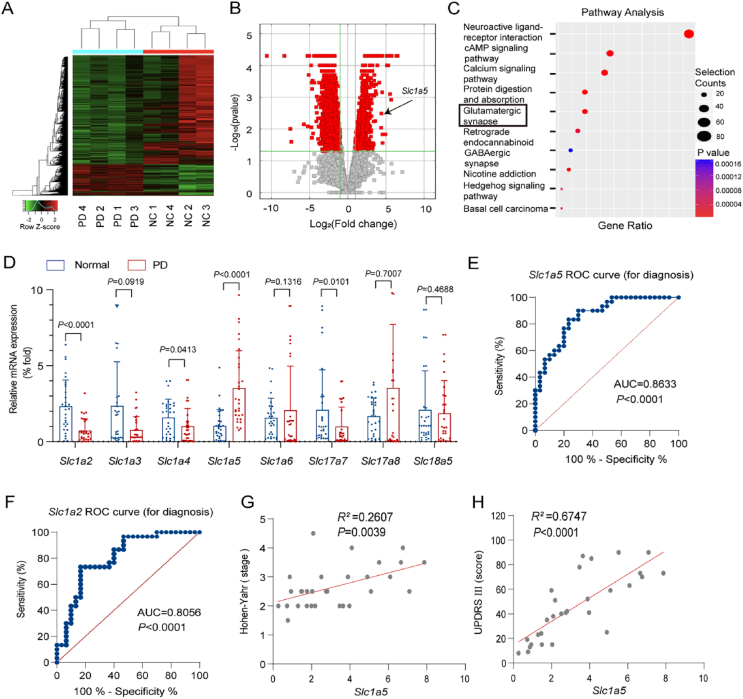
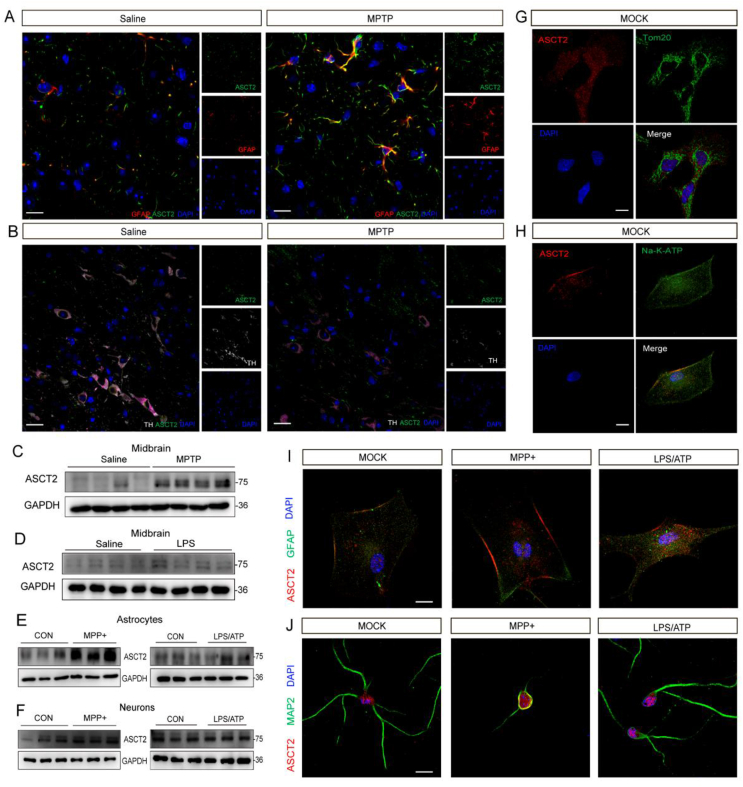
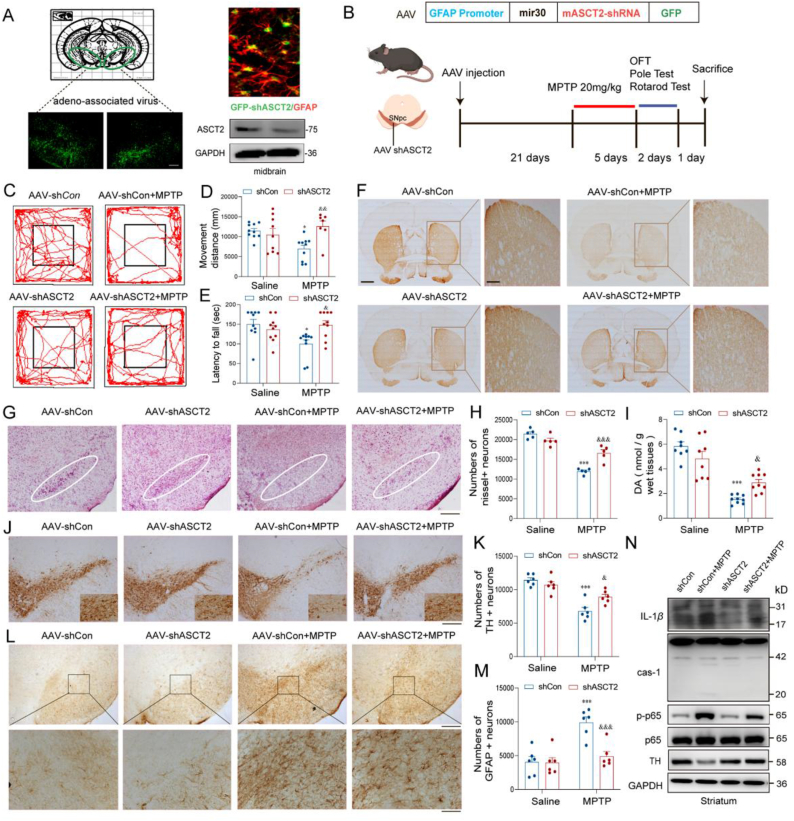
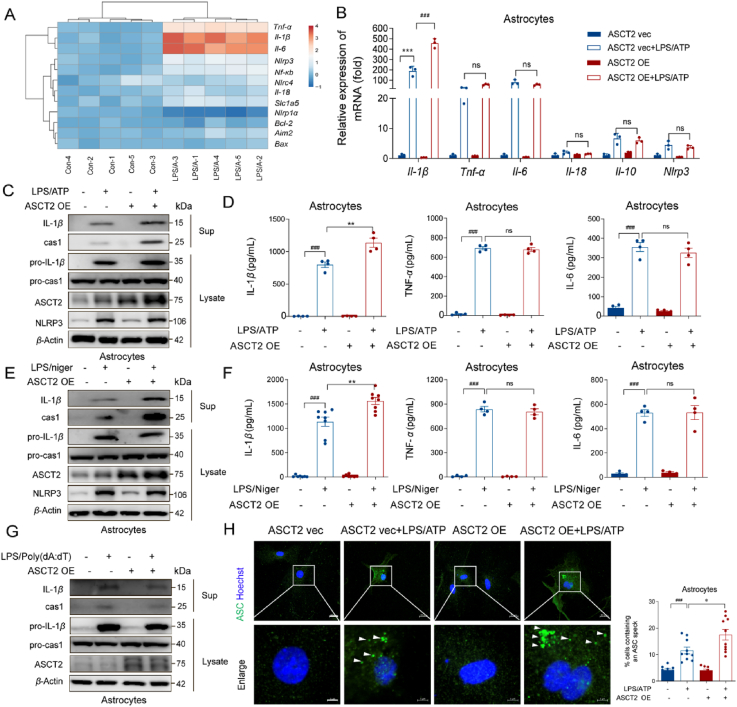
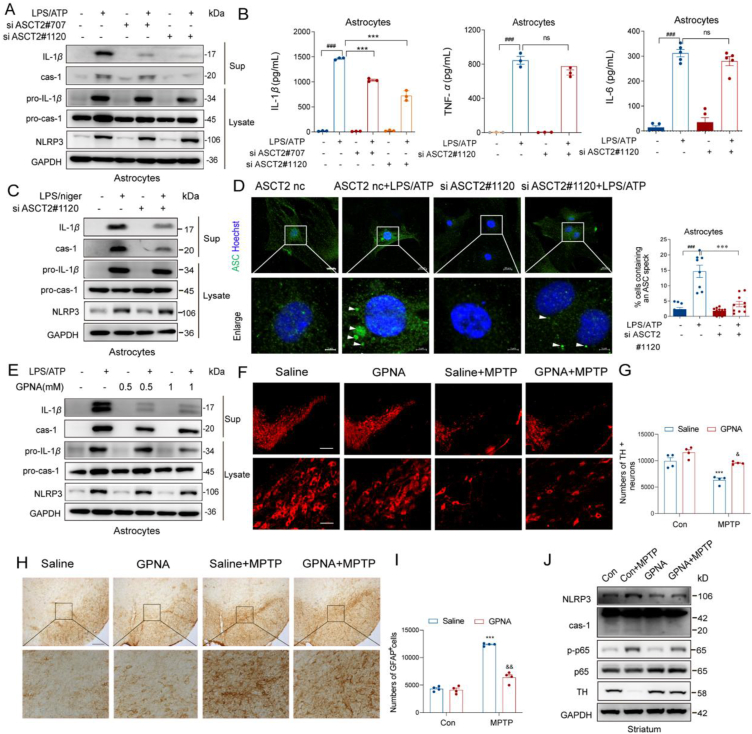
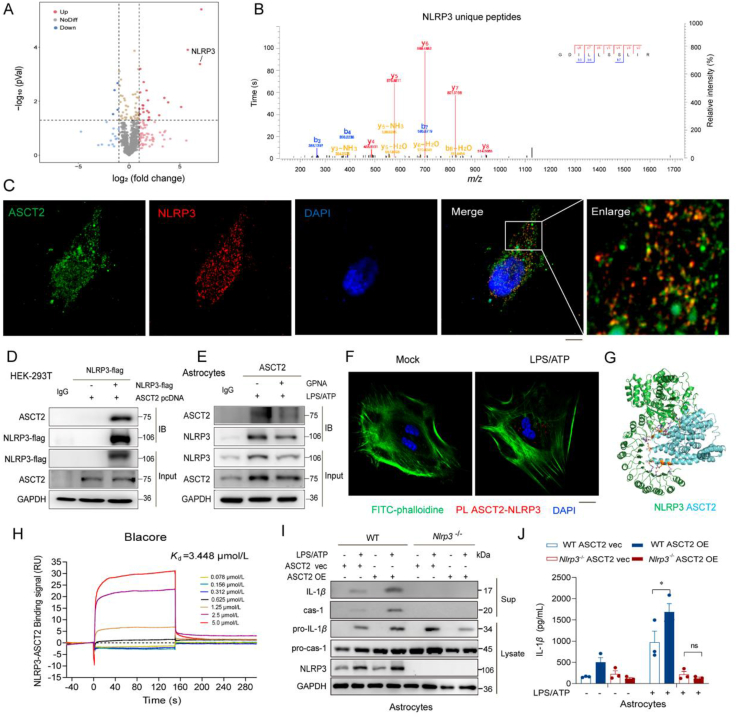
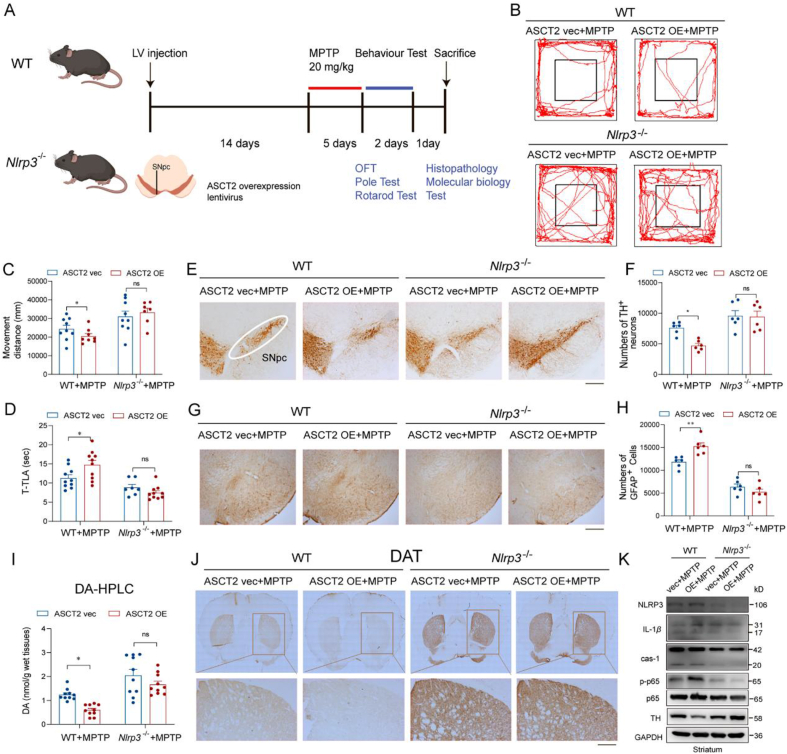
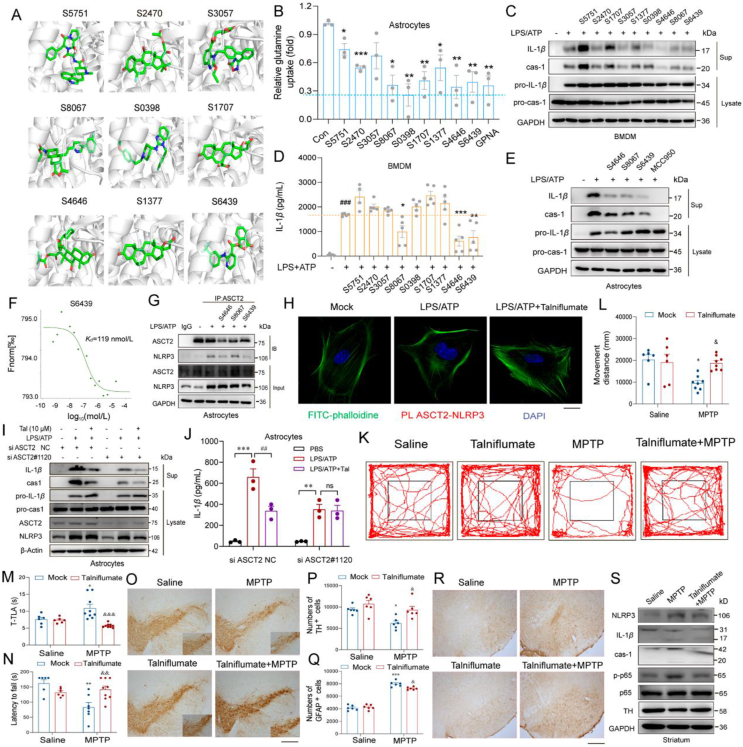
Alanine-serine-cysteine transporter 2 (ASCT2) is reported to participate in the progression of tumors and metabolic diseases. It is also considered to play a crucial role in the glutamate-glutamine shuttle of neuroglial network. However, it remains unclear the involvement of ASCT2 in neurological diseases such as Parkinson's disease (PD). In this study, we demonstrated that high expression of ASCT2 in the plasma samples of PD patients and the midbrain of MPTP mouse models is positively correlated with dyskinesia. We further illustrated that ASCT2 expressed in astrocytes rather than neurons significantly upregulated in response to either MPP+ or LPS/ATP challenge. Genetic ablation of astrocytic ASCT2 alleviated the neuroinflammation and rescued dopaminergic (DA) neuron damage in PD models in vitro and in vivo. Notably, the binding of ASCT2 to NLRP3 aggravates astrocytic inflammasome-triggered neuroinflammation. Then a panel of 2513 FDA-approved drugs were performed via virtual molecular screening based on the target ASCT2 and we succeed in getting the drug talniflumate. It is validated talniflumate impedes astrocytic inflammation and prevents degeneration of DA neurons in PD models. Collectively, these findings reveal the role of astrocytic ASCT2 in the pathogenesis of PD, broaden the therapeutic strategy and provide a promising candidate drug for PD treatment.

Keywords: ASCT2; Astrocytes; Drug screening; Inflammation; NLRP3; Neurodegeneration; Parkinson's disease; Talniflumate.


Figures

Image 1
Graphical abstract
Figure 1
Figure 1
ASCT2 is upregulated in the plasma samples of PD patients compared with normal controls. (A) Heatmap and (B) Volcano map of relative expression (compared with the healthy people group) for each gene was generated. n = 4 samples/group. (C) Pathway enrichment analysis (KEGG) for genes expressed preferentially is shown. (D) Slc1a5 (gene-encoded ASCT2) was upregulated in the plasma samples of PD patients (n = 30 individuals/group) compared with those in normal controls (n = 30 individuals/group). Data represent the means ± SEM statistically significant by Student's t-test. ROC curve for diagnosis of Slc1a5 (E) and Slc1a2 (F). (G, H) Correlation analysis (Hoehn-Yahr and UPDRS) for individual ASCT2 to separate PD patients from normal controls.
Figure 2
Figure 2
MPTP and LPS mediate the up-regulation of ASCT2 in primary astrocytes and mouse midbrain. (A) Representative images of immunofluorescence three-labeling GFAP/ASCT2 in saline and MPTP mice model. Red: GFAP; Green: ASCT2; Blue: DAPI. Scale bar: 100 μm. (B) Representative images of immunofluorescence three-labeling TH/ASCT2 in saline and MPTP mice model. Red: TH. Green: ASCT2. Blue: DAPI. Scale bar: 100 μm. Expression of ASCT2 in the midbrain of MPTP (C)/LPS-treated (D) PD mouse model was detected. Immunoblot analysis of ASCT2 in astrocytes after being treated with MPP+/LPS-treated was detected (E). Immunoblot analysis of ASCT2 in neurons after being treated with MPP+/LPS plus ATP was detected (F). (G, H) Representative images of immunofluorescence double-labeling ASCT2/Tom20 and ASCT2/Na-K-ATP. (I) Co-localization of ASCT2/Na-K-ATP in the astrocytes after treatment with LPS/ATP or MPP+-treated. Red, ASCT2; Green, Na-K-ATP; Blue, DAPI. (J) Co-localization of ASCT2/MAP2 in the astrocytes after treatment with LPS/ATP or MPP+-treated. Red, ASCT2; Green, MAP2; Blue, DAPI. Scale bar, 20 μm.
Figure 3
Figure 3
Knockdown of astrocytic ASCT2 provides anti-inflammatory and neuroprotective effects in MPTP-induced PD mouse model. (A) A schematic diagram of the model injected AAV-GFAP-shASCT2 into the midbrain of mice. Immunoblot and co-localization of ASCT2 and GFAP after the AAV-GFAP-shASCT2 microinjection into the midbrain. Green, GFAP-shASCT2; Red, GFAP; Blue, DAPI. Scale bar, 50 μm. (B) Schematic diagram of MPTP-induced subacute PD mouse model. (C) Representative motor performance in the open field test. Mice were in an open field within 5 min and recorded simultaneously movement distance by the Top View Animal Behavior Analyzing System produced in the USA. (D) Movement distance in the open field test. (E) Time taken for mice residence in the bar (latency to fall). (F) Immunohistochemical staining of TH+ neuron in the striatum after sub-acute MPTP treatment (20 mg/kg i.h., q.d., 5 days). Scale bar, 200 μm. (G) Nissl staining of neuron in the SNpc after sub-acute MPTP treatment (20 mg/kg i.h., q.d., 5 days). (H) Counting nissl positive neuron cells in the SNpc. (I) The level of dopamine in mouse striatum homogenate was detected by HPLC analysis (n = 8). (J) Immunohistochemical staining of TH+ neuron in the SNpc after sub-acute MPTP treatment (20 mg/kg i.h., q.d., 5 days). (K) Counting TH+ neuron cells in the SNpc. (L) Immunohistochemical staining of GFAP positive astrocytes in the SNpc. (M) Counting GFAP positive astrocytes in the SNpc. Scale bar represents 200 μm (upper). Enlarge vision. Scale bar represents 80 μm (lower). (N) Immunoblot analysis of IL-1β, caspase-1, p65, p-p65 and TH. n = 6 mice per group. Scale bar, 200 μm. Data are presented as the mean ± SEM. ∗P < 0.05; ∗∗∗P < 0.001 vs. sh control, &P < 0.05; &&P < 0.01; &&&P < 0.001 vs. sh control + MPTP. Two-way ANOVA with Dunnett's multiple comparisons test.
Figure 4
Figure 4
Overexpression of ASCT2 aggravates NLRP3 inflammasome activation. (A) A series of cytokines were detected by QT-PCR while astrocytes were stimulated with LPS/ATP. (B) LPS (100 ng/mL) primed-primary astrocytes were transfected with ASCT2 overexpression plasmids and then stimulated with ATP (5 mM). Il-1β, Tnf-α, Il-6, Il-18, Il-10 and Nlrp3 were detected by QT-PCR. Data are presented as the mean ± SEM; statistically significant by Student t-test; ∗∗∗P < 0.001 vs. ASCT2 vec; ns, P > 0.05; ###P < 0.001 vs. ASCT2 vec + LPS/ATP; (C) IL-1β and caspase-1 from medium supernatants (SN) and pro-IL-1β and pro-caspase-1 from cell extracts (Lysates) were analyzed by immunoblotting while astrocytes were stimulated with LPS/ATP. (D) Secretions of IL-1β, IL-6, and TNF-α in supplement of astrocytes stimulated with LPS/ATP were detected by ELISA. (E) LPS (100 ng/mL) primed-primary astrocytes were transfected with ASCT2 overexpression plasmids and then stimulated with nigericin (5 μmol/L). IL-1β and caspase-1 from medium supernatants (SN) and pro-IL-1β and pro-caspase-1 from cell extracts (Lysates) were analyzed by immunoblotting while astrocytes were stimulated with LPS/nigericin. (F) Secretions of IL-1β, IL-6 and TNF-α in supplement of astrocytes stimulated with LPS/nigericin were detected by Elisa. (G) LPS (100 ng/mL) primed-primary astrocytes were transfected with ASCT2 overexpression plasmids and then stimulated with poly (dA:dT) (1.5 μg/mL). IL-1β and caspase-1 from medium supernatants (SN) and pro-IL-1β and pro-caspase-1 from cell extracts (Lysates) were analyzed by immunoblotting while astrocytes were stimulated with poly (dA:dT). (H) Cells were analyzed by immunostaining after being stimulated with LPS/ATP. The white arrow represents ASC specks. Data shown represent results from three independent experiments in which more than 300 cells were counted in each experiment. Scale bar: 20 μm (upper). Enlarge vision. Scale bar: 5 μm (lower). Data are presented as the mean ± SEM. ###P < 0.001 vs. ASCT2 vec; ns, P > 0.05; ∗P < 0.05; ∗∗P < 0.01 vs. ASCT2 vec + LPS/ATP. Two-way ANOVA with Dunnett's multiple comparisons test.
Figure 5
Figure 5
Pharmacological and genetic inhibition of ASCT2 prevents NLRP3 inflammasome activation. (A) LPS (100 ng/mL) primed-primary astrocytes were transfected with ASCT2 siRNA (siASCT2#707 and siASCT2#1120) and then stimulated with ATP (5 mmol/L). IL-1β and caspase-1 from medium supernatants (SN) and pro-IL-1β and pro-caspase-1 from cell extracts (Lysates) were analyzed by immunoblotting while astrocytes were stimulated with LPS/ATP or LPS/nigericin (C). Secretions of IL-1β, IL-6 and TNF-α in supplement of astrocytes stimulated with LPS/ATP were detected by ELISA (B). (D) Primary astrocytes were transfected with ASCT2 siRNA (siASCT2#1120) and then stimulated with LPS/ATP. Cells were analyzed by Immunostaining. The white arrow represents ASC specks. Scale bar: 20 μm (upper). Enlarge vision. Scale bar: 5 μm (lower). Data are presented as the mean ± SEM; statistically significant by Student's t-test; ###P < 0.001 vs. siASCT2 nc; ns, P > 0.05; ∗∗∗P < 0.001 vs. siASCT2 nc + LPS/ATP. (E) LPS (100 ng/mL)-primed primary astrocytes were treated with GPNA (0.5 and 1 mmol/L) and then stimulated with ATP (5 mmol/L). IL-1β and caspase-1 from medium supernatants (SN) and pro-IL-1β and pro-caspase-1 from cell extracts (Lysates) were analyzed by immunoblotting. (F) WT mice were made MPTP (20 mg/kg i.h., q.d., 5 days)-induced PD model with GPNA (75 mg/kg i.g., q.d., 11 days) administration or not. Immunofluorescence staining of TH+ neuron in the SNpc after sub-acute MPTP treatment. Scale bar represents 200 μm. (G) Counting TH+ neuron cells in the SNpc (n = 4). (H) Immunohistochemical staining of GFAP+ astrocytes in the SNpc. Scale bar represents 200 μm (upper). Enlarge vision: Scale bar represents 80 μm (lower). (I) Counting GFAP+ astrocytes in the SNpc (n = 4). (J) NLRP3, p65, p-p65, caspase-1 and TH from mouse mesencephalon homogenate were analyzed by immunoblotting. Data are presented as the mean ± SEM. ∗P < 0.05; ∗∗∗P < 0.001 vs. saline group, &P < 0.05; &&P < 0.01 vs. MPTP group. Two-way ANOVA with Dunnett's multiple comparisons test.
Figure 6
Figure 6
Glutamine transporter activates astrocytic NLRP3 inflammasome activation via enhancing the interaction of ASCT2 and NLRP3. (A) Volcano plot of 4D label-free mass spectrometry-quantified proteins that bound ASCT2 with a significant fold change after LPS/ATP activation. (B) Representative fragmentation spectrum of GDILLSSLIR in NLRP3. (C) Immunofluorescent histochemical staining for ASCT2 and NLRP3 in HEK-293T cells. Red, NLRP3; Green, ASCT2; Blue, DAPI. Scale bar, 20 μm. (D) Flag-tagged NLRP3 construct and ASCT2 pcDNA3.1 construct was co-transfected in HEK-293T cells. Cell lysates were immunoprecipitated with anti-Flag antibody and then the samples were analyzed by immunoblotting. (E) Cell lysates of primary astrocytes treated with LPS/ATP and GPNA or not were immunoprecipitated with anti-ASCT2 antibody, and then the samples were analyzed by immunoblotting. (F) ASCT2 and NLRP3 proximity ligation signals. Primary astrocytes were stimulated with LPS/ATP for 6 h. Red, ASCT2-NLRP3; Green, phalloidin; Blue, DAPI. Scale bar, 20 μm. (G) ASCT2 (PDB: 5llm) was docked with NLRP3 (PDB: 5NPY), the lowest binding position (−7.6 kcal/mol) was selected, and all amino acids within 1 Å of ASCT2 were displayed by PyMOL software. (H) SPR was used to detect the equilibrium dissociation constant (Kd) between ASCT2 and NLRP3. (I) LPS (100 ng/mL) primed-primary astrocytes isolated from WT and Nlrp3−/− mice that were transfected with ASCT2 overexpression plasmids and then stimulated with ATP (5 mmol/L). Scale bar, 100 μm. IL-1β and caspase-1 from SN and pro-IL-1β and pro-caspase-1 from cell extracts (Lysates) were analyzed by immunoblotting. (J) Secretion of IL-1β in supplement of astrocytes stimulated with LPS/ATP was detected by ELISA. Data are presented as the mean ± SEM; statistically significant by Student's t-test; ∗P < 0.05 vs. WT ASCT2 vec + LPS/ATP group; ns, P > 0.05 vs. Nlrp3−/− ASCT2 vec + LPS/ATP group.
Figure 7
Figure 7
Knockout of NLRP3 abolishes ASCT2-induced activation of neuroinflammation. (A) A schematic diagram of the model injected ASCT2 overexpression LV to the midbrain of mice. Immunoblot and co-localization of ASCT2 and GFAP after LV-GFP-ASCT2 microinjection into the midbrain. (B) Representative motor performance in the open field test. Mice were in an open field within 5 min, and recorded simultaneously movement distance by the Top View Animal Behavior Analyzing System produced in the USA. (C) Movement distance in the open field test. (D) Time is taken for mice residence in the bar (T-TLA). (E) Immunohistochemical staining of TH+ neuron in the SNpc after sub-acute MPTP treatment (20 mg/kg i.h., q.d., 5 days). (F) Counting TH+ neuron cells in the SNpc. (G) Immunohistochemical staining of GFAP+ astrocytes in the SNpc. (H) Counting GFAP+ astrocytes in the SNpc. (I) The level of dopamine in mouse striatum homogenate was detected by HPLC analysis. (J) Immunohistochemical staining of TH+ neuron in the striatum after sub-acute MPTP treatment (20 mg/kg i.h., q.d., 5 days). (K) Immunoblot analysis of NLRP3, IL-1β, caspase-1, p-p65, p65 and TH. n = 10–12 mice per group. Scale bar, 200 μm. Data are presented as the mean ± SEM. ∗P < 0.05; ∗∗P < 0.05 vs. WT ASCT2 vec + MPTP group; ns, P > 0.05 vs. Nlrp3−/− ASCT2 vec + MPTP group. Two-way ANOVA with Dunnett's multiple comparisons test.
Figure 8
Figure 8
Talniflumate reduces dopaminergic neuron loss and inhibits neuroinflammation via ASCT2 in the PD mouse model. (A) ASCT2 was docked with 2513 drugs in FDA approved drug database. Nine drugs were selected for further study. (B) Relative glutamine uptake was detected after being pretreated with these drugs for 12 h at a concentration of 10 μmol/L. (C) LPS (100 ng/mL) primed-primary astrocytes were treated with these 9 drugs and then stimulated with ATP (5 mmol/L). IL-1β and caspase-1 from SN and pro-IL-1β and pro-caspase-1 from cell extracts (Lysates) were analyzed by immunoblotting while astrocytes were stimulated with LPS/ATP. (D) Secretion of IL-1β in supplement of astrocytes stimulated with LPS/ATP and these 9 drugs were detected by ELISA. (E) S4646, S8067 and S6439 were selected to validate the anti-inflammatory effect in astrocytes. (F) Purified recombinant ASCT2 was mixed with S6439 and detected by MST. (G) Cell lysates of primary astrocytes treated with LPS/ATP and S4646/S8067/S6439 or not were immunoprecipitated with anti-ASCT2 antibody, and then the samples were analyzed by immunoblotting. (H) Primary astrocytes were pretreated with LPS (100 ng/mL) and 10 μmol/L S6439 (talniflumate) for 2 h and then stimulated with ATP (5 mmol/L). ASCT2 and NLRP3 proximity ligation signals. Scale bar, 20 μm. LPS (100 ng/mL) primed-primary astrocytes were transfected with ASCT2 siRNA#1120 or negative control for 48 h, pretreatment with talniflumate (10 μmol/L), and then stimulated with ATP (5 mmol/L). IL-1β and caspase-1 from SN and pro-IL-1β and pro-caspase-1 from cell extracts (Lysates) were analyzed by immunoblotting (I). Secretion of IL-1β in supplement of astrocytes stimulated with LPS/ATP was detected by ELISA (J). Data are presented as the mean ± SEM; statistically significant by Student's t-test; ∗∗P < 0.01 vs. PBS group; ns, P > 0.05; ##P < 0.01 vs. LPS/ATP group. (K) WT mice were made MPTP (20 mg/kg i.h., q.d., 5 days)-induced PD model with Talniflumate (50 mg/kg i.g., q.d., 11 days) administration or not. Immunohistochemical staining of TH+ neuron in the SNpc after sub-acute MPTP treatment. (L) Mice were in an open field within 5 min and recorded movement distance (n = 6). (M, N) Movement distance in open field test, latency to fall, time is taken for mice residence in the bar (T-TLA) were detected. (O, P) Immunohistochemical staining of TH+ neuron in the SNpc after sub-acute MPTP treatment and counting TH+ neuron in the SNpc. (Q, R) Immunohistochemical staining of GFAP positive astrocytes in the SNpc and counting GFAP positive astrocytes in the SNpc. Scale bar, 200 μm. (S) Immunoblot analysis of NLRP3, IL-1β, caspase-1, p-p65, p65, and TH. n = 6 mice per group. ∗P < 0.05; ∗∗P < 0.01; ∗∗∗P < 0.001 vs. saline group, &P < 0.05; &&P < 0.01; &&&P < 0.001 vs. MPTP group. Two-way ANOVA with Dunnett's multiple comparisons test.

Similar articles

Cited by

References

    1. Przedborski S. The two-century journey of Parkinson disease research. Nat Rev Neurosci. 2017;18:251–259. - PubMed
    1. Walsh J.G., Muruve D.A., Power C. Inflammasomes in the CNS. Nat Rev Neurosci. 2014;15:84–97. - PubMed
    1. Schwartz M., Baruch K. The resolution of neuroinflammation in neurodegeneration: leukocyte recruitment via the choroid plexus. EMBO J. 2014;33:7–22. - PMC - PubMed
    1. Heneka M.T., McManus R.M., Latz E. Inflammasome signalling in brain function and neurodegenerative disease. Nat Rev Neurosci. 2018;19:610–621. - PubMed
    1. Kaushik D.K., Gupta M., Kumawat K.L., Basu A. NLRP3 inflammasome: key mediator of neuroinflammation in murine Japanese encephalitis. PLoS One. 2012;7 - PMC - PubMed

LinkOut - more resources