Review
. 2023 Feb 15:10:1086097.
doi: 10.3389/fmed.2023.1086097. eCollection 2023.

Deep learning methods for drug response prediction in cancer: Predominant and emerging trends

Affiliations
Review

Deep learning methods for drug response prediction in cancer: Predominant and emerging trends

Alexander Partin et al. Front Med (Lausanne). .

Abstract

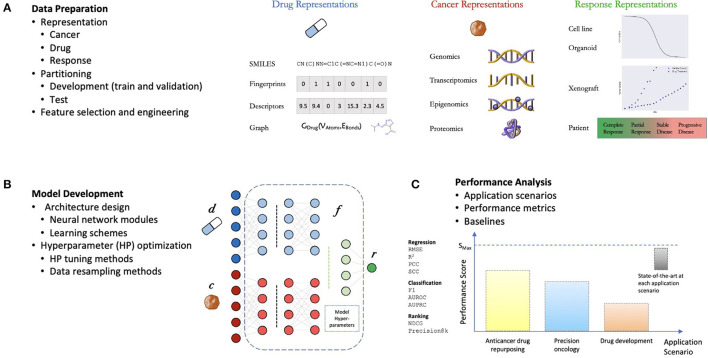
Cancer claims millions of lives yearly worldwide. While many therapies have been made available in recent years, by in large cancer remains unsolved. Exploiting computational predictive models to study and treat cancer holds great promise in improving drug development and personalized design of treatment plans, ultimately suppressing tumors, alleviating suffering, and prolonging lives of patients. A wave of recent papers demonstrates promising results in predicting cancer response to drug treatments while utilizing deep learning methods. These papers investigate diverse data representations, neural network architectures, learning methodologies, and evaluations schemes. However, deciphering promising predominant and emerging trends is difficult due to the variety of explored methods and lack of standardized framework for comparing drug response prediction models. To obtain a comprehensive landscape of deep learning methods, we conducted an extensive search and analysis of deep learning models that predict the response to single drug treatments. A total of 61 deep learning-based models have been curated, and summary plots were generated. Based on the analysis, observable patterns and prevalence of methods have been revealed. This review allows to better understand the current state of the field and identify major challenges and promising solution paths.

Keywords: deep learning; drug response prediction; drug sensitivity; multiomics; neural networks; personalized medicine; precision medicine; precision oncology.


Conflict of interest statement

The authors declare that the research was conducted in the absence of any commercial or financial relationships that could be construed as a potential conflict of interest.

Figures

Figure 1
Figure 1
(A) A snapshot of Supplementary Table 1 that lists peer-reviewed papers proposing monotherapy drug response prediction (DRP) models (the full list can be found in the Supplementary material). The papers have been curated to identify various properties (shown in table columns), such as deep learning (DL) methods, feature types, evaluation methods, etc., as discussed in detail in this paper. Multiple plots in this paper have been generated using the data from Supplementary Table 1 [(B), Figures 47C, D]. (B) Distribution of papers by year that use DL methods for DRP. The neural network models are designed using popular computational frameworks which include both proprietary and open-source software. The bar plots are color-coded by the different computational frameworks. TensorFlow/Keras and PyTorch are the most popular frameworks based on this plot. Data were collected until August 2022, considering only peer-reviewed publications.
Figure 2
Figure 2
General components of a drug response prediction (DRP) workflow. (A) Data preparation: requires generating representations of features and treatment response, partition the dataset into development set (for training and hyperparameter (HP) tuning) and test set (for performance analysis), and any additional preprocessing such feature selection/engineering. (B) Model development: the process of generating a deep learning model which involves the design of a neural network (NN) architecture (choice of NN modules and learning schemes) and model training including HP optimization. (C) Performance analysis: assessment of prediction generalization and other metrics allowing to evaluate the utility of the DRP model for different applications in oncology such as personalized recommendation of treatments, drug repurposing, and drug development. The performance is benchmarked against one or more baseline models which should ultimately be chosen from available state-of-the-art models for the investigated application.
Figure 3
Figure 3
Drug screening experiments are performed with various cancer models such as cell lines, organoids, and xenografts, where cancer samples are screened against a library of drug compounds. The screening data is transformed into a drug response dataset that can be used for developing drug response prediction models, including regression, classification, and ranking.
Figure 4
Figure 4
Cell-line drug response data is usually represented with continuous or categorical values. Drug response prediction (DRP) models use the different drug response representations to train regression, classification and ranking models. The histogram illustrates the prevalence of the difference representations and learning tasks. Certain papers exploit several representations of response and learning tasks, and therefore, these papers contribute more than one item to the histogram. The label categorical means that the continuous response was first categorized and then a DRP classifier was trained, while continuous to categorical means that a DRP regressor was trained and then the predicted response was categorized (in both cases, classification metrics were used for performance analysis).
Figure 5
Figure 5
Feature representations in drug response prediction (DRP) models. Various representations can be used to represent cancers and drugs in DRP models, as described in Sections 4, 5, respectively. Each DRP model usually exploits one or multiple feature types (Supplementary Table 1 lists the feature types that each model have used). (A) The prevalence of omics (cancer) feature representations in DRP models. (B) The prevalence of drug feature representations in DRP models. (C) The distribution of papers that utilized single-omics and multiomics features in DRP models. We used Supplementary Table 1 to generate these figures, where we considered only peer-reviewed publications, collected until August 2022. CNV, copy number variations; RPPA, reverse phase protein arrays.
Figure 6
Figure 6
Prevalence of deep learning methods in drug response prediction (DRP) papers. Various methods have been used to build DRP models which can be categorized into neural network (NN) modules (Section 6.1) and learning schemes (Section 6.2). The prevalence of NN modules and learning schemes across papers (from Supplementary Table 1) is shown, respectively, in (A, B). 1D-CNN and 2D-CNN, one- and two-dimensional convolutional NN; GNN, graph NN; DeepFM, deep factorization machine.
Figure 7
Figure 7
Evaluation and comparison of drug response prediction (DRP) models. (A) Data splitting strategies for evaluating performance with a single drug screening study include mixed-set, cancer-blind, drug-blind, and disjoint-set. (B) Cross-dataset evaluation where drug response data that is used for training and evaluation come from different studies. (C) Prevalence of common evaluation methods across studies (from Supplementary Table 1). The methods include mixed-set, cancer-blind, drug-blind, disjoint-set, and cross-dataset, as described in Sections 7.2, 7.1. (D) Histogram of the top fifteen most popular baseline models that were used to benchmark prediction performance of DRP models. The baselines are color-coded as either deep learning (DL) or classical machine learning (ML). The label Simpler-NNs refers to simpler versions of proposed models, where ablation analysis was usually conducted. The label None refers to cases where this type of baseline (i.e., ML or DL) was not used in performance analysis at all (e.g., the blue bar for None shows that 16 of the papers have not used DL-based baselines in their analysis).

References

    1. Yancovitz M, Litterman A, Yoon J, Ng E, Shapiro RL, Berman RS, et al. . Intra- and inter-tumor heterogeneity of BRAFV600EMutations in primary and metastatic melanoma. PLoS ONE. (2012) 7:e0029336. 10.1371/journal.pone.0029336 - DOI - PMC - PubMed
    1. Fisher R, Pusztai L, Swanton C. Cancer heterogeneity: implications for targeted therapeutics. Br J Cancer. (2013) 108:479–85. 10.1038/bjc.2012.581 - DOI - PMC - PubMed
    1. Collins DC, Sundar R, Lim JSJ, Yap TA. Towards precision medicine in the clinic: from biomarker discovery to novel therapeutics. Trends Pharmacol Sci. (2017) 38:25–40. 10.1016/j.tips.2016.10.012 - DOI - PubMed
    1. Hartl D, de Luca V, Kostikova A, Laramie J, Kennedy S, Ferrero E, et al. . Translational precision medicine: an industry perspective. J Transl Med. (2021) 19:245. 10.1186/s12967-021-02910-6 - DOI - PMC - PubMed
    1. Prasad V, Kaestner V, Mailankody S. Cancer drugs approved based on biomarkers and not tumor Type-FDA approval of pembrolizumab for mismatch repair-deficient solid cancers. JAMA Oncol. (2018) 4:157–8. 10.1001/jamaoncol.2017.4182 - DOI - PubMed

LinkOut - more resources