. 2023 Feb 17:14:1139351.
doi: 10.3389/fgene.2023.1139351. eCollection 2023.

Exploration and identification of anoikis-related genes in polycythemia vera

Affiliations

Exploration and identification of anoikis-related genes in polycythemia vera

Wufuer Aini et al. Front Genet. .

Abstract

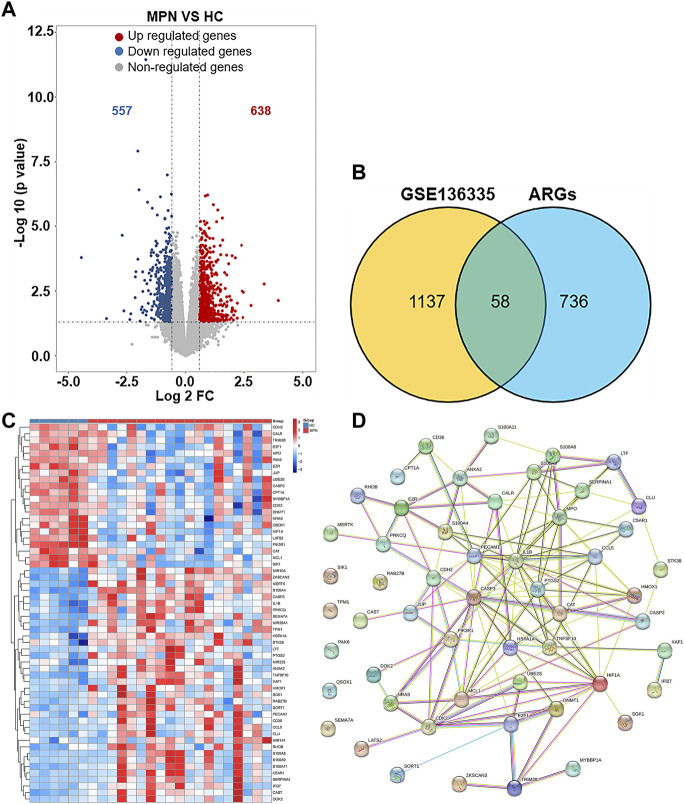
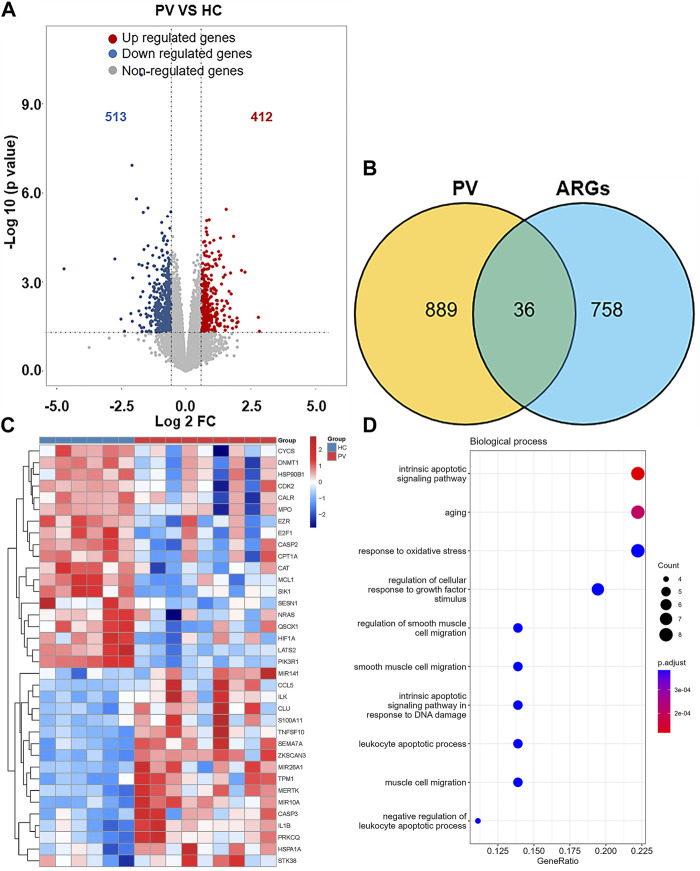
Background: Polycythemia Vera (PV) is a type of typical Myeloproliferative Neoplasms (MPNs) characterized with excessive erythropoiesis and thrombosis. Anoikis is a special programmed cell death mode induced by the adhesion disorder between cells and extracellular matrix (ECM) or adjacent cells facilitating cancer metastasis. However, few studies have focused on the role of anoikis in PV, especially on the development of PV. Methods: The microarray and RNA-seq results were screened from the Gene Expression Omnibus (GEO) database and the anoikis-related genes (ARGs) were downloaded from Genecards. The functional enrichment analysis of intersecting differentially expressed genes (DEGs) and protein-protein interaction (PPI) network analysis were performed to discover hub genes. The hub genes expression was tested in the training (GSE136335) and validation cohort (GSE145802), and RT-qPCR was performed to verify the gene expression in PV mice. Results: In the training GSE136335, a total of 1,195 DEGs was obtained from Myeloproliferative Neoplasm (MPN) patients compared with controls, among which 58 were anoikis-related DEGs. The significant enrichment of the apoptosis and cell adhesion pathways (i.e., cadherin binding) were shown in functional enrichment analysis. The PPI network was conducted to identify top five hub genes (CASP3, CYCS, HIF1A, IL1B, MCL1). The expression of CASP3 and IL1B were significantly upregulated both in validation cohort and PV mice and downregulated after treatment, suggesting that CASP3 and IL1B could be important indicators for disease surveillance. Conclusion: Our research revealed a relationship between anoikis and PV for the first time by combined analysis of gene level, protein interaction and functional enrichment, allowing novel insights into mechanisms of PV. Moreover, CASP3 and IL1B may become promising indicators of PV development and treatment.

Keywords: anoikis-related genes; differentially expressed genes; hub genes; myeloproliferative neoplasms; protein-protein interaction.


Conflict of interest statement

The authors declare that the research was conducted in the absence of any commercial or financial relationships that could be construed as a potential conflict of interest.

Figures

FIGURE 1
FIGURE 1
Study flowchart. GSE, Gene Expression Omnibus Series; GO, gene ontology; KEGG, Kyoto Encyclopedia of Genes and Genomes; PV, Polycythemia Vera; BM, Bone Marrow; MEPs, megakaryocyte and erythroid progenitors.
FIGURE 2
FIGURE 2
Screening of differentially expressed anoikis-related genes (ARGs) in MPN patients and healthy controls. (A) Volcano plot of genes differentially expressed between MPN patients and healthy controls in the GSE136335 dataset. Blue nodes represent downregulation in MPNs; red nodes represent upregulation; and grey nodes represent no significant difference from controls. (B) Intersection of differentially expressed genes (DEGs) in the GSE136335 and anoikis genes. The count on the left (1,137 genes) refers to DEGs unique to GSE136335; the count in the middle (58 genes) refers to anoikis-related DEGs; and the count on the right (736 genes) refers to unique to anoikis genes. (C) Heat map of 58 anoikis-related DEGs. (D) Protein–protein interaction (PPI) network of differentially expressed anoikis DEGs.
FIGURE 3
FIGURE 3
Expression of 58 anoikis-related DEGs in MPN (A) and subtype clusters (B).
FIGURE 4
FIGURE 4
The enrichment analysis of anoikis-related DEGs in MPNs. The dot plots display the Top10 terms enriched by anoikis-related DEGs in BPs (A), CCs (B), MFs (C) and KEGG pathways (D).
FIGURE 5
FIGURE 5
Landscape of Anoikis-related Genes in Polycythemia Vera. (A)Volcano plot of genes differentially expressed between Polycythemia Vera (PV) patients and healthy controls in the GSE136335 dataset. Blue nodes represent downregulation in PV; red nodes represent upregulation; and grey nodes represent no significant difference from controls. (B) Intersection of differentially expressed genes (DEGs) in the GSE136335 and anoikis genes. The count on the left (889 genes) refers to DEGs unique to GSE136335; the count in the middle (36 genes) refers to anoikis-related DEGs; and the count on the right (758 genes) refers to unique to anoikis genes. (C) Heat map of 36 anoikis-related DEGs. (D) Top 10 GO biological process pathway.
FIGURE 6
FIGURE 6
The protein-protein interaction network of anoikis-related DEGs in Polycythemia Vera. (A) PPI network for 36 anoikis-related DEGs; (B) Subnetwork of hub genes from the PPI network. Node color reflects the degree of connectivity (red color represents a higher degree, and yellow color represents a lower degree). (C) The expression difference of five hub genes in the training set (GSE136335).
FIGURE 7
FIGURE 7
Expression of CASP3, CYCS, HIF1A, IL1B and MCL1. The expression difference of CASP3, CYCS, HIF1A, IL1B and MCL1 in GSE145802 validation set in untreated-PV patients (PV) and healthy controls (HC) (A), and treated-PV patients (PV-treated) and HC (B).
FIGURE 8
FIGURE 8
The expression difference of PV hub genes in PV mice model. (A) The workflow of WT and PV mice model constructed by bone marrow transplantation (BMT). (B) Spleen weight 6–8 weeks after BMT. Data are represented as mean ± SEM (***p < 0.001 versus WT group). (C) Hematocrit (HCT) 6–8 weeks after BMT. Data are represented as mean ± SEM (**p < 0.01 versus WT group). (D) The experimental procedure of obtaining WT and PV mice bone marrow megakaryocyte and erythroid progenitors (MEPs) by Lin-cell enrichment and flow sorting. (E) The validation of expression difference of five PV hub genes in WT and PV mice MEPs.

References

    1. Arber D. A., Orazi A., Hasserjian R., Thiele J., Borowitz M. J., Le Beau M. M., et al. (2016). The 2016 revision to the World Health Organization classification of myeloid neoplasms and acute leukemia. Blood 127 (20), 2391–2405. 10.1182/blood-2016-03-643544 - DOI - PubMed
    1. Ashburner M., Ball C. A., Blake J. A., Botstein D., Butler H., Cherry J. M., et al. (2000). Gene ontology: Tool for the unification of biology. The gene ontology consortium. Nat. Genet. 25 (1), 25–29. 10.1038/75556 - DOI - PMC - PubMed
    1. Bakir B., Chiarella A. M., Pitarresi J. R., Rustgi A. K. (2020). EMT, MET, plasticity, and tumor metastasis. Trends Cell Biol. 30 (10), 764–776. 10.1016/j.tcb.2020.07.003 - DOI - PMC - PubMed
    1. Barbui T., Finazzi G., Falanga A. (2013). Myeloproliferative neoplasms and thrombosis. Blood 122 (13), 2176–2184. 10.1182/blood-2013-03-460154 - DOI - PubMed
    1. Baumeister J., Chatain N., Hubrich A., Maie T., Costa I. G., Denecke B., et al. (2020). Hypoxia-inducible factor 1 (HIF-1) is a new therapeutic target in JAK2V617F-positive myeloproliferative neoplasms. Leukemia 34 (4), 1062–1074. 10.1038/s41375-019-0629-z - DOI - PubMed