

Unveiling the therapeutic potential of cabozantinib-loaded poly D,L-lactic-co-glycolic acid and polysarcosine nanoparticles in inducing apoptosis and cytotoxicity in human HepG2 hepatocellular carcinoma cell lines and in vivo anti-tumor activity in SCID female mice
- PMID: 36874145
- PMCID: PMC9975495
- DOI: 10.3389/fonc.2023.1125857
Unveiling the therapeutic potential of cabozantinib-loaded poly D,L-lactic-co-glycolic acid and polysarcosine nanoparticles in inducing apoptosis and cytotoxicity in human HepG2 hepatocellular carcinoma cell lines and in vivo anti-tumor activity in SCID female mice
Abstract
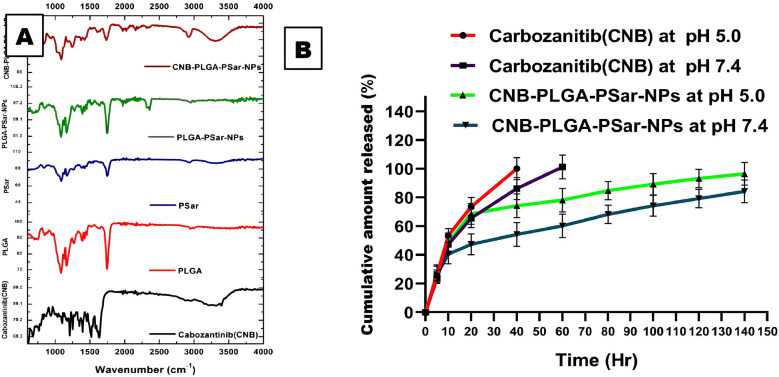
Introduction: The study aimed to develop a nano-based drug delivery system for the treatment of hepatocellular carcinoma (HCC), a type of liver cancer that accounts for 90% of all liver malignancies. The study focused on the use of cabozantinib (CNB), a potent multikinase inhibitor that targets the VEGF receptor 2, as the chemotherapeutic drug. We developed CNB-loaded nanoparticles made from Poly D, L-lactic-co-glycolic acid, and Polysarcosine (CNB-PLGA-PSar-NPs) for use in human HepG2 cell lines.
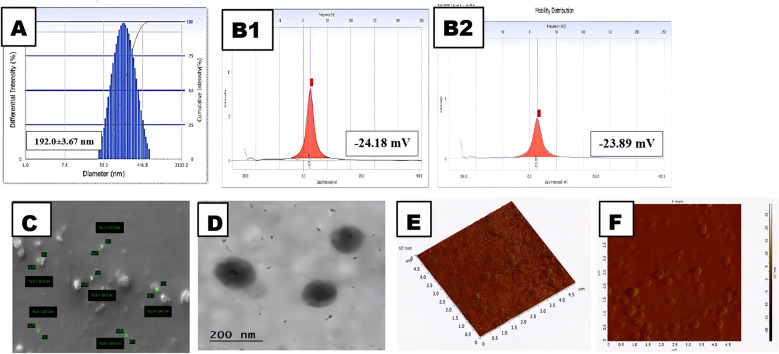
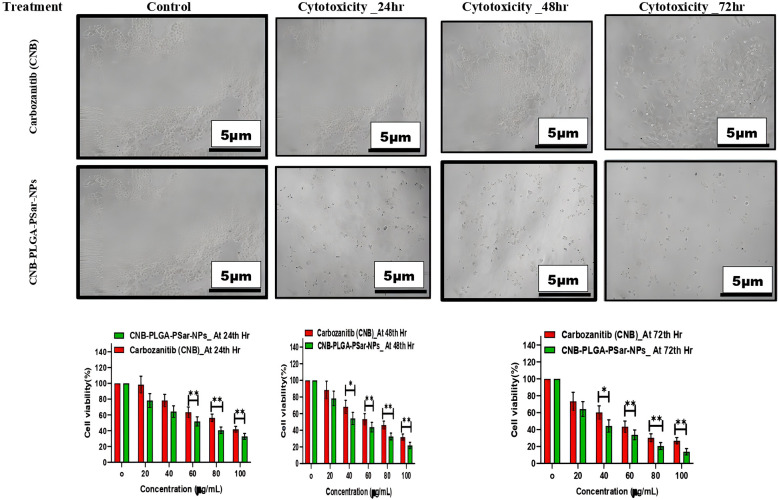
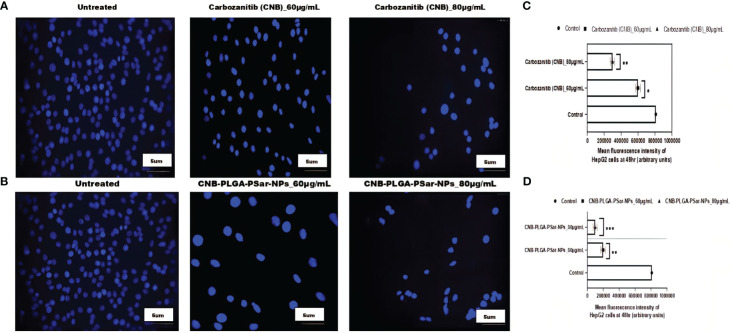
Methods: By O/W solvent evaporation method, the polymeric nanoparticles were prepared. The various techniques, such as photon correlation spectroscopy, scanning electron microscopy, and transmission electron microscopy were used, to determine the formulation's particle size, zeta potential, and morphology. SYBR Green/ROX qPCR Master Mix and RT-PCR equipment used to measure liver cancer cell line and tissue mRNA expression and MTT assay to test HepG2 cell cytotoxicity. Cell cycle arrest analysis, annexin V assay, and ZE5 Cell Analyzer apoptosis assay were also performed.
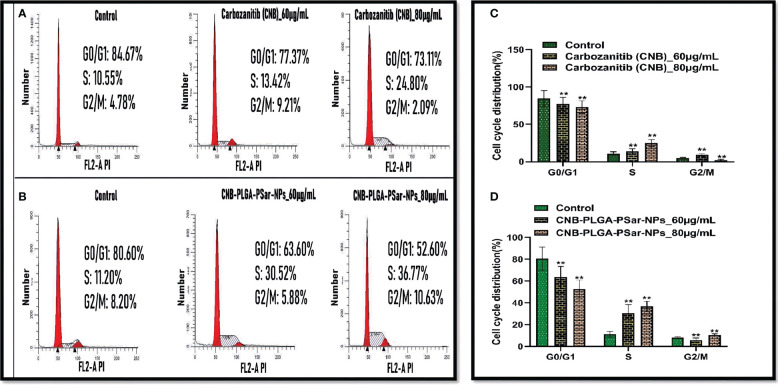
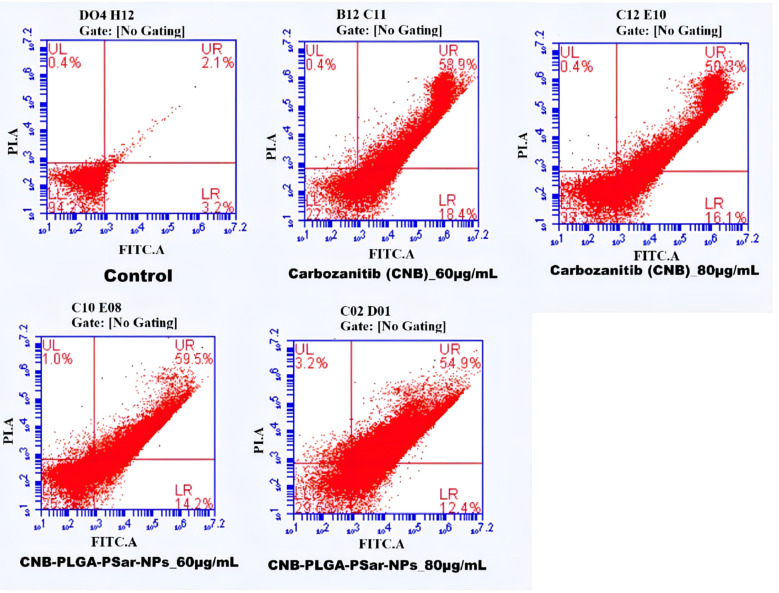
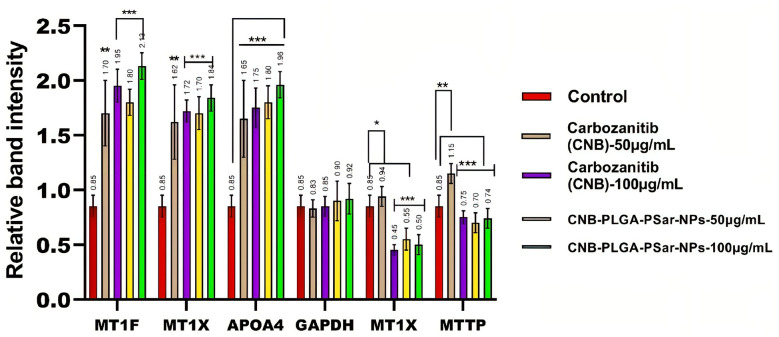
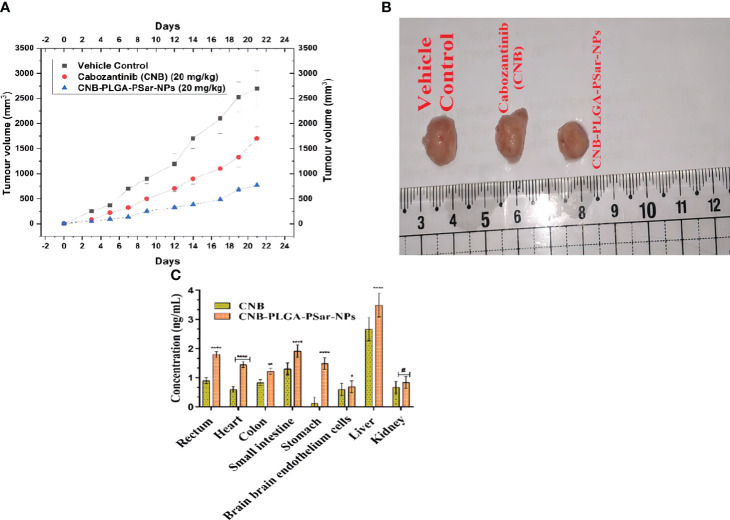
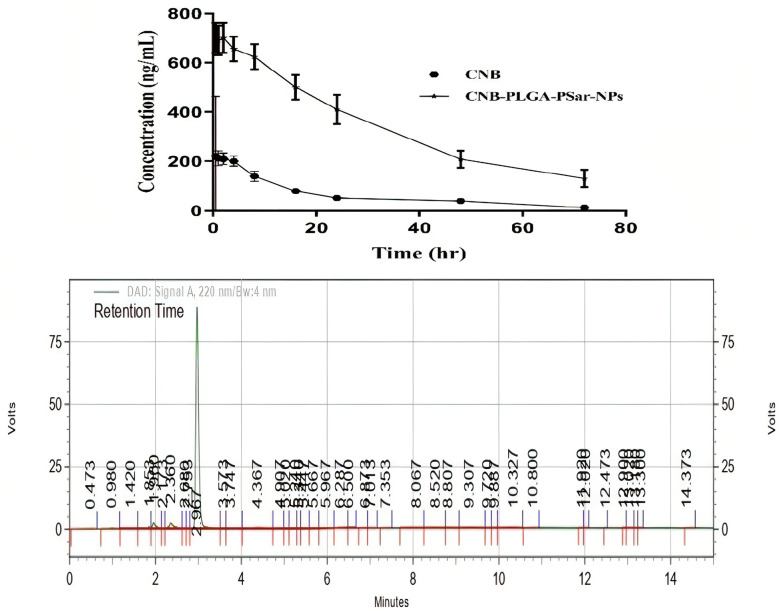
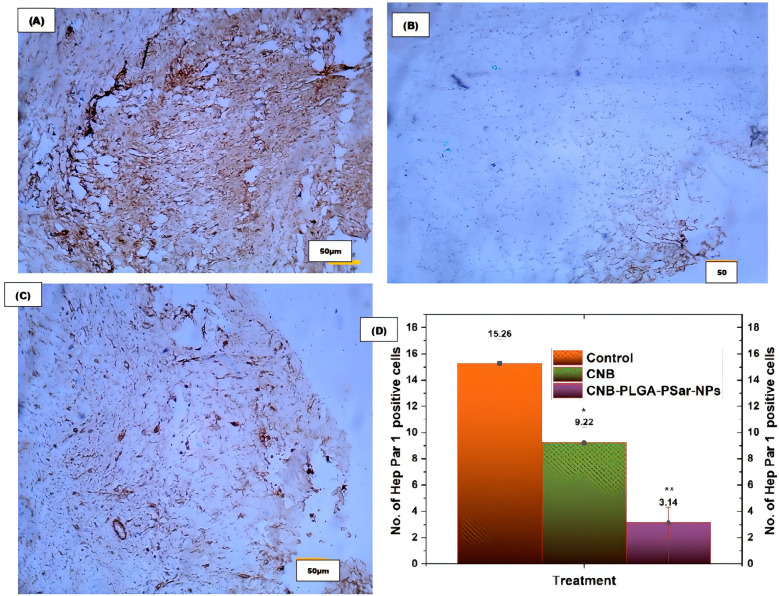
Results: The results of the study showed that the particle diameters were 192.0 ± 3.67 nm with 0.128 PDI and -24.18 ± 3.34 mV zeta potential. The antiproliferative and proapoptotic effects of CNB-PLGA-PSar-NPs were evaluated using MTT and flow cytometry (FCM). The IC50 value of CNB-PLGA-PSar-NPs was 45.67 µg/mL, 34.73 µg/mL, and 21.56 µg/mL for 24, 48, and 72 h, respectively. The study also found that 11.20% and 36.77% of CNB-PLGA-PSar-NPs-treated cells were apoptotic at 60 µg/mL and 80 µg/mL, respectively, suggesting that the nanoparticles were effective in inducing apoptosis in the cancer cells. It can also conclude that, CNB-PLGA-PSar-NPs inhibit human HepG2 hepatocellular carcinoma cells and kill them by upregulating the tumour suppressor genes MT1F, MT1X, and downregulating MTTP, APOA4. Further in vivo antitumor activity was well reported in SCID female mice.
Discussion: Overall, this study suggests that the CNB-PLGA-PSar-NPs are a promising drug delivery system for the treatment of HCC, and further research is needed to investigate their potential in clinical treatment.
Keywords: HepG2; annexin V staining; apoptosis analysis; cabozantinib; flow cytometry; polysarcosine.
Copyright © 2023 Bhattacharya, Parihar and Prajapati.
Conflict of interest statement
The authors declare that the research was conducted in the absence of any commercial or financial relationships that could be construed as a potential conflict of interest.
Figures
Similar articles
-
Preparation, evaluation, and in vitro cytotoxicity studies of artesunate-loaded glycyrrhetinic acid decorated PEG-PLGA nanoparticles.Drug Dev Ind Pharm. 2020 Nov;46(11):1889-1897. doi: 10.1080/03639045.2020.1825475. Epub 2020 Oct 12. Drug Dev Ind Pharm. 2020. PMID: 32975456
-
Preparation of Poly[lactic-co-glycolic] Acid Nanospheres and Its Role in Hepatoma Cells.J Nanosci Nanotechnol. 2021 Feb 1;21(2):977-986. doi: 10.1166/jnn.2021.18627. J Nanosci Nanotechnol. 2021. PMID: 33183433
-
Physical PEGylation Enhances The Cytotoxicity Of 5-Fluorouracil-Loaded PLGA And PCL Nanoparticles.Int J Nanomedicine. 2019 Nov 28;14:9259-9273. doi: 10.2147/IJN.S223368. eCollection 2019. Int J Nanomedicine. 2019. PMID: 31819428 Free PMC article.
-
Brigatinib loaded poly(d,l-lactide-co-glycolide) nanoparticles for improved anti-tumoral activity against non-small cell lung cancer cell lines.Drug Dev Ind Pharm. 2021 Jul;47(7):1112-1120. doi: 10.1080/03639045.2021.1983585. Epub 2021 Oct 1. Drug Dev Ind Pharm. 2021. PMID: 34551665
-
Cytotoxicity of targeted PLGA nanoparticles: a systematic review.RSC Adv. 2021 Mar 3;11(16):9433-9449. doi: 10.1039/d1ra00074h. eCollection 2021 Mar 1. RSC Adv. 2021. PMID: 35423427 Free PMC article. Review.
Cited by
-
Application of nanotechnology in the treatment of hepatocellular carcinoma.Front Pharmacol. 2024 Nov 29;15:1438819. doi: 10.3389/fphar.2024.1438819. eCollection 2024. Front Pharmacol. 2024. PMID: 39679376 Free PMC article. Review.
-
A Cross-talk between Nanomedicines and Cardiac Complications: Comprehensive View.Curr Pharm Des. 2025;31(10):741-752. doi: 10.2174/0113816128347223241021111914. Curr Pharm Des. 2025. PMID: 39506444 Review.
-
d-α-tocopheryl polyethylene glycol 1000 succinate surface scaffold polysarcosine based polymeric nanoparticles of enzalutamide for the treatment of colorectal cancer: In vitro, in vivo characterizations.Heliyon. 2024 Feb 2;10(3):e25172. doi: 10.1016/j.heliyon.2024.e25172. eCollection 2024 Feb 15. Heliyon. 2024. PMID: 38333874 Free PMC article.
-
Cabozantinib-phospholipid complex for enhanced solubility, bioavailability, and reduced toxicity in liver cancer.Ther Deliv. 2025 Jan;16(1):25-41. doi: 10.1080/20415990.2024.2435240. Epub 2024 Nov 29. Ther Deliv. 2025. PMID: 39611708
-
Research and application of thermosensitive Pickering emulsion with X-ray and ultrasound dual-modal imaging functions for intra-arterial embolization treatment.J Pharm Anal. 2025 Apr;15(4):101133. doi: 10.1016/j.jpha.2024.101133. Epub 2024 Oct 24. J Pharm Anal. 2025. PMID: 40475270 Free PMC article.
References
LinkOut - more resources
Full Text Sources
Miscellaneous