. 2023 Feb 15:21:1573-1583.
doi: 10.1016/j.csbj.2023.02.024. eCollection 2023.

Why loss of Y? A pan-cancer genome analysis of tumors with loss of Y chromosome

Affiliations

Why loss of Y? A pan-cancer genome analysis of tumors with loss of Y chromosome

Philipp Müller et al. Comput Struct Biotechnol J. .

Abstract

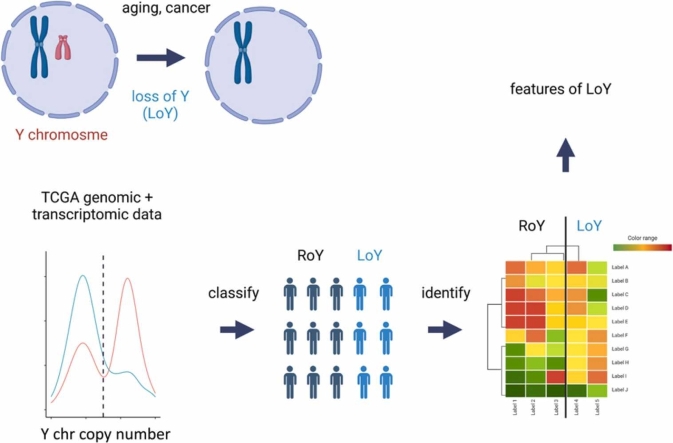
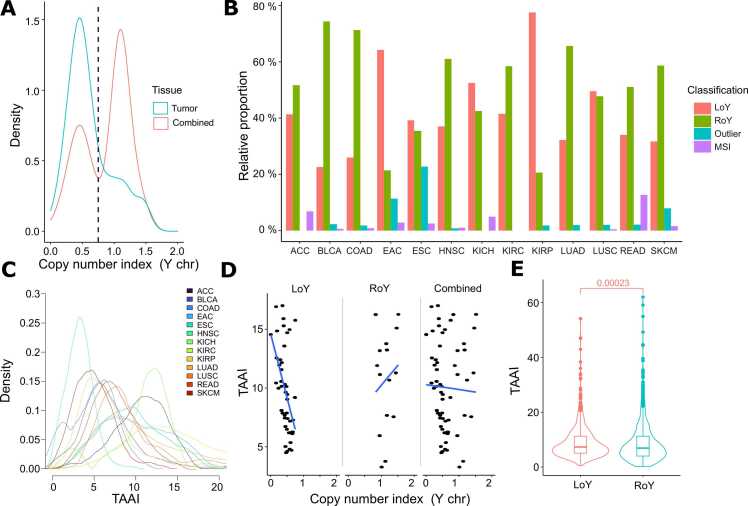
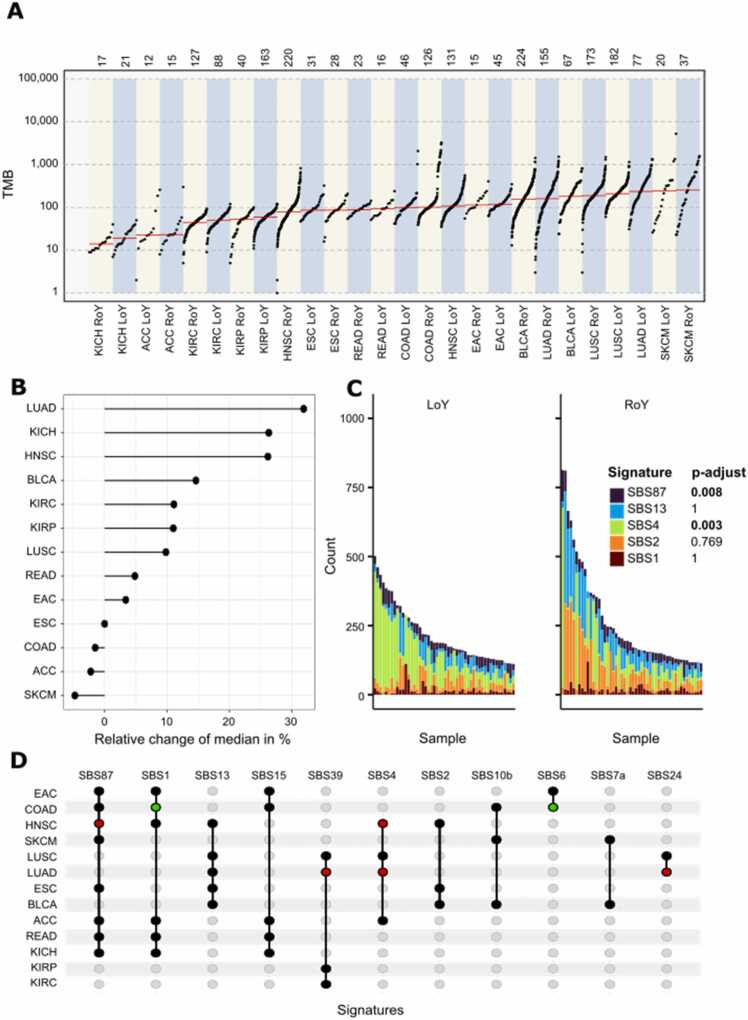
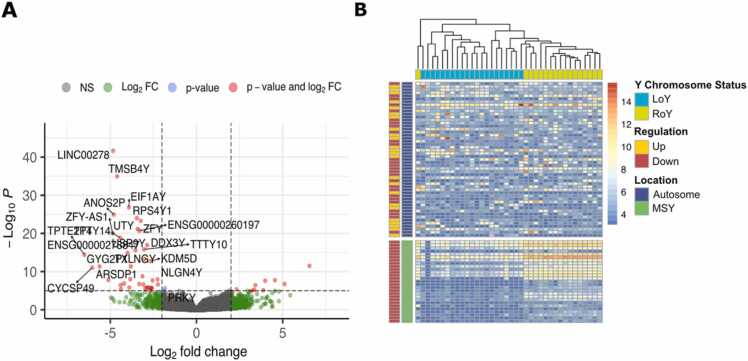
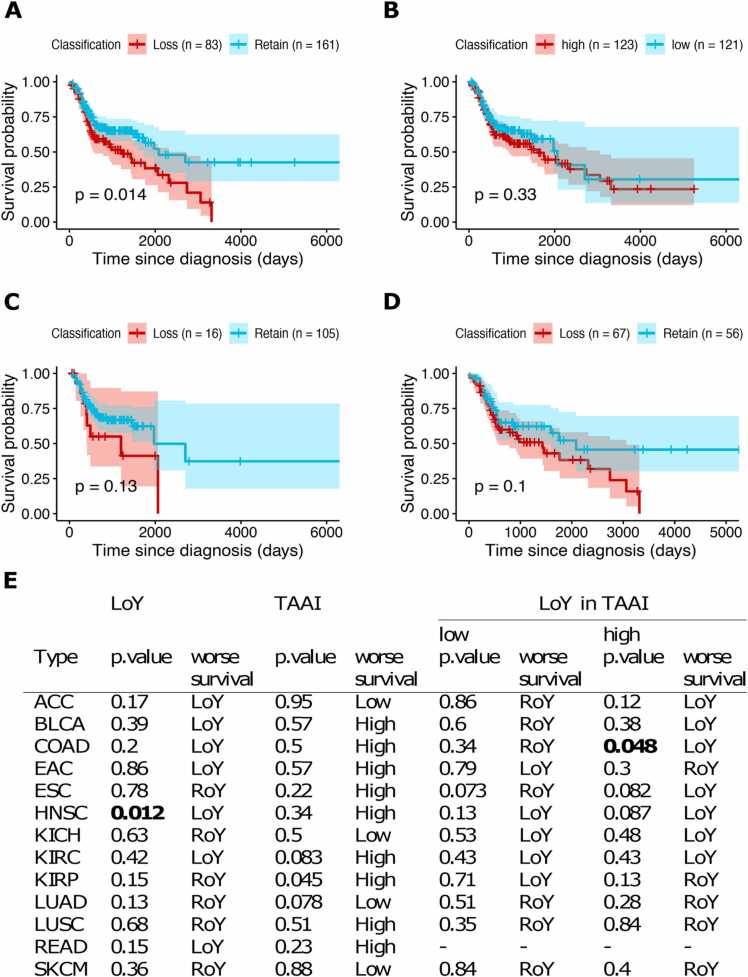
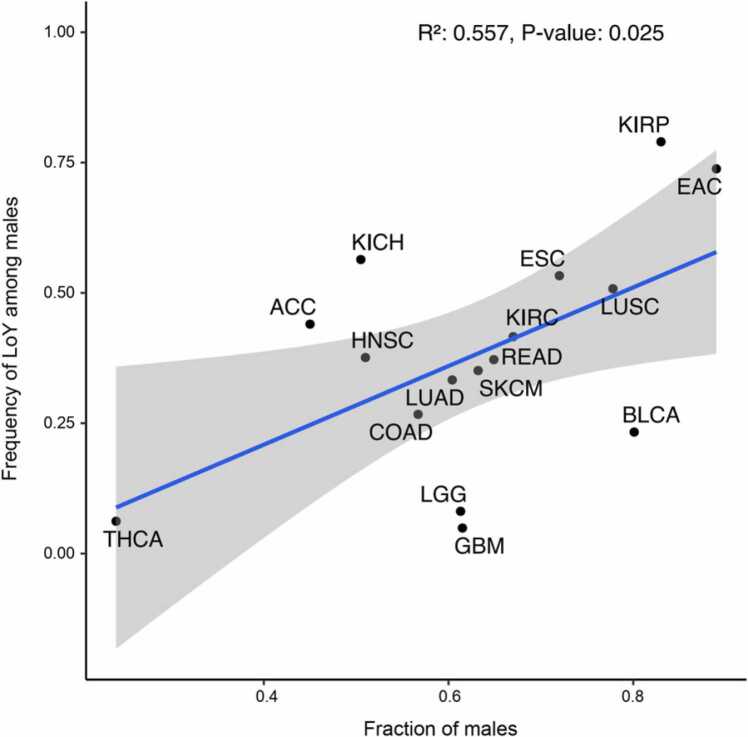
Loss of the Y chromosome (LoY) is frequently observed in somatic cells of elderly men. However, LoY is highly increased in tumor tissue and correlates with an overall worse prognosis. The underlying causes and downstream effects of LoY are widely unknown. Therefore, we analyzed genomic and transcriptomic data of 13 cancer types (2375 patients) and classified tumors of male patients according to loss or retain of the Y chromosome (LoY or RoY, average LoY fraction: 0.46). The frequencies of LoY ranged from almost absence (glioblastoma, glioma, thyroid carcinoma) to 77% (kidney renal papillary cell carcinoma). Genomic instability, aneuploidy, and mutation burden were enriched in LoY tumors. In addition, we found more frequently in LoY tumors the gate keeping tumor suppressor gene TP53 mutated in three cancer types (colon adenocarcinoma, head and neck squamous carcinoma, lung adenocarcinoma) and oncogenes MET, CDK6, KRAS, and EGFR amplified in multiple cancer types. On the transcriptomic level, we observed MMP13, known to be involved in invasion, to be up-regulated in LoY of three adenocarcinomas and down-regulation of the tumor suppressor gene GPC5 in LoY of three cancer types. Furthermore, we found enrichment of a smoking-related mutation signature in LoY tumors of head and neck and lung cancer. Strikingly, we observed a correlation between cancer type-specific sex bias in incidence rates and frequencies of LoY, in line with the hypothesis that LoY increases cancer risk in males. Overall, LoY is a frequent phenomenon in cancer that is enriched in genomically unstable tumors. It correlates with genomic features beyond the Y chromosome and might contribute to higher incidence rates in males.

Keywords: Aneuploidy; Loss of Y; Pan-Cancer; TCGA; Y chromosome.


Conflict of interest statement

The authors declare that they have no known competing financial interests or personal relationships that could have appeared to influence the work reported in this paper.

Figures

ga1
Graphical abstract
Fig. 1
Fig. 1
LoY Classification and distribution. (A) Threshold selection for esophageal adenocarcinoma (EAC) indicated as a dashed vertical line. Density is plotted for the Y chromosome copy number index (x-axis). (B) Cancer classification shown as distributions relative to the total number of each cancer type. (C) Density curves of the TAAI shown for the 13 cancer types. Each curve is colored as indicated in the legend. (D) Comparison of the copy number index for the Y chromosome and the respective patient’s TAAI shown for esophageal adenocarcinoma. (E) Combined TAAI of all 13 cancer entities. LoY (red) and RoY (turquoise). The abbreviated cancer types are: adrenocortical carcinoma (ACC), bladder urothelial carcinoma (BLCA), colon adenocarcinoma (COAD), esophageal adenocarcinoma (EAC), esophageal squamous cell carcinoma (ESC), head and neck squamous cell carcinoma (HNSC), kidney chromophobe (KICH), kidney renal clear cell carcinoma (KIRC), kidney renal papillary cell carcinoma (KIRP), lung adenocarcinoma (LUAD), lung squamous cell carcinoma (LUSC), rectum adenocarcinoma (READ), and skin cutaneous carcinoma (SKCM).
Fig. 2
Fig. 2
Comparison of somatic SNV features between LoY and RoY. (A) Cancer types separated in LoY and RoY tumors (x-axis) shown in an ascending order based on their median TMB (y-axis) marked in red. (B) Comparison of the relative differences between LoY and RoY with regards to the median TMB. The full names of the cancer types can be found in Fig. 1. (C) Mutation signature analysis for head and neck squamous cell carcinoma separated by Y chromosome status is shown with LoY on the left and RoY on the right. Patients are sorted by their absolute number of single base substitutions. The colors reflect COSMIC mutation signatures according to the panel on the right. Adjusted p-values of the t-test comparing the frequency of mutations assigned to a given signature between LoY and RoY are shown on the right. (D) Upset plot indicates the presence of a signature within a cancer type as a black dot. Significant enrichment in the subsets is highlighted in red for LoY and in green for RoY.
Fig. 3
Fig. 3
Differential gene expression analysis between LoY and RoY. (A) Volcano plot for kidney chromophobe with Y-linked genes highlighted. Genes that show a p-value smaller than 0.05 and an absolute log2 fold change> 2 are colored in red. (B) Heatmap shows genes that are either significantly up- or downregulated in LoY of kidney chromophobe compared to RoY (p-value smaller than 0.05 and log2FC above or below 2). Samples are arranged in columns, genes in rows. Top indicates Y chromosome status of each tumor, left indicates Y chromosomal or autosomal location of a gene and up or down regulation in LoY.
Fig. 4
Fig. 4
Survival analysis of the TCGA cohort stratified by LoY and TAAI. (A-D) Kaplan-Meier survival curves for HNSC patients. (A) Comparison between LoY (red) and RoY (turquoise). (B) Comparison between a high TAAI (red) and low TAAI (turquoise). (C) Comparison between LoY (red) and RoY (turquoise) for patients that show a low TAAI. (D) Comparison between LoY (red) and RoY (turquoise) for patients that show a high TAAI. (E) Overview of overall survival analyses for the 13 cancer cohorts showing p-values of Kaplan-Meier analyses for stratification based on LoY/RoY and low/high TAAI (left). Subanalyses were performed for patient groups with low and high TAAI, respectively, to test for an effect of LoY within these subgroups (right).
Fig. 5
Fig. 5
Relation between the frequency of LoY and incidence rates of males. Comparison of the frequency of LoY among males against the incidence rate of males (fraction of males) relative to all patients of a cancer type is shown. Sex-specific incidence rates were derived from recent literature ([25], [1], [46], [40]). The full descriptions of the cancer types can be found in Fig. 1.

References

    1. Alesina P.F., Walz M.K. Adrenal tumors: are gender aspects relevant? Visc Med. 2020;36(1):15–19. - PMC - PubMed
    1. Alexandrov L.B., Jones P.H., Wedge D.C., Sale J.E., Campbell P.J., Nik-Zainal S., Stratton M.R. Clock-like mutational processes in human somatic cells. Nat Genet. 2015;47(12):1402–1407. - PMC - PubMed
    1. Aran D., Sirota M., Butte A.J. Systematic pan-cancer analysis of tumour purity. Nat Commun. 2015;6:8971. - PMC - PubMed
    1. Arseneault M., Monlong J., Vasudev N.S., Laskar R.S., Safisamghabadi M., Harnden P., Egevad L., Nourbehesht N., Panichnantakul P., Holcatova I., Brisuda A., Janout V., Kollarova H., Foretova L., Navratilova M., Mates D., Jinga V., Zaridze D., Mukeria A., Jandaghi P., Brennan P., Brazma A., Tost J., Scelo G., Banks R.E., Lathrop M., Bourque G., Riazalhosseini Y. Loss of chromosome Y leads to down regulation of KDM5D and KDM6C epigenetic modifiers in clear cell renal cell carcinoma. Sci Rep. 2017;7:44876. - PMC - PubMed
    1. Asim A., Agarwal S., Avasthi K.K., Sureka S., Rastogi N., Dean D.D., Mohindra S. Investigation of LOY in prostate, pancreatic, and colorectal cancers in males: a case-control study. Expert Rev Mol Diagn. 2020;20(12):1259–1263. - PubMed