. 2023 Feb 14:21:1598-1605.
doi: 10.1016/j.csbj.2023.02.023. eCollection 2023.

StarmapVis: An interactive and narrative visualisation tool for single-cell and spatial data

Affiliations

StarmapVis: An interactive and narrative visualisation tool for single-cell and spatial data

Shichao Ma et al. Comput Struct Biotechnol J. .

Abstract

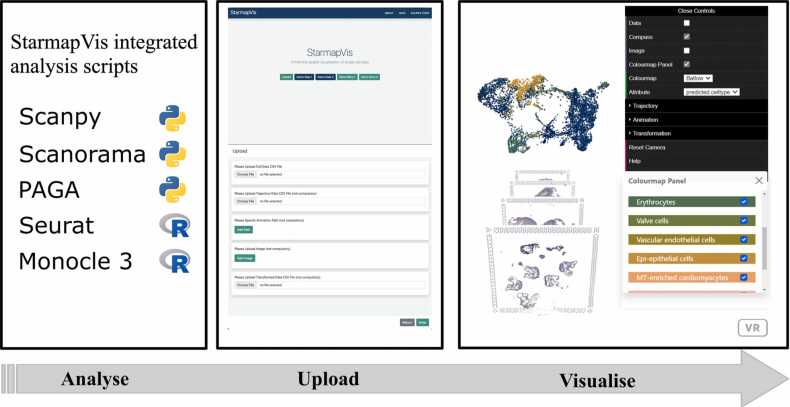
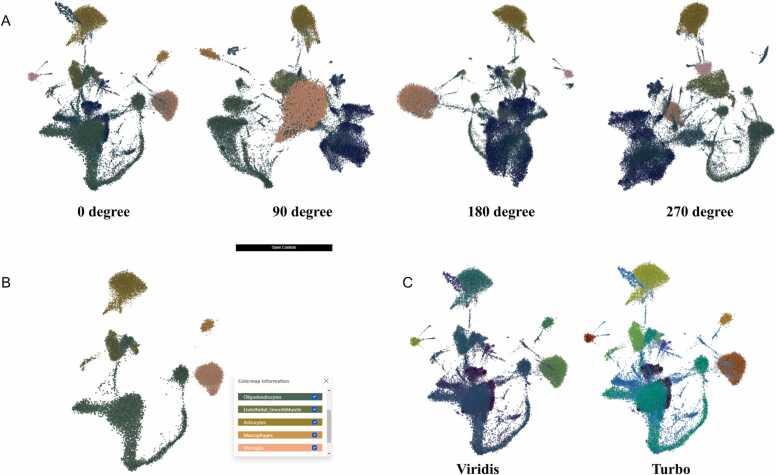
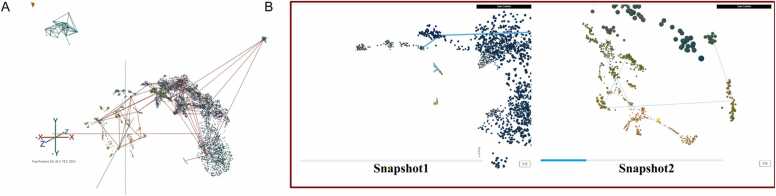
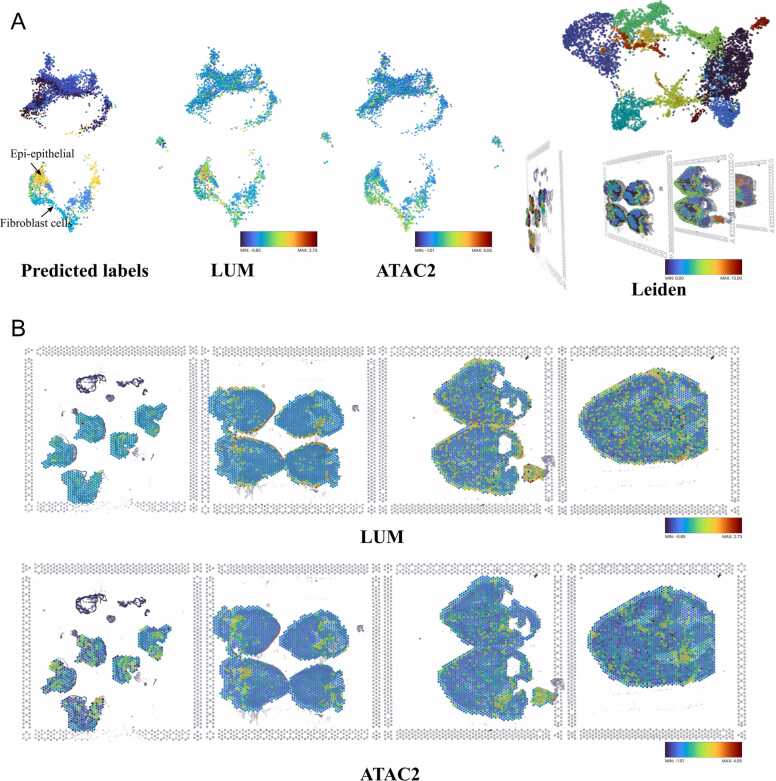
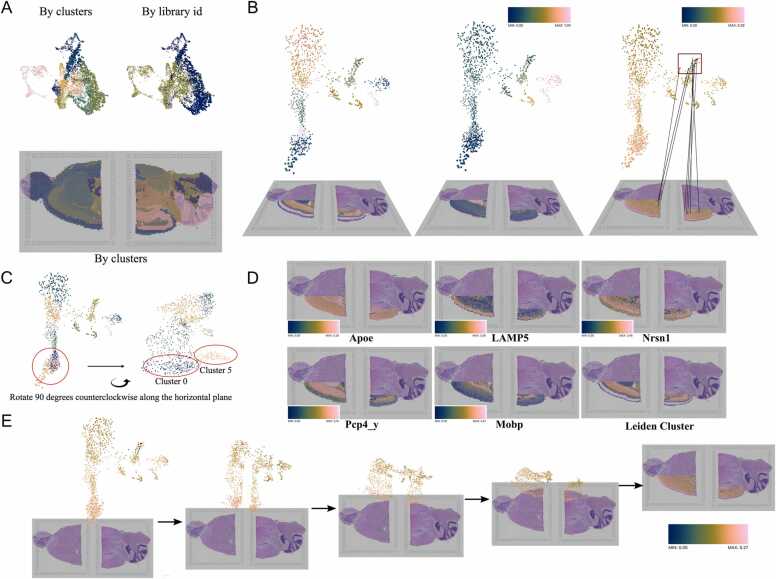
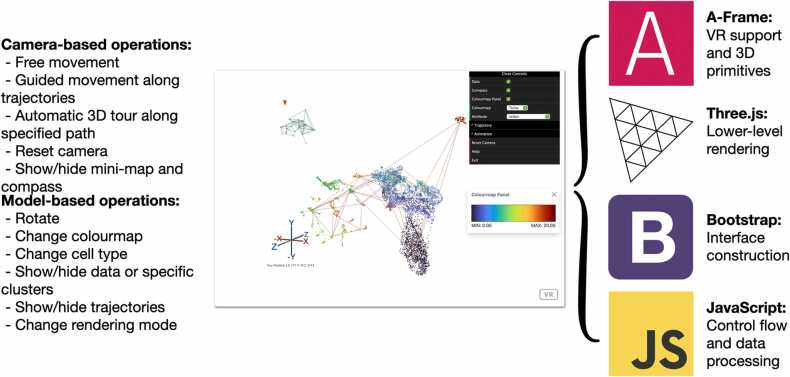
Current single-cell visualisation techniques project high dimensional data into 'map' views to identify high-level structures such as cell clusters and trajectories. New tools are needed to allow the transversal through the high dimensionality of single-cell data to explore the single-cell local neighbourhood. StarmapVis is a convenient web application displaying an interactive downstream analysis of single-cell expression or spatial transcriptomic data. The concise user interface is powered by modern web browsers to explore the variety of viewing angles unavailable to 2D media. Interactive scatter plots display clustering information, while the trajectory and cross-comparison among different coordinates are displayed in connectivity networks. Automated animation of camera view is a unique feature of our tool. StarmapVis also offers a useful animated transition between two-dimensional spatial omic data to three-dimensional single cell coordinates. The usability of StarmapVis is demonstrated by four data sets, showcasing its practical usability. StarmapVis is available at: https://holab-hku.github.io/starmapVis.

Keywords: Narrative visualisation; Single-cell data visualisation; Spatial-single cell integration; Web application.


Conflict of interest statement

The authors declare that they have no competing interests.

Figures

ga1
Graphical abstract
Fig. 1
Fig. 1
Overview of the StarmapVis pipeline.
Fig. 2
Fig. 2
(A) 3D scatter plot visualised in the non-VR mode of single-cell RNA-seq data containing 65,539 mouse vertex cells with different viewing angles. (B) Customised selected clusters. (C) UMAP plot with different colour maps.
Fig. 3
Fig. 3
(A) Overview of the connectivity tree of PAGA analysed results in the non-VR mode of Covid-19 single-cell RNA-seq data. (B) Dynamic visualisation of selected branch path (snapshot from animation).
Fig. 4
Fig. 4
(A) UMAP of integration of the four transcriptomics datasets (left) and four spatial transcriptomics datasets with images of the chicken heart coloured by Leiden (right). (B) LUM and ATAC2 expression of the four transcriptomics datasets. Colour legends are provided for plots which are made up of continuous colour map.
Fig. 5
Fig. 5
(A) Histological images with cells of the anterior mouse brain (bottom left) and posterior mouse brain (bottom right), and integration of the two transcriptomics datasets using Scanorama (top). (B) 3D transformation of cortex subset from 2D spatial location to 3D UMAP, coloured by Leiden clustering, Pseudotime and gene Apoe expression level from left to time. (C) Different angles of 3D UMAP. (D) Differentially expressed genes from Leiden group 5, 0, 2, 1, 3. (E) Transformation process from UMAP to spatial coordinates, coloured by mt-Nd5 expression level. Colour legends are provided for plots which are made up of continuous colour map.
Fig. 6
Fig. 6
Our application is constructed on several open-source libraries and frameworks to provide users with multiple operations to investigate or demonstrate the single cell and spatial omic data.

References

    1. Kiselev V.Y., Andrews T.S., Hemberg M. Challenges in unsupervised clustering of single-cell RNA-seq data. Nat Rev Genet. 2019;20:273–282. doi: 10.1038/s41576-018-0088-9. - DOI - PubMed
    1. Chen G., Ning B., Shi T. Single-cell RNA-Seq technologies and related computational data analysis. Front Genet. 2019;10:317. doi: 10.3389/fgene.2019.00317. - DOI - PMC - PubMed
    1. Burgess D.J. Spatial transcriptomics coming of age. Nat Rev Genet. 2019;20 doi: 10.1038/s41576-019-0129-z. [317–317] - DOI - PubMed
    1. Wagner Filho JA, Rey MF, Freitas CMDS, Nedel L. Immersive visualization of abstract information: an evaluation on dimensionally-reduced data scatterplots. In: Proceedings of the 2018 IEEE conference on virtual reality and 3D user interfaces (VR); 2018, p. 483–90. 〈10.1109/VR.2018.8447558〉. - DOI
    1. Ventura S., Brivio E., Riva G., Baños R.M. Immersive versus non-immersive experience: exploring the feasibility of memory assessment through 360° technology. Front Psychol. 2019:10. doi: 10.3389/fpsyg.2019.02509. - DOI - PMC - PubMed

LinkOut - more resources