. 2023 Jan 23;14(2):815-833.
doi: 10.1364/BOE.478693. eCollection 2023 Feb 1.

Deep learning-enabled volumetric cone photoreceptor segmentation in adaptive optics optical coherence tomography images of normal and diseased eyes

Affiliations

Deep learning-enabled volumetric cone photoreceptor segmentation in adaptive optics optical coherence tomography images of normal and diseased eyes

Somayyeh Soltanian-Zadeh et al. Biomed Opt Express. .

Abstract

Objective quantification of photoreceptor cell morphology, such as cell diameter and outer segment length, is crucial for early, accurate, and sensitive diagnosis and prognosis of retinal neurodegenerative diseases. Adaptive optics optical coherence tomography (AO-OCT) provides three-dimensional (3-D) visualization of photoreceptor cells in the living human eye. The current gold standard for extracting cell morphology from AO-OCT images involves the tedious process of 2-D manual marking. To automate this process and extend to 3-D analysis of the volumetric data, we propose a comprehensive deep learning framework to segment individual cone cells in AO-OCT scans. Our automated method achieved human-level performance in assessing cone photoreceptors of healthy and diseased participants captured with three different AO-OCT systems representing two different types of point scanning OCT: spectral domain and swept source.


Conflict of interest statement

The mention of commercial products, their sources, or their use in connection with material reported herein is not to be construed as either an actual or implied endorsement of such products by the US Department of Health and Human Services.

Figures

Fig. 1.
Fig. 1.
Overall framework for automatic segmentation of individual cone photoreceptor outer segments from AO-OCT scans.
Fig. 2.
Fig. 2.
Architecture of L-CNN for segmentation of the cone outer segment layer. The numbers beneath each block denote the number of filters for that layer. The stride in all convolutional and max-pooling layers was set to 1 and 2, respectively.
Fig. 3.
Fig. 3.
Components of V-CNN. A) ClassNet for determining whether vessels are present in an image. B) The vessel segmentation network. C) Example AO-SLO images with simulated vessels added to them. The numbers beneath each block in A and B denote the number of filters for that layer. The stride in all convolutional layers is 1, unless noted otherwise. DAC: dense atrous convolution, RMP: residual multi-kernel pooling block.
Fig. 4.
Fig. 4.
C-CNN for automatic cone segmentation. A) Network architecture. The network outputs three predictions: The binary center mask denoting the center of cells, the binary segmentation mask for cell soma segmentation, and the distance map representing the normalized distance of each cone pixel to its corresponding cell boundary. The stride in all convolutional layers is 1, unless noted otherwise. B) Application of C-CNN to cropped AO-OCT volumes during inference. Each segmented cone is represented by a randomly assigned color in the en face (xy) and cross-sectional (xz and yz) slices.
Fig. 5.
Fig. 5.
Example layer segmentation results compared to manual grading for test images on A) FDA and B) IU datasets. Each image corresponds to a different participant. Images were cropped to the area around the cone outer segment layer for illustration purposes. Scale bars: 100 µm.
Fig. 6.
Fig. 6.
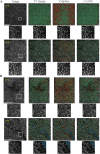
Example cone detection results on A) healthy and B) diseased images. Smaller images are the zoomed-in illustrations of the white box area (50 × 50 µm2, 0.15°×0.15°) shown in the original images. The top and bottom examples in A and B are from the FDA (500 × 500 and 300 × 240 pixels, respectively) and IU datasets (300 × 300 pixels for both), respectively. Green points denote true positives, yellow denotes false negatives, and red denotes false positives. Segmented vessel regions are overlaid as light blue masks. Scale bars: 100 µm (∼0.3°).
Fig. 7.
Fig. 7.
Boxplots for the dice scores of cone segmentation on 2-D mean projection images for FDA’s healthy group (total of 15 images, ∼100 cones per image). The data have been color-coded based on their actual lateral pixel sizes. The black dashed line indicates the mean score across images. On each box, the central mark indicates the median, and the bottom and top edges indicate the 25th and 75th percentiles, respectively. The whiskers extend to the most extreme data points not considered outliers (delineated using the circle markers).
Fig. 8.
Fig. 8.
Volumetric cone segmentations illustrated with randomly assigned colors on en face (xy) and cross-sectional (xz and yz) slices for participants from the FDA dataset: A) healthy individual at 7° temporal to fovea, and B) participant with drusen at 1° temporal to fovea. Scale bars: 50 µm.
Fig. 9.
Fig. 9.
Automatic cone outer segment (OS) length measurements. A) Distribution of OS lengths for true positive cones on RP and age-matched controls across different retinal eccentricities. B) Visualization of OS length as a 2-D heatmap for a diseased participant with drusen deposits at 1° temporal to fovea. Scale bar: 50 µm

References

    1. Garrioch R., Langlo C., Dubis A. M., Cooper R. F., Dubra A., Carroll J., “The repeatability of in vivo parafoveal cone density and spacing measurements,” Optometry and Vision Science 89(5), 632–643 (2012).10.1097/OPX.0b013e3182540562 - DOI - PMC - PubMed
    1. Scoles D., Sulai Y. N., Langlo C. S., Fishman G. A., Curcio C. A., Carroll J., Dubra A., “In vivo imaging of human cone photoreceptor inner segments,” Invest. Ophthalmol. Visual Sci. 55(7), 4244–4251 (2014).10.1167/iovs.14-14542 - DOI - PMC - PubMed
    1. Sabesan R., Hofer H., Roorda A., “Characterizing the human cone photoreceptor mosaic via dynamic photopigment densitometry,” PLoS One 10(12), e0144891 (2015).10.1371/journal.pone.0144891 - DOI - PMC - PubMed
    1. Cooper R. F., Tuten W. S., Dubra A., Brainard D. H., Morgan J. I. W., “Non-invasive assessment of human cone photoreceptor function,” Biomed. Opt. Express 8(11), 5098–5112 (2017).10.1364/BOE.8.005098 - DOI - PMC - PubMed
    1. Dubra A., Sulai Y., “Reflective afocal broadband adaptive optics scanning ophthalmoscope,” Biomed. Opt. Express 2(6), 1757–1768 (2011).10.1364/BOE.2.001757 - DOI - PMC - PubMed

LinkOut - more resources