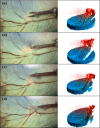
Surgical microscope integrated MHz SS-OCT with live volumetric visualization
- PMID: 36874504
- PMCID: PMC9979659
- DOI: 10.1364/BOE.477386
Surgical microscope integrated MHz SS-OCT with live volumetric visualization
Abstract
Intraoperative optical coherence tomography is still not overly pervasive in routine ophthalmic surgery, despite evident clinical benefits. That is because today's spectral-domain optical coherence tomography systems lack flexibility, acquisition speed, and imaging depth. We present to the best of our knowledge the most flexible swept-source optical coherence tomography (SS-OCT) engine coupled to an ophthalmic surgical microscope that operates at MHz A-scan rates. We use a MEMS tunable VCSEL to implement application-specific imaging modes, enabling diagnostic and documentary capture scans, live B-scan visualizations, and real-time 4D-OCT renderings. The technical design and implementation of the SS-OCT engine, as well as the reconstruction and rendering platform, are presented. All imaging modes are evaluated in surgical mock maneuvers using ex vivo bovine and porcine eye models. The applicability and limitations of MHz SS-OCT as a visualization tool for ophthalmic surgery are discussed.
© 2023 Optica Publishing Group under the terms of the Optica Open Access Publishing Agreement.
Conflict of interest statement
WD and RAL: Carl Zeiss Meditec (C, F) NHD, HR, TS and BS: Carl Zeiss Meditec (E)
Figures


Similar articles
-
Visualization of Cataract Surgery Steps With 4D Microscope-Integrated Swept-Source Optical Coherence Tomography in Ex Vivo Porcine Eyes.Transl Vis Sci Technol. 2024 Apr 2;13(4):18. doi: 10.1167/tvst.13.4.18. Transl Vis Sci Technol. 2024. PMID: 38607633 Free PMC article.
-
Multi-MHz MEMS-VCSEL swept-source optical coherence tomography for endoscopic structural and angiographic imaging with miniaturized brushless motor probes.Biomed Opt Express. 2021 Mar 26;12(4):2384-2403. doi: 10.1364/BOE.420394. eCollection 2021 Apr 1. Biomed Opt Express. 2021. PMID: 33996236 Free PMC article.
-
Enhanced volumetric visualization for real time 4D intraoperative ophthalmic swept-source OCT.Biomed Opt Express. 2016 Apr 12;7(5):1815-29. doi: 10.1364/BOE.7.001815. eCollection 2016 May 1. Biomed Opt Express. 2016. PMID: 27231623 Free PMC article.
-
Retinal applications of swept source optical coherence tomography (OCT) and optical coherence tomography angiography (OCTA).Prog Retin Eye Res. 2021 Sep;84:100951. doi: 10.1016/j.preteyeres.2021.100951. Epub 2021 Jan 28. Prog Retin Eye Res. 2021. PMID: 33516833 Review.
-
Clinical utility of anterior segment swept-source optical coherence tomography in glaucoma.Oman J Ophthalmol. 2016 Jan-Apr;9(1):3-10. doi: 10.4103/0974-620X.176093. Oman J Ophthalmol. 2016. PMID: 27013821 Free PMC article. Review.
Cited by
-
New Directions for Ophthalmic OCT - Handhelds, Surgery, and Robotics.Transl Vis Sci Technol. 2025 Jan 2;14(1):14. doi: 10.1167/tvst.14.1.14. Transl Vis Sci Technol. 2025. PMID: 39808124 Free PMC article. Review.
-
Visualization of Cataract Surgery Steps With 4D Microscope-Integrated Swept-Source Optical Coherence Tomography in Ex Vivo Porcine Eyes.Transl Vis Sci Technol. 2024 Apr 2;13(4):18. doi: 10.1167/tvst.13.4.18. Transl Vis Sci Technol. 2024. PMID: 38607633 Free PMC article.
-
Intraoperative adaptive eye model based on instrument-integrated OCT for robot-assisted vitreoretinal surgery.Int J Comput Assist Radiol Surg. 2025 May;20(5):881-889. doi: 10.1007/s11548-025-03325-0. Epub 2025 Feb 8. Int J Comput Assist Radiol Surg. 2025. PMID: 39921834 Free PMC article.
-
Five degrees-of-freedom mechanical arm with remote center of motion (RCM) device for volumetric optical coherence tomography (OCT) retinal imaging.Biomed Opt Express. 2024 Jan 29;15(2):1150-1162. doi: 10.1364/BOE.505294. eCollection 2024 Feb 1. Biomed Opt Express. 2024. PMID: 38404307 Free PMC article.
-
Microscope integrated MHz optical coherence tomography system for neurosurgery: development and clinical in-vivo imaging.Biomed Opt Express. 2024 Sep 23;15(10):5960-5979. doi: 10.1364/BOE.530976. eCollection 2024 Oct 1. Biomed Opt Express. 2024. PMID: 39421776 Free PMC article.
References
-
- Drexler W., Fujimoto J. G., Optical Coherence Tomography: Technology and Applications (Springer, 2015).
-
- Everett M., Magazzeni S., Schmoll T., Kempe M., “Optical coherence tomography: from technology to applications in ophthalmology,” Translational Biophotonics 3(1), e202000012 (2020.10.1002/tbio.202000012 - DOI
LinkOut - more resources
Full Text Sources
Other Literature Sources
