

COVID-19 therapy optimization by AI-driven biomechanical simulations
- PMID: 36874529
- PMCID: PMC9969369
- DOI: 10.1140/epjp/s13360-023-03744-5
COVID-19 therapy optimization by AI-driven biomechanical simulations
Abstract
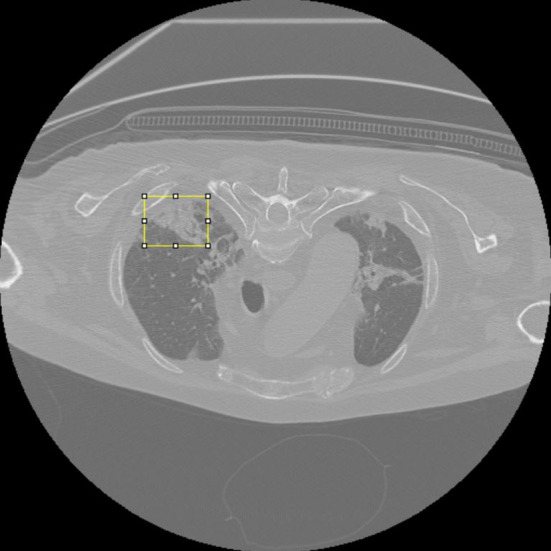
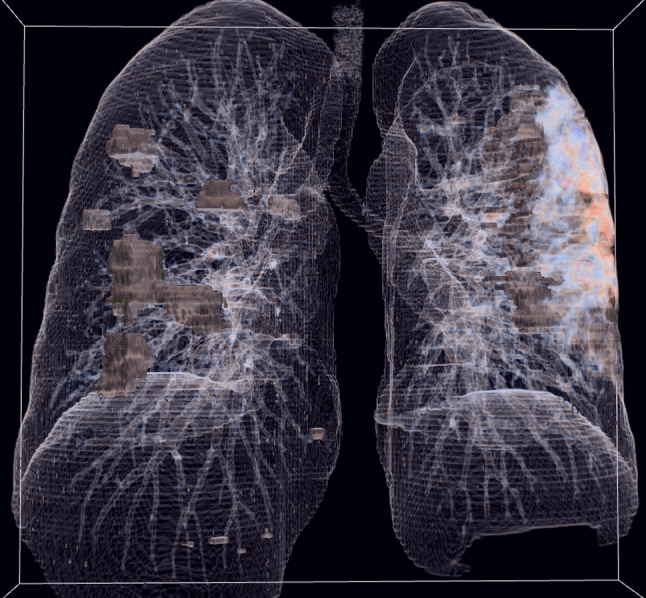
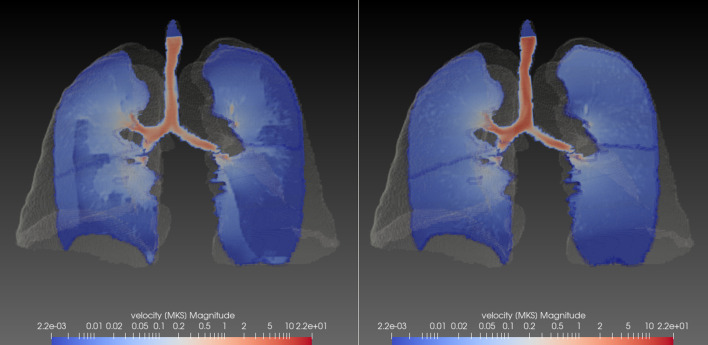
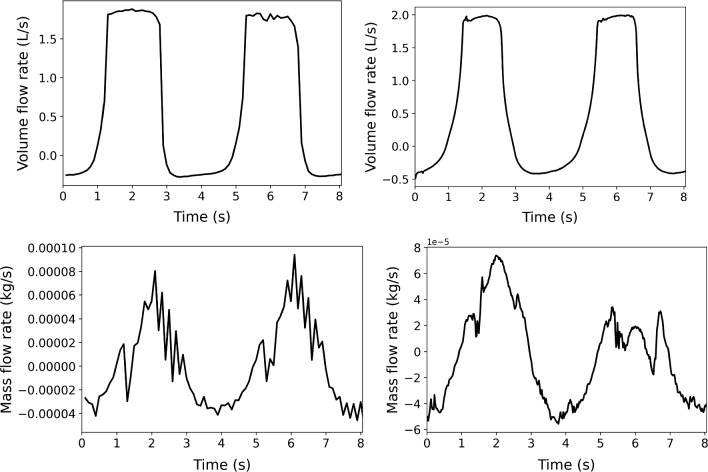
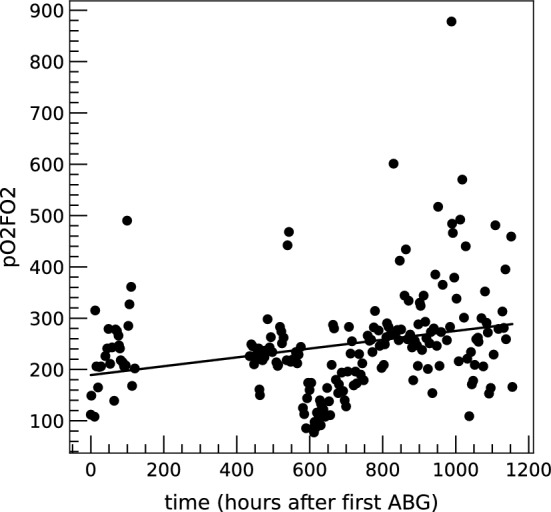
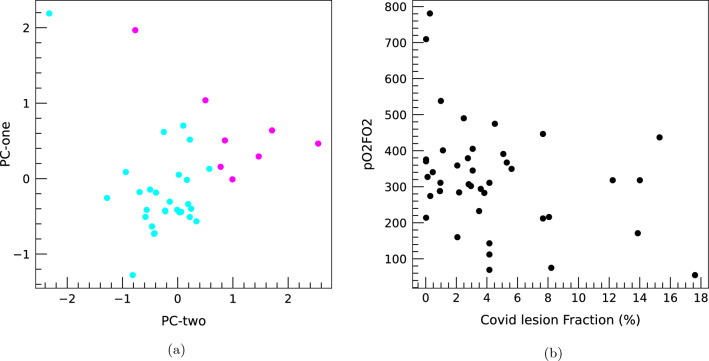
The COVID-19 disease causes pneumonia in many patients that in the most serious cases evolves into the Acute Distress Respiratory Syndrome (ARDS), requiring assisted ventilation and intensive care. In this context, identification of patients at high risk of developing ARDS is a key point for early clinical management, better clinical outcome and optimization in using the limited resources available in the intensive care units. We propose an AI-based prognostic system that makes predictions of oxygen exchange with arterial blood by using as input lung Computed Tomography (CT), the air flux in lungs obtained from biomechanical simulations and Arterial Blood Gas (ABG) analysis. We developed and investigated the feasibility of this system on a small clinical database of proven COVID-19 cases where the initial CT and various ABG reports were available for each patient. We studied the time evolution of the ABG parameters and found correlation with the morphological information extracted from CT scans and disease outcome. Promising results of a preliminary version of the prognostic algorithm are presented. The ability to predict the evolution of patients' respiratory efficiency would be of crucial importance for disease management.
© The Author(s), under exclusive licence to Società Italiana di Fisica and Springer-Verlag GmbH Germany, part of Springer Nature 2023, Springer Nature or its licensor (e.g. a society or other partner) holds exclusive rights to this article under a publishing agreement with the author(s) or other rightsholder(s); author self-archiving of the accepted manuscript version of this article is solely governed by the terms of such publishing agreement and applicable law.
Conflict of interest statement
Conflict of interestThe authors have no conflicts of interest to declare that are relevant to the content of this article.
Figures
References
-
- Liu Y, Mao B, Liang S, Yang JW, Lu HW, Chai YH, Wang L, Zhang L, Li QH, Zhao L, He Y, Gu XL, Ji XB, Li L, Jie ZJ, Li Q, Li XY, Lu HZ, Zhang WH, Song YL, Qu JM, Xu JF. Eur. Respir. J. 2020 doi: 10.1183/13993003.01112-2020. - DOI
LinkOut - more resources
Full Text Sources