. 2022 Oct 1;6(4):960-979.
doi: 10.1162/netn_a_00230. eCollection 2022.

It's about time: Linking dynamical systems with human neuroimaging to understand the brain

Affiliations

It's about time: Linking dynamical systems with human neuroimaging to understand the brain

Yohan J John et al. Netw Neurosci. .

Abstract

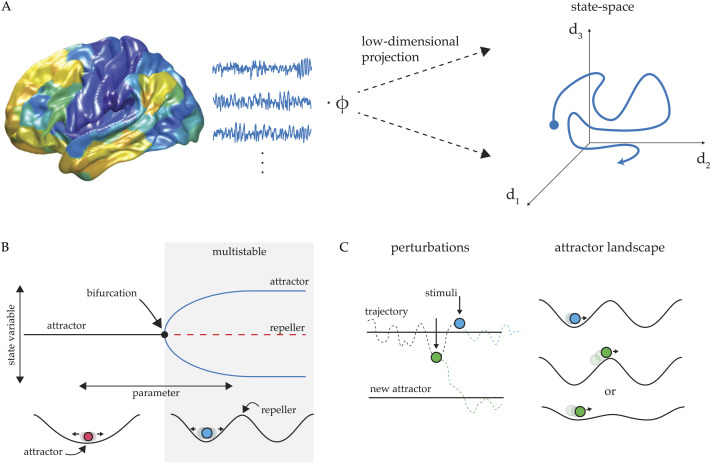
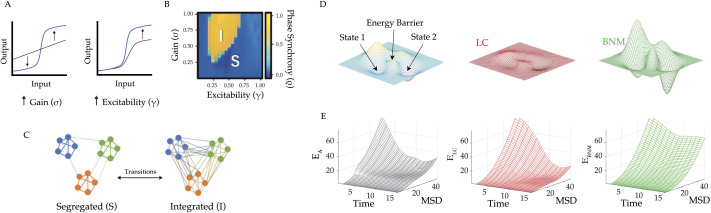
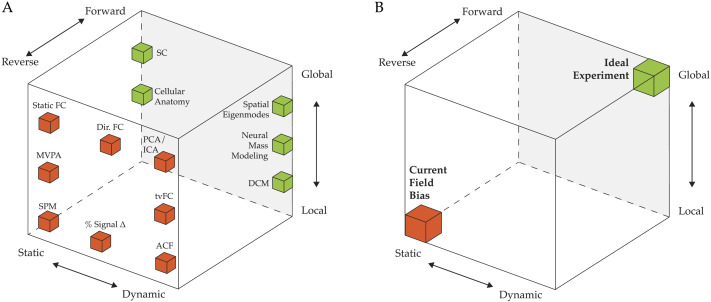
Most human neuroscience research to date has focused on statistical approaches that describe stationary patterns of localized neural activity or blood flow. While these patterns are often interpreted in light of dynamic, information-processing concepts, the static, local, and inferential nature of the statistical approach makes it challenging to directly link neuroimaging results to plausible underlying neural mechanisms. Here, we argue that dynamical systems theory provides the crucial mechanistic framework for characterizing both the brain's time-varying quality and its partial stability in the face of perturbations, and hence, that this perspective can have a profound impact on the interpretation of human neuroimaging results and their relationship with behavior. After briefly reviewing some key terminology, we identify three key ways in which neuroimaging analyses can embrace a dynamical systems perspective: by shifting from a local to a more global perspective, by focusing on dynamics instead of static snapshots of neural activity, and by embracing modeling approaches that map neural dynamics using "forward" models. Through this approach, we envisage ample opportunities for neuroimaging researchers to enrich their understanding of the dynamic neural mechanisms that support a wide array of brain functions, both in health and in the setting of psychopathology.

Keywords: Attractor landscapes; Bifurcations; Dynamics; Neuroscience; fMRI.


Conflict of interest statement

Competing Interests: The authors have declared that no competing interests exist.

Figures

<b>Figure 1.</b>
Figure 1.
Overview of state space concept. (A) Large multivariate recordings of brain activity, such as in neuroimaging datasets, can be more tractable to analyze and visualize after first projecting the data into a state space sensitive to a desired feature in the data—for example, principal components for variance, or independent components for distinct signals. (B) Upper panel: pitch-fork bifurcation diagram showing a parameter change that transitions the system from a single stable attractor regime to a multistable regime with two stable attractors (blue lines) and one unstable attractor (red, dotted line). Lower panel: a potential energy landscape depiction of the same unistable and multistable regimes from above. (C) Identifying the attractor landscape of a system provides a reference for the system’s dynamics, which then predicts distinct response to perturbation. External input to a system can be treated either as a perturbation to the system’s trajectory or as a deformation of the system’s attractor landscape.
<b>Figure 2.</b>
Figure 2.
Neuromodulating the manifold. (A) Using a neural mass model implemented in The Virtual Brain, the input-output curve defining the activity of a slow variable was manipulated in two distinct ways: the sigmoid curve was steepened (left, neural gain) or amplified (right, excitability). (B) varying neural gain and excitability caused an abrupt switch in systems-level dynamics—by increasing neural gain, the system shifted from a Segregated state (“S,” low phase synchrony) into an Integrated state (“I,” high phase synchrony). (C) Schematic diagram of functional brain networks in the Segregated (i.e., “S”) and Integrated (i.e., “I”) phases—in the Integrated state, there are increased connections present between otherwise isolated modules. (D) Upper panel: an energy landscape, which defines the energy required to move between different brain states—by increasing response gain, noradrenaline is proposed to flatten the energy landscape (red); whereas by increasing multiplicative gain, acetylcholine should deepen the energy wells (green). Lower panel: empirical BOLD trajectory energies as a function of mean squared displacement (MSD) and sample time point (TR) of the baseline activity (black) and after phasic bursts in the locus coeruleus (a key noradrenergic hub in the brainstem, red) and the basal nucleus of Meynert (the major source of cortical acetylcholine, green)—relative to the baseline energy landscape phasic bursts in the locus coeruleus (red) lead to a flattening or reduction of the energy landscape, whereas peaks in the basal nucleus of Meynert (green) lead to a raising of the energy landscape. Panels A–C adapted from (Li et al., 2019) and Panels D–E adapted from (Munn et al., 2021).
<b>Figure 3.</b>
Figure 3.
The space of analytic approaches in human neuroimaging. A nonexhaustive collection of different popular methods for analyzing human neuroimaging data, embedded into a cube axes that highlight three key dynamical systems characteristics: Static-to-Dynamic (x), Reverse-to-Forwards (y), and Local-to-Global (z). We have argued that embracing the dynamical systems perspective requires moving to the top right of the cube (i.e., the “Ideal Experiment”). While the theoretical goal of models should be dynamic, global, and built with forward modeling in mind, multiple approaches are necessary for comprehensive understanding, especially the analysis of empirically obtained data (the reverse approach). For further clarity, methods with high loading on the “Reverse” axis are colored red, and those high on the “Forwards” axis are colored green. Note that some methods cover larger portions of this space than has been designated here (e.g., both PCA and ICA can be used in either a dynamic or a static sense) and that the boxes should not be considered as strong limits for particular methods, but rather as an approximate consensus for how particular methods are currently used by the majority of neuroimaging studies in the field. SPM = statistical parametric mapping; FC = functional connectivity; MVPA = multivoxel pattern analysis; tvFC = time-varying functional connectivity; Dir. FC = directed functional connectivity; PCA = principal components analysis; ICA = independent components analysis; ACF = autocorrelation function; DCM = dynamic causal modeling; SC = structural connectivity.

References

    1. Aquino, K. M., Schira, M. M., Robinson, P. A., Drysdale, P. M., & Breakspear, M. (2012). Hemodynamic traveling waves in human visual cortex. PLoS Computational Biology, 8(3), e1002435. 10.1371/journal.pcbi.1002435, - DOI - PMC - PubMed
    1. Arnsten, A. F. T. (1998). The biology of being frazzled. Science, 280(5370), 1711–1712. 10.1126/science.280.5370.1711, - DOI - PubMed
    1. beim Graben, P., Jimenez-Marin, A., Diez, I., Cortes, J. M., Desroches, M., & Rodrigues, S. (2019). Metastable resting state brain dynamics. Frontiers in Computational Neuroscience, 13, 62. 10.3389/fncom.2019.00062, - DOI - PMC - PubMed
    1. Beurle, R. (1956). Properties of a mass of cells capable of regenerating pulses. Philosophical Transactions of the Royal Society of London. Series B, Biological Sciences, 240(669), 55–94. 10.1098/rstb.1956.0012 - DOI
    1. Bizzarri, M., Brash, D. E., Briscoe, J., Grieneisen, V. A., Stern, C. D., & Levin, M. (2019). A call for a better understanding of causation in cell biology. Nature Reviews Molecular Cell Biology, 20(5), 261–262. 10.1038/s41580-019-0127-1, - DOI - PubMed

LinkOut - more resources