. 2023 Feb 17:14:1129524.
doi: 10.3389/fimmu.2023.1129524. eCollection 2023.

An integrated co-expression network analysis reveals novel genetic biomarkers for immune cell infiltration in chronic kidney disease

Affiliations

An integrated co-expression network analysis reveals novel genetic biomarkers for immune cell infiltration in chronic kidney disease

Jia Xia et al. Front Immunol. .

Abstract

Background: Chronic kidney disease (CKD) is characterized by persistent damage to kidney function or structure. Progression to end-stage leads to adverse effects on multiple systems. However, owing to its complex etiology and long-term cause, the molecular basis of CKD is not completely known.

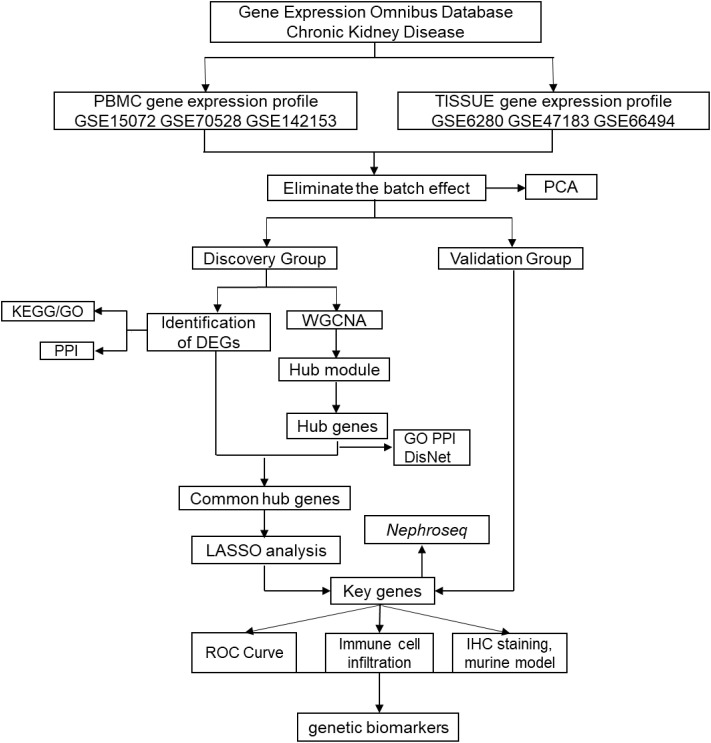
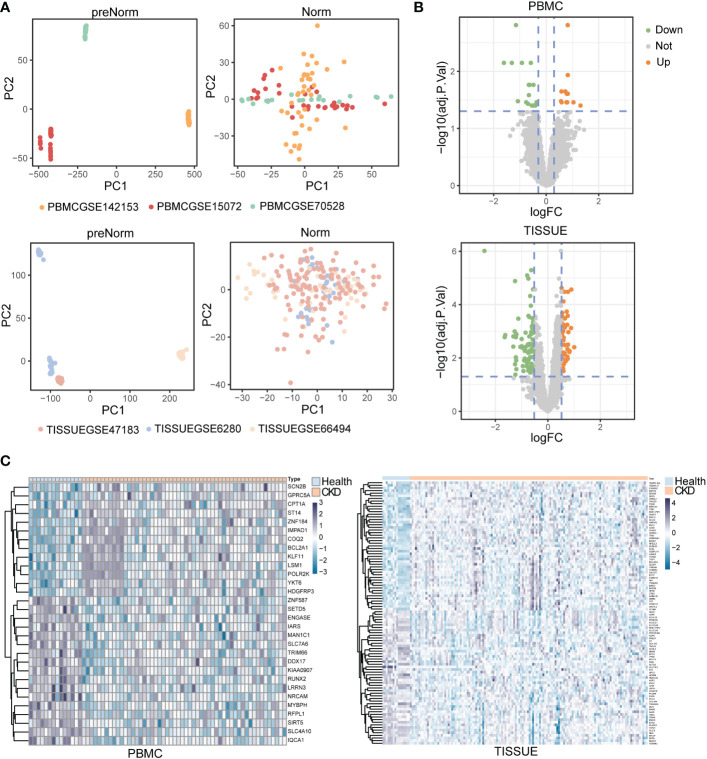
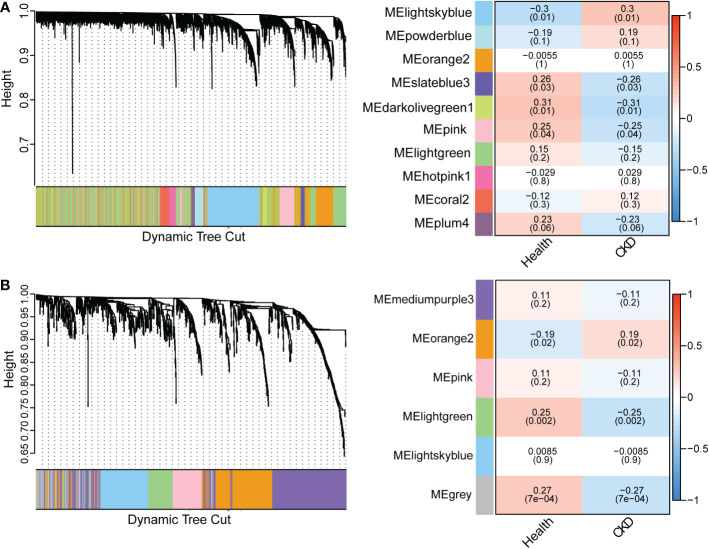
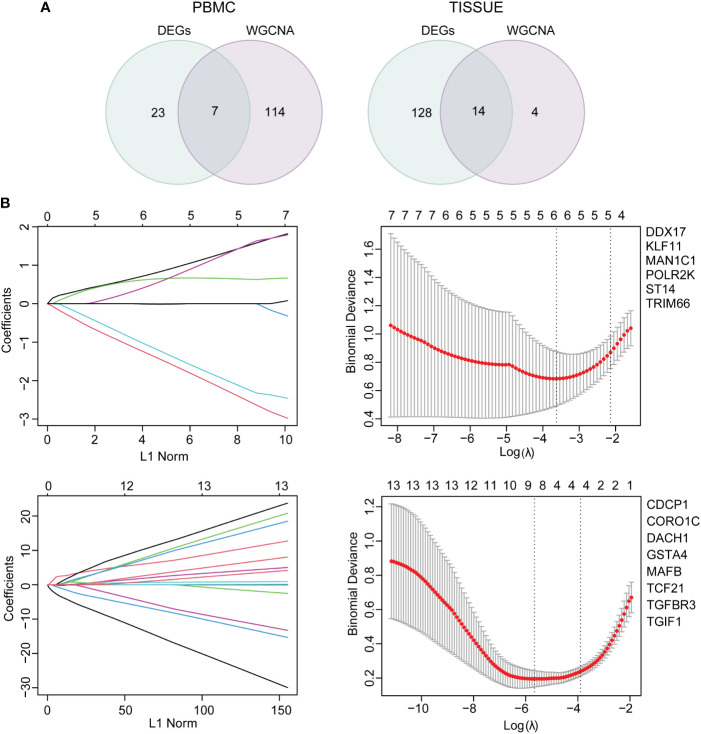
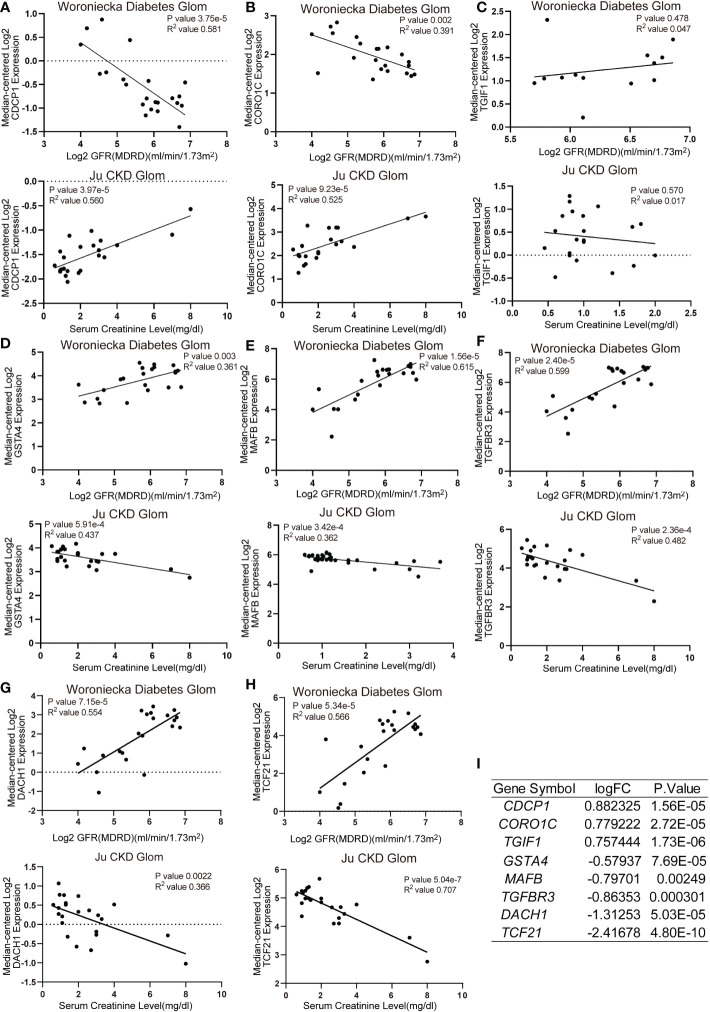
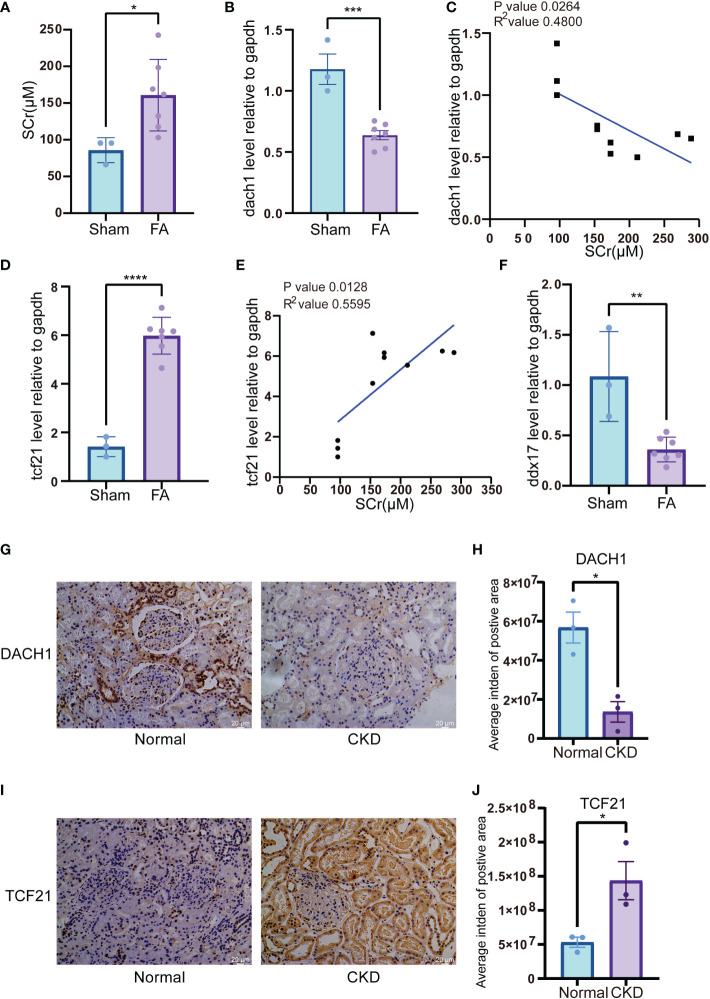
Methods: To dissect the potential important molecules during the progression, based on CKD databases from Gene Expression Omnibus, we used weighted gene co-expression network analysis (WGCNA) to identify the key genes in kidney tissues and peripheral blood mononuclear cells (PBMC). Correlation analysis of these genes with clinical relevance was evaluated based on Nephroseq. Combined with a validation cohort and receiver operating characteristic curve (ROC), we found the candidate biomarkers. The immune cell infiltration of these biomarkers was evaluated. The expression of these biomarkers was further detected in folic acid-induced nephropathy (FAN) murine model and immunohistochemical staining.

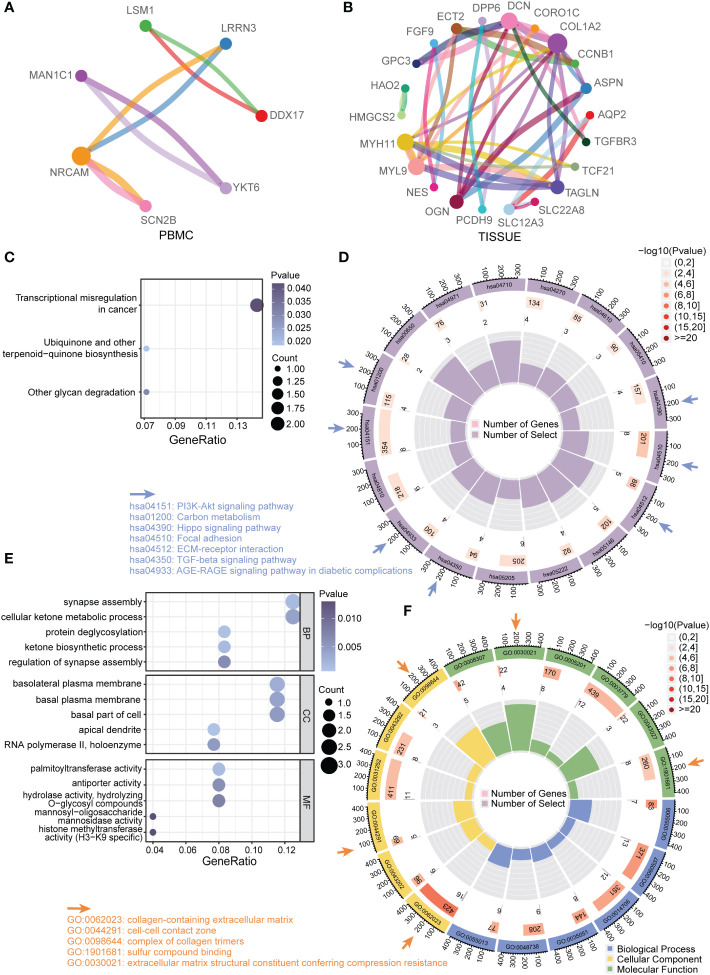
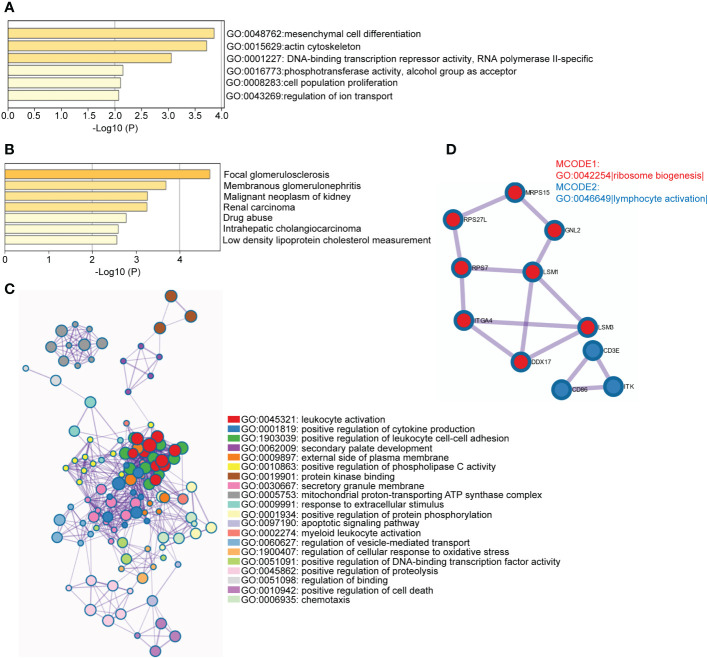
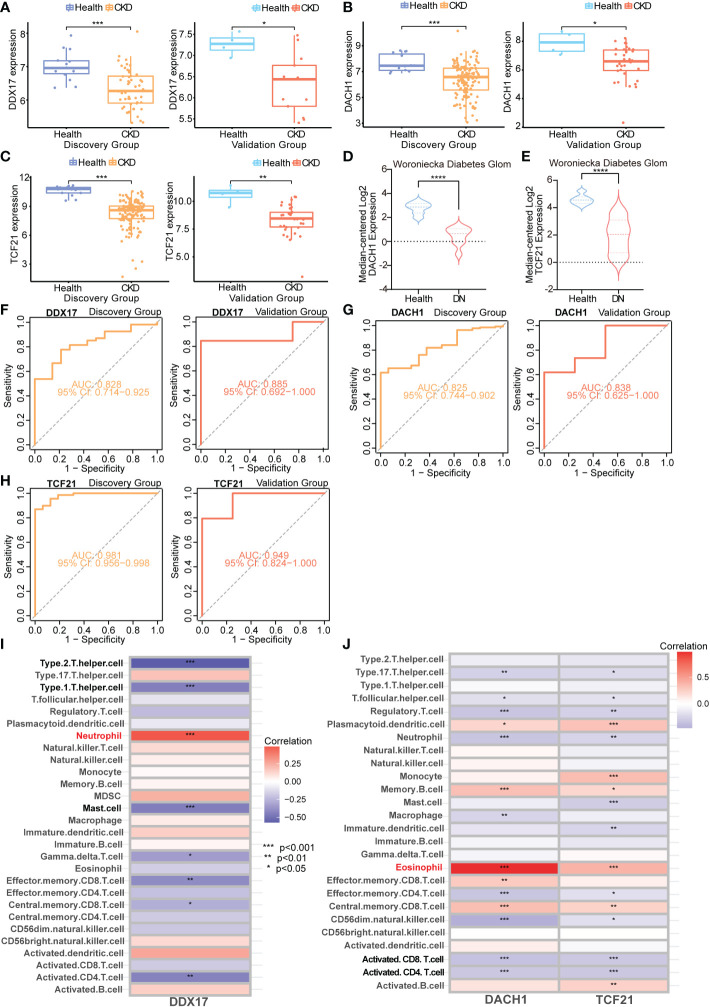
Results: In total, eight genes (CDCP1, CORO1C, DACH1, GSTA4, MAFB, TCF21, TGFBR3, and TGIF1) in kidney tissue and six genes (DDX17, KLF11, MAN1C1, POLR2K, ST14, and TRIM66) in PBMC were screened from co-expression network. Correlation analysis of these genes with serum creatinine levels and estimated glomerular filtration rate from Nephroseq showed a well clinical relevance. Validation cohort and ROC identified TCF21, DACH1 in kidney tissue and DDX17 in PBMC as biomarkers for the progression of CKD. Immune cell infiltration analysis revealed that DACH1 and TCF21 were correlated with eosinophil, activated CD8 T cell, activated CD4 T cell, while the DDX17 was correlated with neutrophil, type-2 T helper cell, type-1 T helper cell, mast cell, etc. FAN murine model and immunohistochemical staining confirmed that these three molecules can be used as genetic biomarkers to distinguish CKD patients from healthy people. Moreover, the increase of TCF21 in kidney tubules might play important role in the CKD progression.

Discussion: We identified three promising genetic biomarkers which could play important roles in the progression of CKD.

Keywords: CKD; DACH1; DDX17; PBMC; TCF21; WGCNA; biomarkers.


Conflict of interest statement

The authors declare that the research was conducted in the absence of any commercial or financial relationships that could be construed as a potential conflict of interest.

Figures

Figure 1
Figure 1
Flowchart to identify chronic kidney disease (CKD) biomarkers, including data extraction, processing and analysis.
Figure 2
Figure 2
Identification of differentially expressed genes (DEGs) in peripheral blood mononuclear cell (PBMC) and TISSUE samples (A) Principal component analysis (PCA) of the GSM datasets. The samples were visualized by scatter plots based on two principal components (PC1 and PC2) of gene expression profiles without (left) or with (right) batch effect removal. Top, PBMC; bottom, TISSUE. (B) Volcano plots of the DEGs. The orange dots meant significantly upregulated genes, and the green dots represented significantly downregulated genes. The grey dots represented non-significantly changed genes. Top, PBMC; bottom, TISSUE. (C) Heatmap showing DEGs in different samples. Left PBMC, Right TISSUE.
Figure 3
Figure 3
Functional enrichment analysis of DEGs (A) Protein–protein interaction (PPI) network of total DEGs from PBMC. Different colors of dots in the circle plot represented different proteins. The connectivity degree was represented by dot size. The edge width was proportional to combined score. (B) PPI network of total DEGs from TISSUE samples. (C) Enriched KEGG pathways among PBMC DEGs. The gene ratio was represented on the horizontal axis. The vertical axis indicated the KEGG signaling pathway terms, and the purple-to-blue gradually changing color indicated the change of significance from low to high. (D) Circular enrichment of KEGG pathways among TISSUE DEGs (hsa04510: Focal adhesion; hsa04512: ECM-receptor interaction; hsa05146: Amoebiasis; hsa05222: Small cell lung cancer; hsa05205: Proteoglycans in cancer; hsa04350: TGF-beta signaling pathway; hsa04933: AGE-RAGE signaling pathway in diabetic complications; hsa04810: Regulation of actin cytoskeleton; hsa04151: PI3K-Akt signaling pathway; hsa01200: Carbon metabolism; hsa00650: Butanoate metabolism; hsa04971: Gastric acid secretion; hsa04710: Circadian rhythm; hsa04270: Vascular smooth muscle contraction; hsa04610: Complement and coagulation cascades; hsa05410: Hypertrophic cardiomyopathy; hsa04390: Hippo signaling pathway). (E) Enriched GO terms among PBMC DEGs. (F) Circular enrichment of GO terms among TISSUE DEGs (GO:0055006: cardiac cell development; GO:0060537: muscle tissue development; GO:0014706: striated muscle tissue development; GO:0035051: cardiocyte differentiation; GO:0048738: cardiac muscle tissue development; GO:0055013: cardiac muscle cell development; GO:0062023: collagen-containing extracellular matrix; GO:0043202: lysosomal lumen; GO:0044291: cell-cell contact zone; GO:0031252: cell leading edge; GO:0043292: contractile fiber; GO:0098644: complex of collagen trimers; GO:0008307: structural constituent of muscle; GO:0030021: extracellular matrix structural constituent conferring compression resistance; GO:0005201: extracellular matrix structural constituent; GO:0003779:actin binding; GO:0043027: cysteine-type endopeptidase inhibitor activity involved in apoptotic process; GO:1901681: sulfur compound binding).
Figure 4
Figure 4
Weighted gene co-expression network analysis (WGCNA) revealing gene co-expression networks in samples from CKD patients (A) WGCNA analysis of PBMC samples. The left dendrogram represented the clusters of differentially expressed genes based on different metrics. Each branch represented one gene, and each color below branches represented one co-expression module. The right heatmap showed the correlation between gene modules and CKD. The correlation coefficient in each cube represented the correlation between gene modules and traits, which decreased from red to blue. (B) WGCNA analysis of TISSUE samples.
Figure 5
Figure 5
Functional enrichment analysis of hub genes in disease-related module (A) Enriched GO terms among TISSUE hub genes. The horizontal axis represented P-value of GO terms in log10 calculated on Metascape by default parameter. (B) Enriched DisGeNET terms among TISSUE hub genes. The horizontal axis represented P-value of GO terms in log10 calculated on Metascape. (C) Network of representative GO terms among PBMC hub genes. The clusters were calculated and visualized with Cytoscape using Metascape online platform by default parameter. The color of the node represented its cluster identity. One GO term from each cluster was selected to be shown as label. (D) Top MCODE terms of PBMC hub genes. All PPI among PBMC hub genes formed a network. The Molecular Complex Detection algorithm (MCODE) was used to identify the connected network components. The network was analyzed by GO enrichment to extract “biological meanings”. One GO term was labelled to represent the MCODE (GO: 0042254: Ribosome biogenesis; GO: 0046649: lymphocyte activation).
Figure 6
Figure 6
Common hub gene selection and least absolute shrinkage and selection operator (LASSO) analysis (A) The common hub genes shared between DEGs and hub genes were visualized in a Venn diagram. Left, PBMC; right, TISSUE. (B) The number of factors was determined by LASSO analysis. The procedure of LASSO Cox model fitting was shown in left panel. One curve represented a gene. The coefficient of each gene against the LC-norm was plotted with the lambda change. L1-norm represented the total absolute value of non-zero coefficients. A coefficient profile generated against the log (lambda) sequence was shown in the right panel. Continuous upright lines were the partial likelihood deviance ± SE; The optimal values and gene symbols were depicted, based on the minimum criteria (lambda.min, left vertical dotted line) and 1-SE criteria (lambda.1se, right vertical dotted line). Top, PBMC; bottom, TISSUE. SE, standard error.
Figure 7
Figure 7
Correlation analysis of TISSUE common hub genes and CKD clinical parameters (A–H) The correlation of TISSUE genetic biomarker mRNA levels with estimated glomerular filtration rate (eGFR) in the Woroniecka Diabetes Glom Cohort (Top) or serum creatinine (SCr) level in the Ju CKD Glom Cohort (Bottom). (A) CDCP1; (B) CORO1C; (C) TGIF1; (D) GSTA4; (E) MAFB; (F) TGFBR3; (G) DACH1; (H) TCF21. Data were extracted from www.nephroseq.org. (I) The gene expression level of common hub genes in the discovery cohort.
Figure 8
Figure 8
Validation and immune infiltration evaluation of CKD biomarkers from different samples (A–C) Box plots representing expression level of CKD genetic biomarkers in the discovery and validation cohorts. (D) mRNA level of DACH1 in the Woroniecka Diabetes Glom Cohort. (E) mRNA level of TCF21 in the Woroniecka Diabetes Glom Cohort. (F–H) Receiver operating characteristic (ROC) curve for the discovery and validation cohorts. (A, F) DDX17 (PBMC); (B, G) DACH1 (TISSUE); (C, H) TCF21 (TISSUE). (I) Correlation heatmap demonstrating the relationship between DDX17 (PBMC) and immune cells infiltration. (J) Correlation heatmap demonstrating the relationship between DACH1 and TCF21 (TISSUE) and immune cells infiltration. *P < 0.05; **P < 0.01; ***P < 0.001; ****P < 0.0001.
Figure 9
Figure 9
Expression of genetic biomarkers in folic acid (FA)-induced CKD murine model and membranous nephropathy (MN) patient’s biopsy (A) SCr level in FA-induced CKD murine model. Blood serum was harvested 3 days after FA injection. (B) mRNA level of dach1 in kidneys from FA-induced CKD murine model. (C) Correlation between dach1 mRNA level in kidney tissue and SCr from FA-induced CKD murine model. (D) mRNA level of tcf21 in kidney tissues from FA-induced CKD murine model. (E) Correlation between tcf21 mRNA level in kidney tissues and SCr from FA-induced CKD murine model. (F) mRNA level of ddx17 in PBMC from FA-induced CKD murine model. (G) IHC staining of DACH1 in normal kidney tissues and CKD tissues. The representative pictures of CKD were from the membranous nephropathy (MN) patient’s biopsy. (H) Quantitative results of DACH1 expression in panel (G). The expression level was calculated by average integrated density (Intden) of positive area. (I) IHC staining of TCF21 in normal kidney tissues and CKD tissues. (J) Quantitative results of TCF21 expression in (I). *P < 0.05; **P < 0.01; ***P < 0.001; ****P < 0.0001.

Similar articles

Cited by

References

    1. Romagnani P, Remuzzi G, Glassock R, Levin A, Jager KJ, Tonelli M, et al. . Chronic kidney disease. Nat Rev Dis Primers (2017) 3:17088. doi: 10.1038/nrdp.2017.88 - DOI - PubMed
    1. Webster AC, Nagler EV, Morton RL, Masson P. Chronic kidney disease. Lancet (Lond Engl) (2017) 389(10075):1238–52. doi: 10.1016/S0140-6736(16)32064-5 - DOI - PubMed
    1. Inrig JK, Califf RM, Tasneem A, Vegunta RK, Molina C, Stanifer JW, et al. . The landscape of clinical trials in nephrology: a systematic review of clinicaltrials.gov. Am J Kidney Dis (2014) 63(5):771–80. doi: 10.1053/j.ajkd.2013.10.043 - DOI - PMC - PubMed
    1. O’Seaghdha CM, Fox CS. Genome-wide association studies of chronic kidney disease: what have we learned? Nat Rev Nephrol (2011) 8(2):89–99. doi: 10.1038/nrneph.2011.189 - DOI - PMC - PubMed
    1. Ou SM, Tsai MT, Chen HY, Li FA, Tseng WC, Lee KH, et al. . Identification of galectin-3 as potential biomarkers for renal fibrosis by RNA-sequencing and clinicopathologic findings of kidney biopsy. Front Med (2021) 8:748225. doi: 10.3389/fmed.2021.748225 - DOI - PMC - PubMed

Publication types