

Immune-related risk score: An immune-cell-pair-based prognostic model for cutaneous melanoma
- PMID: 36875110
- PMCID: PMC9975150
- DOI: 10.3389/fimmu.2023.1112181
Immune-related risk score: An immune-cell-pair-based prognostic model for cutaneous melanoma
Abstract
Background: Melanoma is among the most malignant immunologic tumor types and is associated with high mortality. However, a considerable number of melanoma patients cannot benefit from immunotherapy owing to individual differences. This study attempts to build a novel prediction model of melanoma that fully considers individual differences in the tumor microenvironment.
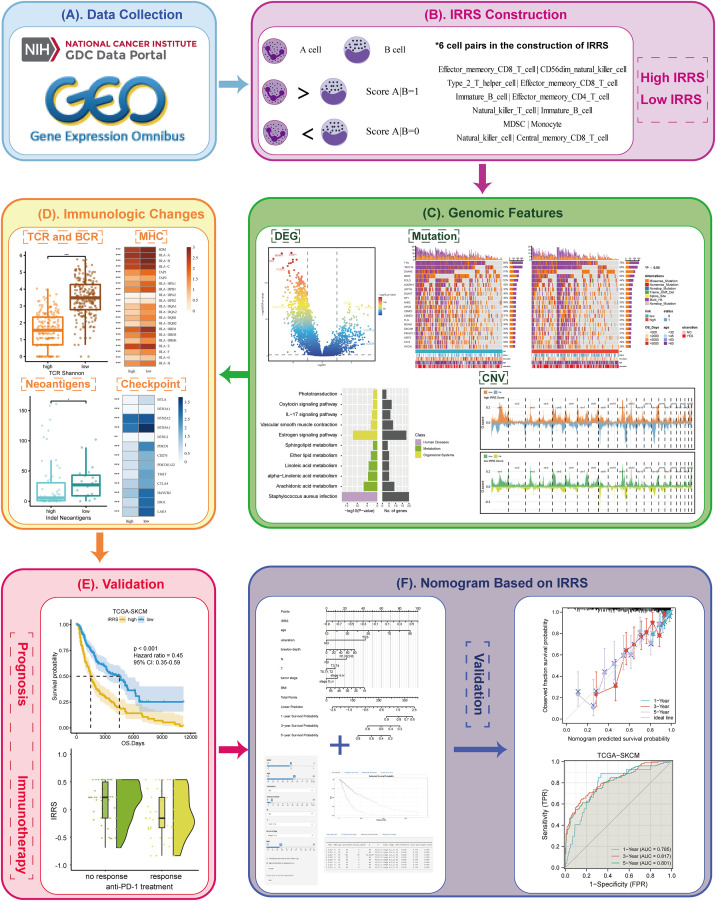
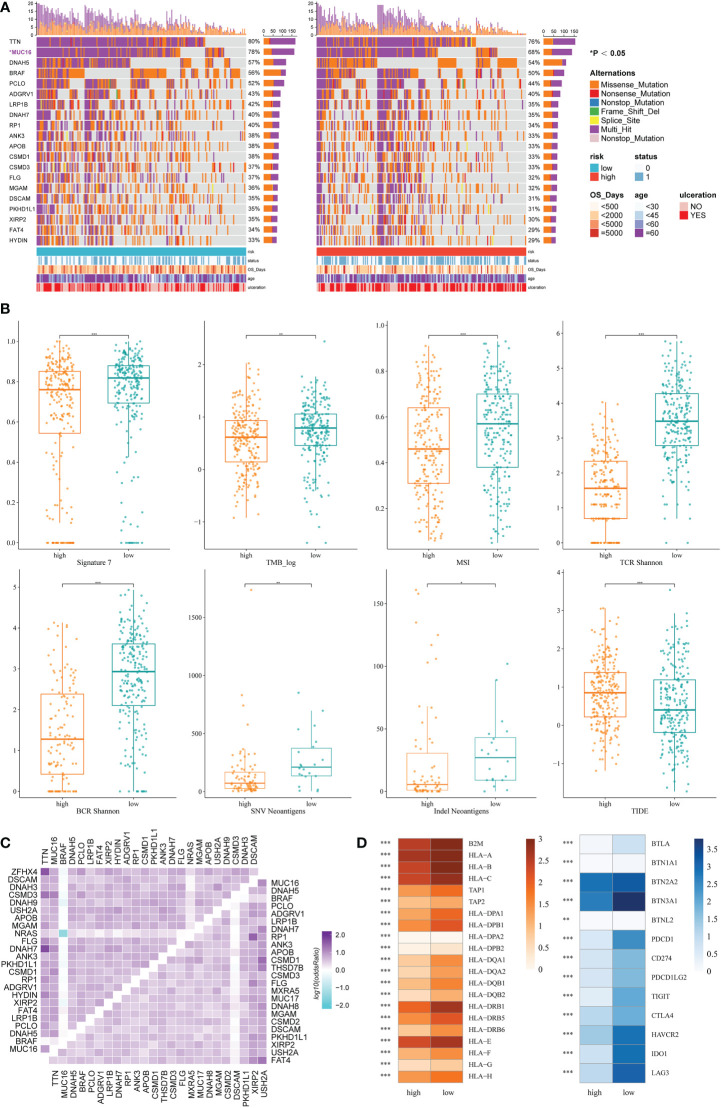
Methods: An immune-related risk score (IRRS) was constructed based on cutaneous melanoma data from The Cancer Genome Atlas (TCGA). Single-sample gene set enrichment analysis (ssGSEA) was used to calculate immune enrichment scores of 28 immune cell signatures. We performed pairwise comparisons to obtain scores for cell pairs based on the difference in the abundance of immune cells within each sample. The resulting cell pair scores, in the form of a matrix of relative values of immune cells, formed the core of the IRRS.
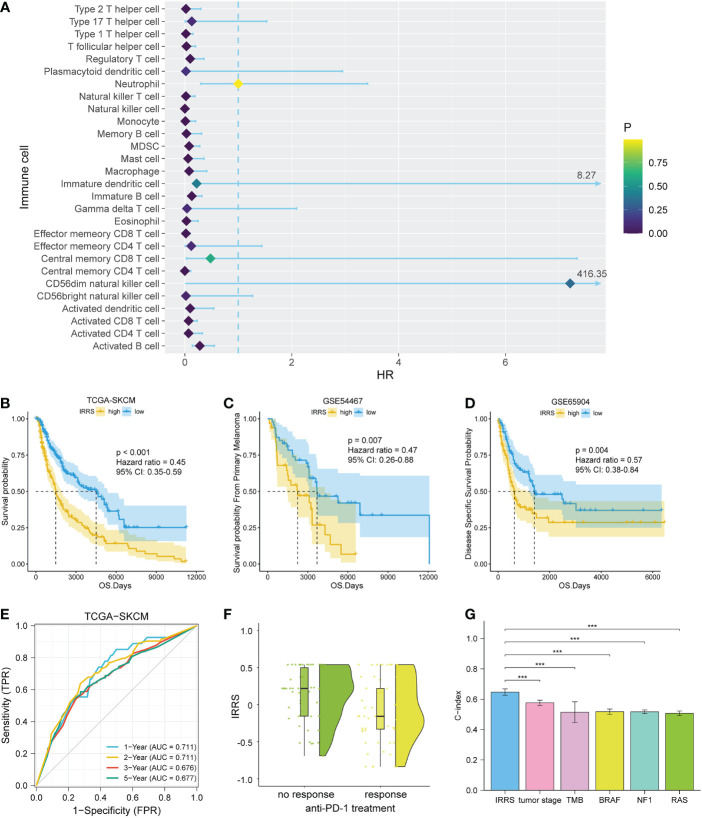
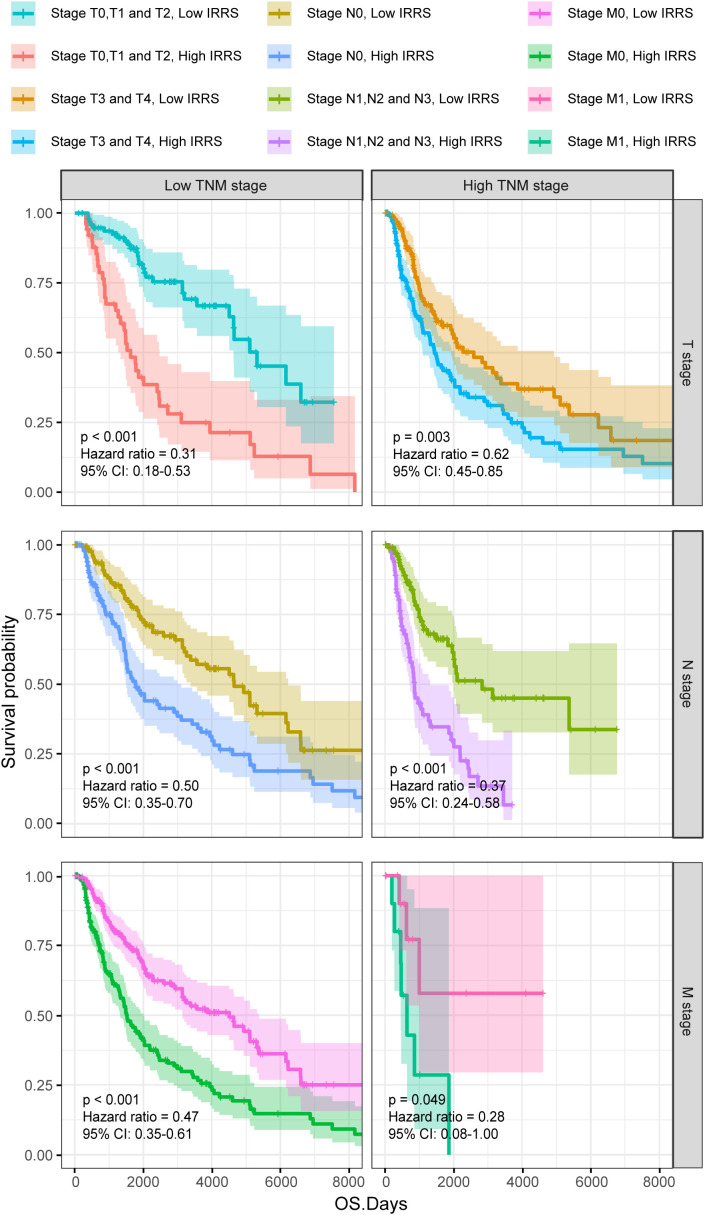
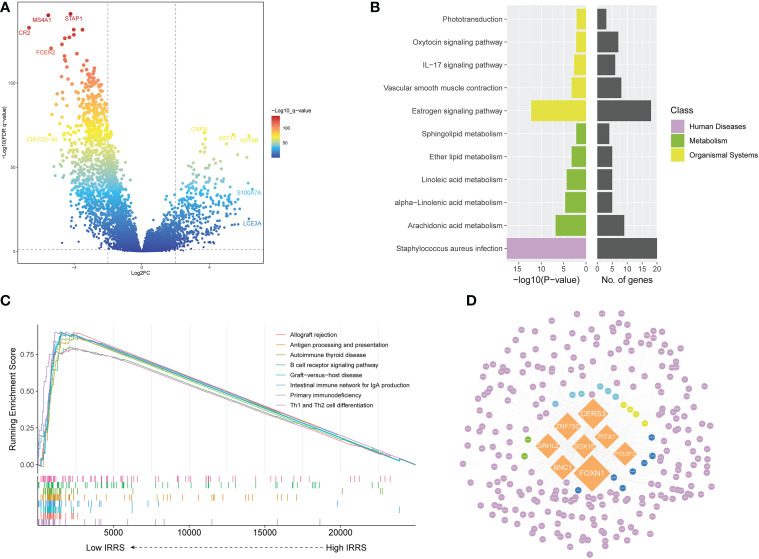
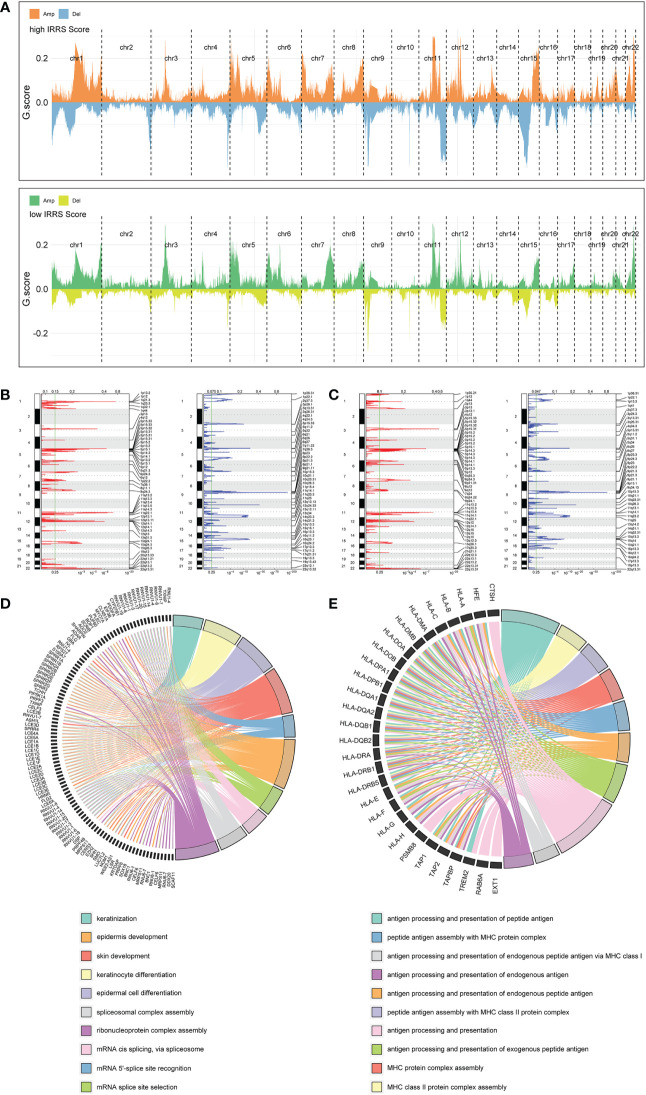
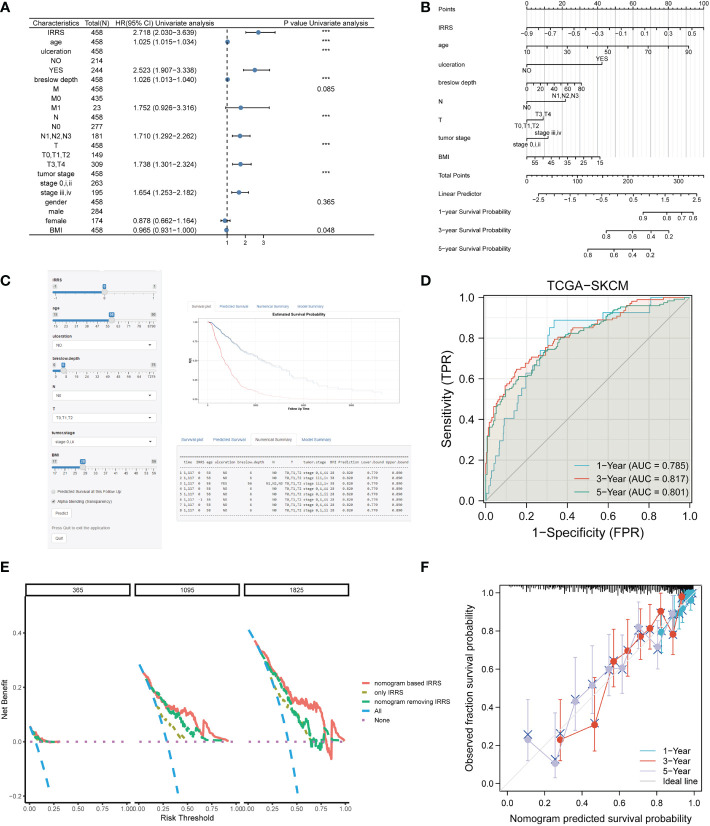
Results: The area under the curve (AUC) for the IRRS was over 0.700, and when the IRRS was combined with clinical information, the AUC reached 0.785, 0.817, and 0.801 for the 1-, 3-, and 5-year survival, respectively. Differentially expressed genes between the two groups were enriched in staphylococcal infection and estrogen metabolism pathway. The low IRRS group showed a better immunotherapeutic response and exhibited more neoantigens, richer T-cell receptor and B-cell receptor diversity, and higher tumor mutation burden.
Conclusion: The IRRS enables a good prediction of prognosis and immunotherapy effect, based on the difference in the relative abundance of different types of infiltrating immune cells, and could provide support for further research in melanoma.
Keywords: cell pair; cutaneous melanoma; immunotherapy response; prognosis model; tumor infiltrating immune cell.
Copyright © 2023 Li, Long, Bu, Zhang, Deng, Liu, Su and Huang.
Conflict of interest statement
The authors declare that the research was conducted in the absence of any commercial or financial relationships that could be construed as a potential conflict of interest. The reviewer MP declared a shared affiliation with the authors ML, XL, GZ, GD, YL, JS and KH to the handling editor at time of review.
Figures
Similar articles
-
Development and validation of an immune gene set-based prognostic signature in cutaneous melanoma.Future Oncol. 2021 Nov;17(31):4115-4129. doi: 10.2217/fon-2021-0104. Epub 2021 Jul 22. Future Oncol. 2021. PMID: 34291650
-
Gene expression and immune infiltration in melanoma patients with different mutation burden.BMC Cancer. 2021 Apr 9;21(1):379. doi: 10.1186/s12885-021-08083-1. BMC Cancer. 2021. PMID: 33836680 Free PMC article.
-
Pan-Cancer Analysis of Immune Cell Infiltration Identifies a Prognostic Immune-Cell Characteristic Score (ICCS) in Lung Adenocarcinoma.Front Immunol. 2020 Jun 30;11:1218. doi: 10.3389/fimmu.2020.01218. eCollection 2020. Front Immunol. 2020. PMID: 32714316 Free PMC article.
-
Analysis of immunotherapeutic response-related signatures in esophageal squamous-cell carcinoma.Front Immunol. 2023 Feb 2;14:1117658. doi: 10.3389/fimmu.2023.1117658. eCollection 2023. Front Immunol. 2023. PMID: 36817484 Free PMC article.
-
Development of an IFNγ response-related signature for predicting the survival of cutaneous melanoma.Cancer Med. 2020 Nov;9(21):8186-8201. doi: 10.1002/cam4.3438. Epub 2020 Sep 9. Cancer Med. 2020. PMID: 32902917 Free PMC article.
Cited by
-
T cell-related ubiquitination genes as prognostic indicators in hepatocellular carcinoma.Front Immunol. 2024 Jun 11;15:1424752. doi: 10.3389/fimmu.2024.1424752. eCollection 2024. Front Immunol. 2024. PMID: 38919610 Free PMC article.
-
Numb and NumbL inhibit melanoma tumor growth by influencing the immune microenvironment.BMC Cancer. 2024 Nov 18;24(1):1419. doi: 10.1186/s12885-024-13191-9. BMC Cancer. 2024. PMID: 39558287 Free PMC article.
-
Development and validation of an immune signature-based risk model for prognostic assessment in melanoma.Sci Rep. 2025 Mar 17;15(1):9117. doi: 10.1038/s41598-025-90917-0. Sci Rep. 2025. PMID: 40097490 Free PMC article.
-
Comprehensive analysis of single cell and bulk RNA sequencing reveals the heterogeneity of melanoma tumor microenvironment and predicts the response of immunotherapy.Inflamm Res. 2024 Aug;73(8):1393-1409. doi: 10.1007/s00011-024-01905-5. Epub 2024 Jun 19. Inflamm Res. 2024. PMID: 38896289
References
Publication types
MeSH terms
LinkOut - more resources
Full Text Sources
Medical