

Obesity- and lipid-related indices as a predictor of obesity metabolic syndrome in a national cohort study
- PMID: 36875382
- PMCID: PMC9980350
- DOI: 10.3389/fpubh.2023.1073824
Obesity- and lipid-related indices as a predictor of obesity metabolic syndrome in a national cohort study
Abstract
Objective: Metabolic syndrome is a common condition among middle-aged and elderly people. Recent studies have reported the association between obesity- and lipid-related indices and metabolic syndrome, but whether those conditions could predict metabolic syndrome is still inconsistent in a few longitudinal studies. In our study, we aimed to predict metabolic syndrome by obesity- and lipid-related indices in middle-aged and elderly Chinese adults.
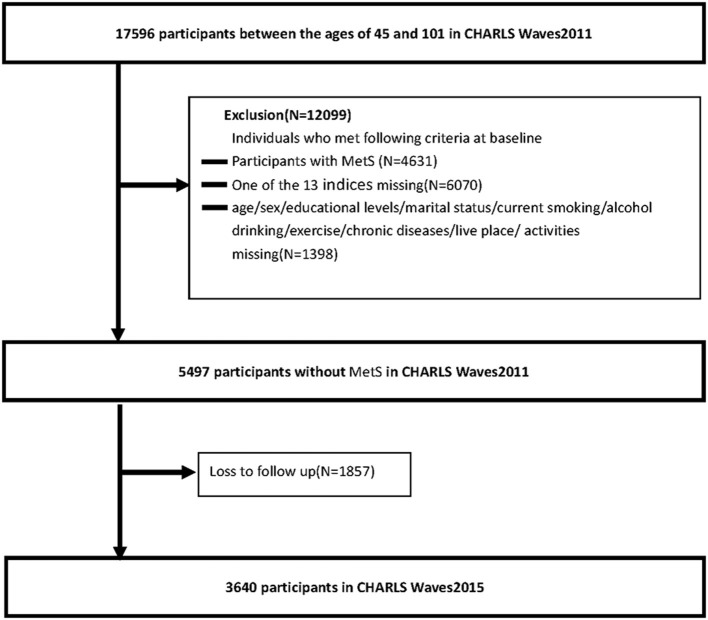
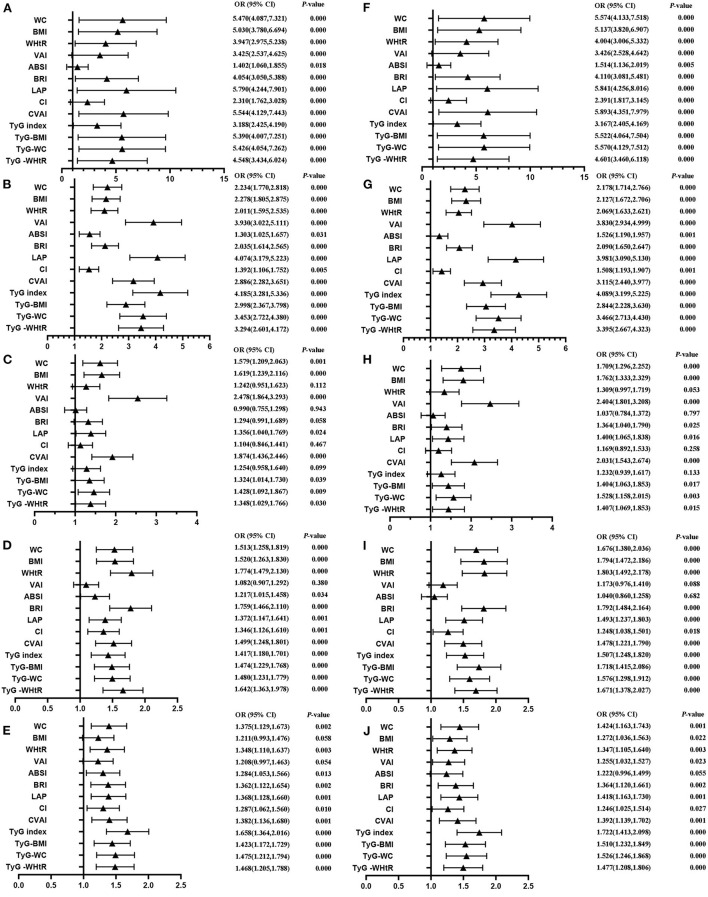
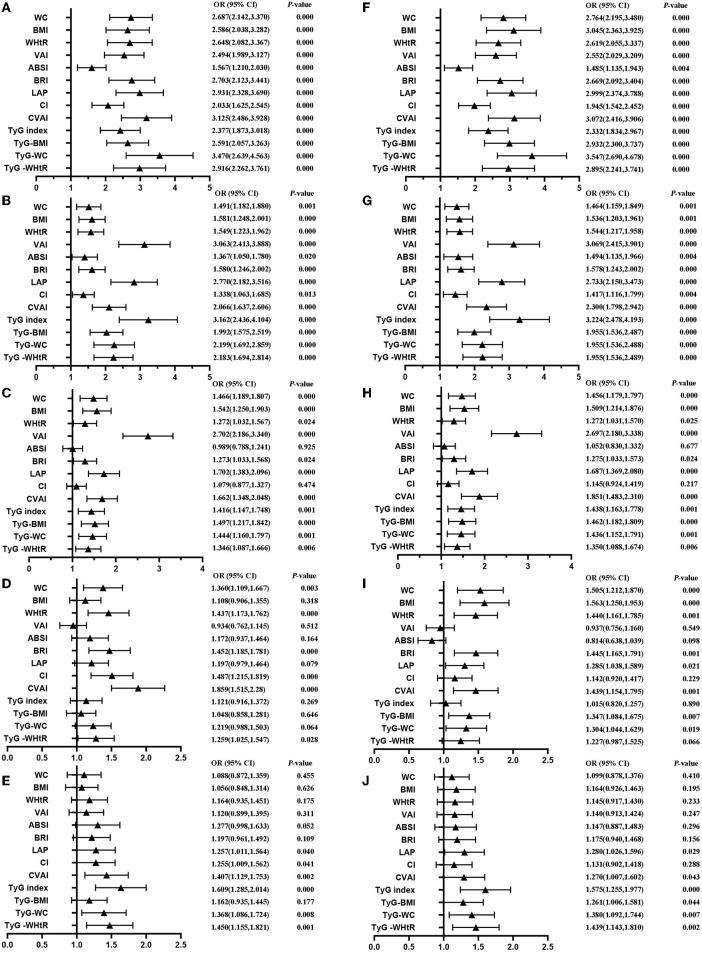
Method: A national cohort study that consisted of 3,640 adults (≥45 years) was conducted. A total of 13 obesity- and lipid-related indices, including body mass index (BMI), waist circumference (WC), waist-to-height ratio (WHtR), conicity index (CI), visceral adiposity index (VAI), Chinese visceral adiposity index (CVAI), lipid accumulation product (LAP), a body shape index (ABSI), body roundness index (BRI), and triglyceride glucose index (TyG-index) and its correlation index (TyG-BMI, TyG-WC, and TyG-WHtR), were recorded. Metabolic syndrome (MetS) was defined based on the criteria of the National Cholesterol Education Program Adult Treatment Panel III (2005). Participants were categorized into two groups according to the different sex. Binary logistic regression analyses were used to evaluate the associations between the 13 obesity- and lipid-related indices and MetS. Receiver operating characteristic (ROC) curve studies were used to identify the best predictor of MetS.
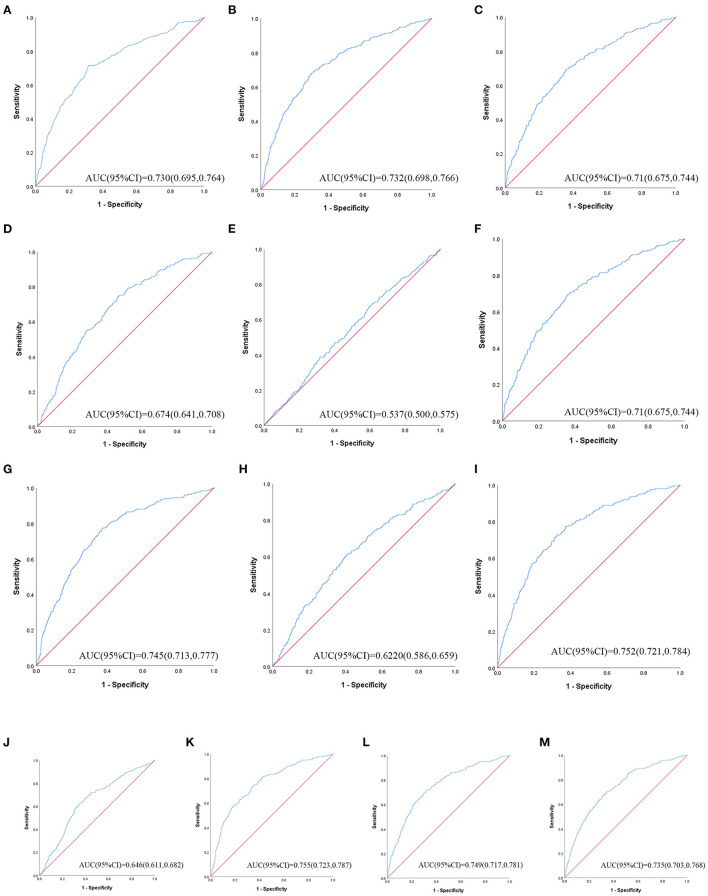
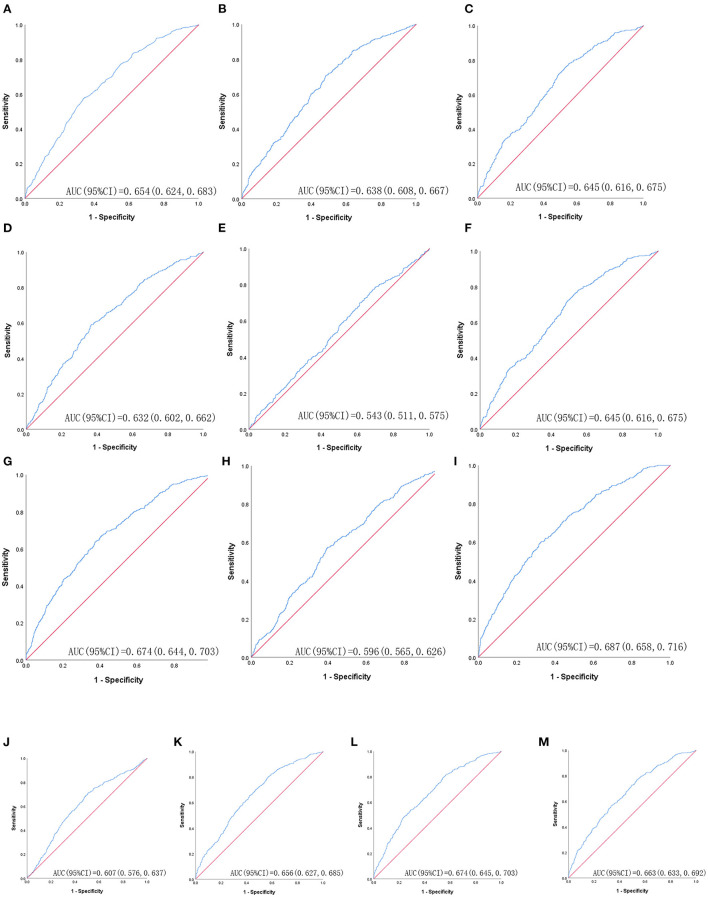
Results: A total of 13 obesity- and lipid-related indices were independently associated with MetS risk, even after adjustment for age, sex, educational status, marital status, current residence, history of drinking, history of smoking, taking activities, having regular exercises, and chronic diseases. The ROC analysis revealed that the 12 obesity- and lipid-related indices included in the study were able to discriminate MetS [area under the ROC curves (AUC > 0.6, P < 0.05)] and ABSI was not able to discriminate MetS [area under the ROC curves (AUC < 0.6, P > 0.05)]. The AUC of TyG-BMI was the highest in men, and that of CVAI was the highest in women. The cutoff values for men and women were 187.919 and 86.785, respectively. The AUCs of TyG-BMI, CVAI, TyG-WC, LAP, TyG-WHtR, BMI, WC, WHtR, BRI, VAI, TyG index, CI, and ABSI were 0.755, 0.752, 0.749, 0.745, 0.735, 0.732, 0.730, 0.710, 0.710, 0.674, 0.646, 0.622, and 0.537 for men, respectively. The AUCs of CVAI, LAP, TyG-WC, TyG-WHtR, TyG-BMI, WC, WHtR, BRI, BMI, VAI, TyG-index, CI, and ABSI were 0.687, 0.674, 0.674, 0.663, 0.656, 0.654, 0.645, 0.645, 0.638, 0.632, 0.607, 0.596, and 0.543 for women, respectively. The AUC value for WHtR was equal to that for BRI in predicting MetS. The AUC value for LAP was equal to that for TyG-WC in predicting MetS for women.
Conclusion: Among middle-aged and older adults, all obesity- and lipid-related indices, except ABSI, were able to predict MetS. In addition, in men, TyG-BMI is the best indicator to indicate MetS, and in women, CVAI is considered the best hand to indicate MetS. At the same time, TyG-BMI, TyG-WC, and TyG-WHtR performed better than BMI, WC, and WHtR in predicting MetS in both men and women. Therefore, the lipid-related index outperforms the obesity-related index in predicting MetS. In addition to CVAI, LAP showed a good predictive correlation, even more closely than lipid-related factors in predicting MetS in women. It is worth noting that ABSI performed poorly, was not statistically significant in either men or women, and was not predictive of MetS.
Keywords: lipids; metabolic syndrome; middle-aged and elderly Chinese; national cohort study; obesity.
Copyright © 2023 Gui, Li, Liu, Guo, Li, Lei, Li, Sun, Yang, Yuan, Wang, Zhang, Wei, Li, Liu, Hua and Zhang.
Conflict of interest statement
The authors declare that the research was conducted in the absence of any commercial or financial relationships that could be construed as a potential conflict of interest.
Figures
Similar articles
-
Comparison of visceral, general and central obesity indices in the prediction of metabolic syndrome in maintenance hemodialysis patients.Eat Weight Disord. 2020 Jun;25(3):727-734. doi: 10.1007/s40519-019-00678-9. Epub 2019 Apr 9. Eat Weight Disord. 2020. PMID: 30968371
-
Predicting metabolic syndrome by obesity- and lipid-related indices in mid-aged and elderly Chinese: a population-based cross-sectional study.Front Endocrinol (Lausanne). 2023 Jul 28;14:1201132. doi: 10.3389/fendo.2023.1201132. eCollection 2023. Front Endocrinol (Lausanne). 2023. PMID: 37576971 Free PMC article.
-
Predicting hypertension by obesity- and lipid-related indices in mid-aged and elderly Chinese: a nationwide cohort study from the China Health and Retirement Longitudinal Study.BMC Cardiovasc Disord. 2023 Apr 20;23(1):201. doi: 10.1186/s12872-023-03232-9. BMC Cardiovasc Disord. 2023. PMID: 37081416 Free PMC article.
-
Effectiveness of body roundness index in predicting metabolic syndrome: A systematic review and meta-analysis.Obes Rev. 2020 Jul;21(7):e13023. doi: 10.1111/obr.13023. Epub 2020 Apr 8. Obes Rev. 2020. PMID: 32267621
-
Gender-specific accuracy of lipid accumulation product index for the screening of metabolic syndrome in general adults: a meta-analysis and comparative analysis with other adiposity indicators.Lipids Health Dis. 2024 Jun 26;23(1):198. doi: 10.1186/s12944-024-02190-1. Lipids Health Dis. 2024. PMID: 38926783 Free PMC article.
Cited by
-
Comparison of obesity indicators for predicting cardiovascular risk factors and multimorbidity among the Chinese population based on ROC analysis.Sci Rep. 2024 Sep 9;14(1):20942. doi: 10.1038/s41598-024-71914-1. Sci Rep. 2024. PMID: 39251694 Free PMC article.
-
The impact of triglyceride glucose-body mass index on all-cause and cardiovascular mortality in elderly patients with diabetes mellitus: evidence from NHANES 2007-2016.BMC Geriatr. 2024 Apr 22;24(1):356. doi: 10.1186/s12877-024-04992-5. BMC Geriatr. 2024. PMID: 38649828 Free PMC article.
-
Stress-induced hyperglycemia is associated with the mortality of thrombotic thrombocytopenic purpura patients.Diabetol Metab Syndr. 2024 Feb 15;16(1):44. doi: 10.1186/s13098-024-01275-2. Diabetol Metab Syndr. 2024. PMID: 38360738 Free PMC article.
-
Association Between a Body Shape Index and Body Roundness Index with Prevalence of Psoriasis: A Cross-Sectional Population-Based Study.Clin Cosmet Investig Dermatol. 2025 Mar 18;18:627-638. doi: 10.2147/CCID.S512864. eCollection 2025. Clin Cosmet Investig Dermatol. 2025. PMID: 40124931 Free PMC article.
-
Association between visceral adiposity index and sleep disorders among the U.S. adults: a cross-sectional study.Front Neurol. 2025 May 9;16:1540182. doi: 10.3389/fneur.2025.1540182. eCollection 2025. Front Neurol. 2025. PMID: 40417111 Free PMC article.
References
Publication types
MeSH terms
Substances
Grants and funding
LinkOut - more resources
Full Text Sources
Medical
Research Materials