

Estimation of the number of heat illness patients in eight metropolitan prefectures of Japan: Correlation with ambient temperature and computed thermophysiological responses
- PMID: 36875384
- PMCID: PMC9982159
- DOI: 10.3389/fpubh.2023.1061135
Estimation of the number of heat illness patients in eight metropolitan prefectures of Japan: Correlation with ambient temperature and computed thermophysiological responses
Abstract
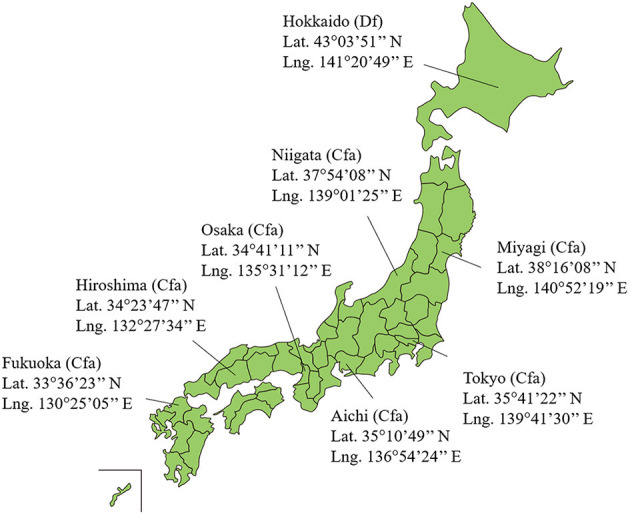
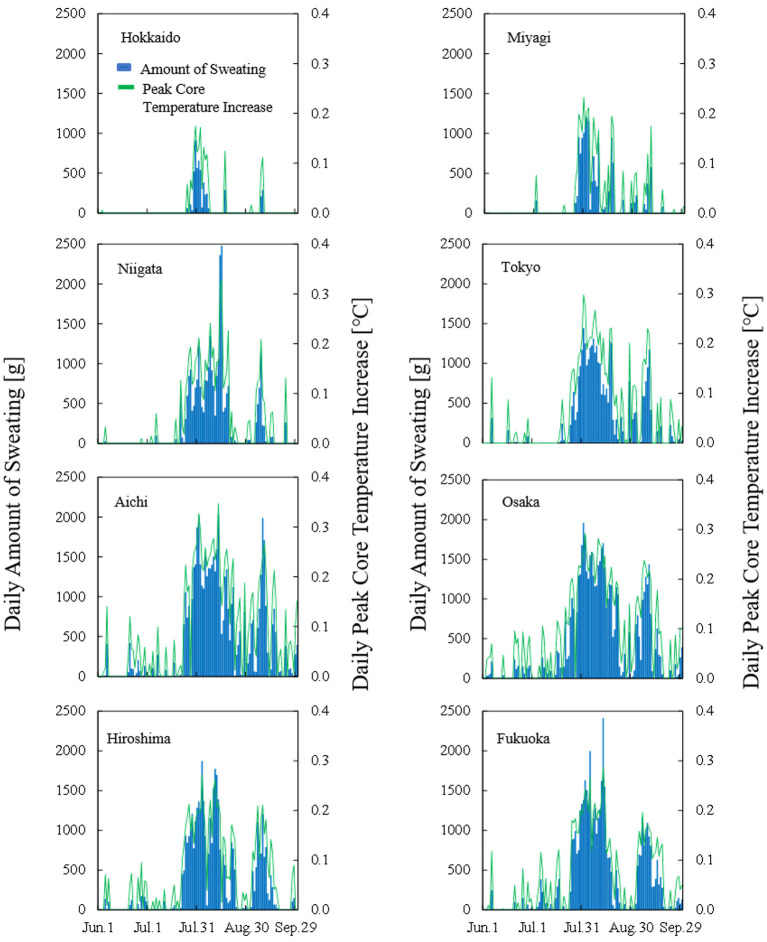
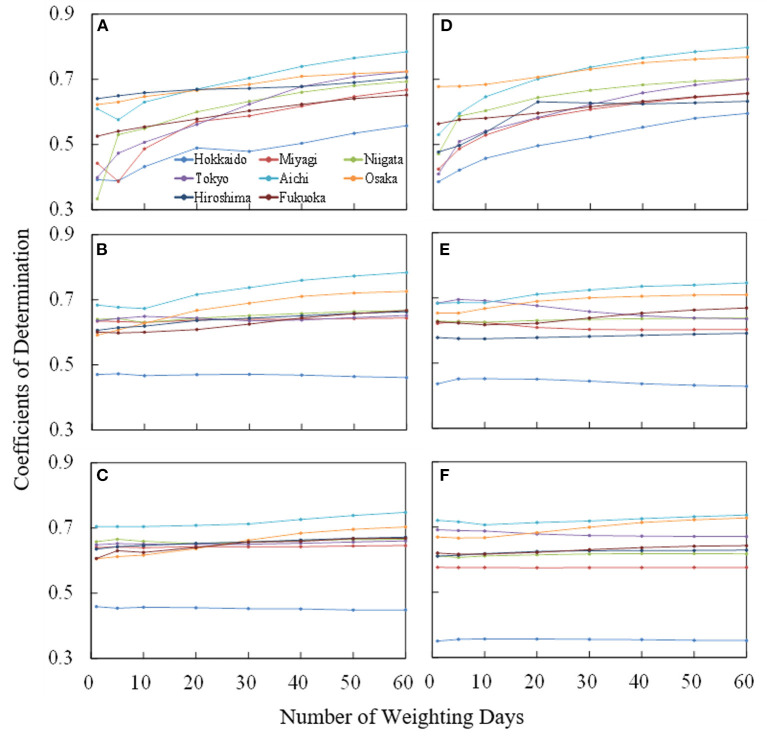
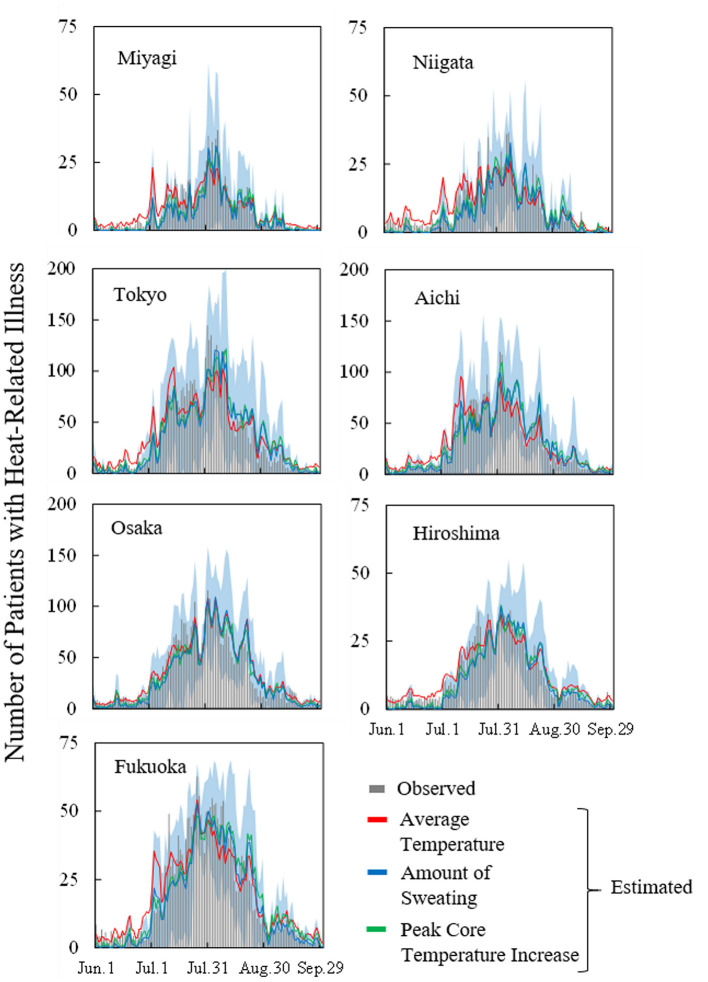
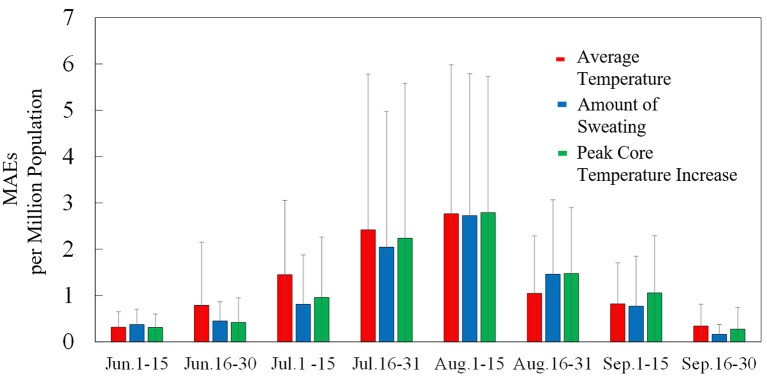
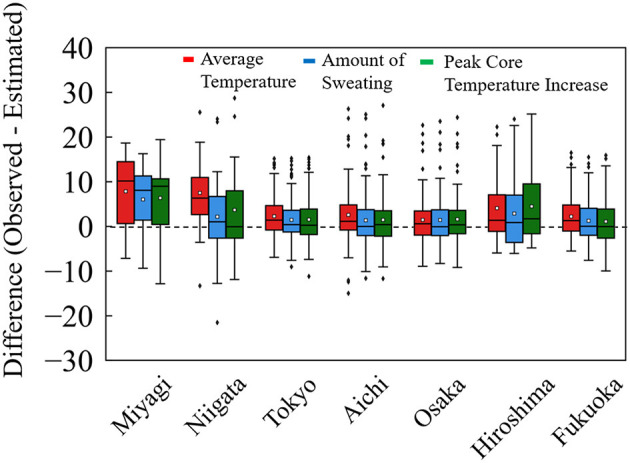
The number of patients with heat illness transported by ambulance has been gradually increasing due to global warming. In intense heat waves, it is crucial to accurately estimate the number of cases with heat illness for management of medical resources. Ambient temperature is an essential factor with respect to the number of patients with heat illness, although thermophysiological response is a more relevant factor with respect to causing symptoms. In this study, we computed daily maximum core temperature increase and daily total amount of sweating in a test subject using a large-scale, integrated computational method considering the time course of actual ambient conditions as input. The correlation between the number of transported people and their thermophysiological temperature is evaluated in addition to conventional ambient temperature. With the exception of one prefecture, which features a different Köppen climate classification, the number of transported people in the remaining prefectures, with a Köppen climate classification of Cfa, are well estimated using either ambient temperature or computed core temperature increase and daily amount of sweating. For estimation using ambient temperature, an additional two parameters were needed to obtain comparable accuracy. Even using ambient temperature, the number of transported people can be estimated if the parameters are carefully chosen. This finding is practically useful for the management of ambulance allocation on hot days as well as public enlightenment.
Keywords: ambient heat; ambulance dispatch; global warming; heat adaptation; heat illness.
Copyright © 2023 Takada, Kodera, Suzuki, Nemoto, Egawa, Takizawa and Hirata.
Conflict of interest statement
The authors declare that the research was conducted in the absence of any commercial or financial relationships that could be construed as a potential conflict of interest.
Figures
Similar articles
-
Projection of future heat-related morbidity in three metropolitan prefectures of Japan based on large ensemble simulations of climate change under 2 °C global warming scenarios.Environ Res. 2024 Apr 15;247:118202. doi: 10.1016/j.envres.2024.118202. Epub 2024 Jan 13. Environ Res. 2024. PMID: 38224937
-
Estimation of heat-related morbidity from weather data: A computational study in three prefectures of Japan over 2013-2018.Environ Int. 2019 Sep;130:104907. doi: 10.1016/j.envint.2019.104907. Epub 2019 Jun 13. Environ Int. 2019. PMID: 31203028
-
Investigating age and regional effects on the relation between the incidence of heat-related ambulance transport and daily maximum temperature or WBGT.Environ Health Prev Med. 2021 Dec 10;26(1):116. doi: 10.1186/s12199-021-01034-z. Environ Health Prev Med. 2021. PMID: 34893022 Free PMC article.
-
How humans adapt to hot climates learned from the recent research on tropical indigenes.J Physiol Anthropol. 2022 Jul 14;41(1):27. doi: 10.1186/s40101-022-00302-3. J Physiol Anthropol. 2022. PMID: 35836266 Free PMC article. Review.
-
The potential impacts of climate variability and change on temperature-related morbidity and mortality in the United States.Environ Health Perspect. 2001 May;109 Suppl 2(Suppl 2):185-9. doi: 10.1289/ehp.109-1240665. Environ Health Perspect. 2001. PMID: 11359685 Free PMC article. Review.
Cited by
-
Understanding EMS response times: a machine learning-based analysis.BMC Med Inform Decis Mak. 2025 Mar 24;25(1):143. doi: 10.1186/s12911-025-02975-z. BMC Med Inform Decis Mak. 2025. PMID: 40128718 Free PMC article.
References
-
- Fischer EM, Schär C. Future changes in daily summer temperature variability: driving processes and role for temperature extremes. Clim Dyn. (2008) 33:917. 10.1007/s00382-008-0473-8 - DOI
-
- Seneviratne S, Nicholls N, Easterling D, Goodess C, Kanae S, Kossin J, et al. . Changes in climate extremes and their impacts on the natural physical environment. In:Field C, Barros V, Stocker T, Dahe Q, editors. Managing the Risks of Extreme Events and Disasters to Advance Climate Change Adaptation: Special Report of the Intergovernmental Panel on Climate Change. Cambridge: Cambridge University Press; (2012). p. 109–230. 10.1017/CBO9781139177245.006 - DOI
Publication types
MeSH terms
LinkOut - more resources
Full Text Sources
Medical