. 2023 Feb 16:11:1039182.
doi: 10.3389/fcell.2023.1039182. eCollection 2023.

Generation and characterization of NGLY1 patient-derived midbrain organoids

Affiliations

Generation and characterization of NGLY1 patient-derived midbrain organoids

Joshua Abbott et al. Front Cell Dev Biol. .

Abstract

NGLY1 deficiency is an ultra-rare, autosomal recessive genetic disease caused by mutations in the NGLY1 gene encoding N-glycanase one that removes N-linked glycan. Patients with pathogenic mutations in NGLY1 have complex clinical symptoms including global developmental delay, motor disorder and liver dysfunction. To better understand the disease pathogenesis and the neurological symptoms of the NGLY1 deficiency we generated and characterized midbrain organoids using patient-derived iPSCs from two patients with distinct disease-causing mutations-one homozygous for p. Q208X, the other compound heterozygous for p. L318P and p. R390P and CRISPR generated NGLY1 knockout iPSCs. We demonstrate that NGLY1 deficient midbrain organoids show altered neuronal development compared to one wild type (WT) organoid. Both neuronal (TUJ1) and astrocytic glial fibrillary acid protein markers were reduced in NGLY1 patient-derived midbrain organoids along with neurotransmitter GABA. Interestingly, staining for dopaminergic neuronal marker, tyrosine hydroxylase, revealed a significant reduction in patient iPSC derived organoids. These results provide a relevant NGLY1 disease model to investigate disease mechanisms and evaluate therapeutics for treatments of NGLY1 deficiency.

Keywords: GABA; GFAP; NGLY1; dopaminergic neurons; midbrain organoids.


Conflict of interest statement

Author TY was employed by NeuroScience Associates Inc. Authors KB and SR were employed by Travere Therapeutics. Author HNN was employed by 3Dnamics Inc. The remaining authors declare that the research was conducted in the absence of any commercial or financial relationships that could be construed as a potential conflict of interest.

Figures
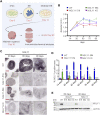
FIGURE 1
FIGURE 1
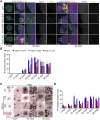
NGLY1 disease midbrain organoids do not express NGLY1 protein. (A) A schematic showing the different stages of midbrain organoid development. (B) A graph showing changes in midbrain organoid size, presented as diameter (mm) through development and maturation. (C) Representative images using brightfield microscopy for midbrain organoids stained with antibody against NGLY1 at different timepoints (45, 60 and 90 days). Scale bars: 500 µM. (D) Graph showing percent total NGLY1 positive signal in different organoids at different timepoints. (E) A representative western blot showing NGLY1 expression in cell lysates obtained from control and NGLY1 disease midbrain organoids. Statistical significance determined by multiple t-test analysis denoted by * = (p ≤ 0.05), ** = (p ≤ 0.01), *** = (p ≤ 0.001), **** = (p ≤ 0.0001).
FIGURE 2
FIGURE 2
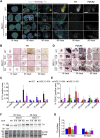
Development and health of organoids as determined by βIII Tubulin (TUJ1) and Caspase3 (CAS) staining in wild type (WT), mutant (NGLY1-519 and NGLY1-594) and knockout (NGLY1 KO) midbrain organoids. (A) Immunofluorescence images at ×5 and ×20 magnification showing DAPI (cyan), TUJ1 (magenta) and CAS (yellow) staining in each line. At 30 days the mutant and KO lines develop a distinct TUJ1 staining pattern relative to the WT, with significantly less density at the edge of the organoid. Scale bars: 125 μm (5x), 25 μm (20x). White dashed line boxes indicate regions of magnification. (B) Quantification of the total TUJ1-positive area in each line at each time point. Bar graph shows the percent of the total tissue area of each line that was positive for TUJ1. Time points where the percentage of TUJ1-positive area in WT organoids was close to zero were excluded. (C) Immunohistochemistry images at ×4 and ×40 magnification showing CAS staining in each organoid line. As organoids grow in size, regions of intense CAS staining develop at the center of the wild type and mutant lines. Scale bars: 250 μm (4x), 25 μm (40x). Red boxes indicate regions of magnification. (D) Quantification of the total CAS-positive area in each line at each time point. Bar graph shows the percent of the total tissue area of each line that was positive for CAS. Data representative of all slices derived from three midbrain organoids. Statistical significance determined by multiple t-test analysis denoted by * = (p ≤ 0.05), ** = (p ≤ 0.01), *** = (p ≤ 0.001), **** = (p ≤ 0.0001).
FIGURE 3
FIGURE 3
Expression of neuronal markers tyrosine hydroxylase (TH) and FOXA2 in midbrain organoids. (A) Representative immunofluorescence images at ×5 and ×20 magnification showing DAPI (cyan), FOXA2 (magenta) and TH (yellow). Scale bars: 250um (5x) and 50um (20x), white boxes indicate zoomed in region. (B) Representative bright field images of TH immunohistochemistry staining at ×4 and ×20 magnification. Scale bars: 250um (4x) and 50um (20x), black boxes indicate zoomed in region. (C) Quantification of total percent positive TH staining. (D) Representative bright field images of FOXA2 immunohistochemistry staining at ×4 and ×20 magnification. Scale bars: 250um (4x) and 50um (20x), red boxes indicate zoomed in region. (E) Quantification of total percent positive FOXA2 staining. (F) A representative western blot showing TH expression in cell lysates obtained from control and NGLY1 disease midbrain organoids. (G) Quantification of TH protein expression normalized to total protein. Data representative of all slices derived from three midbrain organoids. Statistical significance determined by multiple t-test analysis denoted by * = (p ≤ 0.05), ** = (p ≤ 0.01), *** = (p ≤ 0.001), **** = (p ≤ 0.0001).
FIGURE 4
FIGURE 4
Development of astrocytes in midbrain organoids characterized by GFAP expression. (A) Representative immunofluorescence images at ×5 and ×20 magnification showing DAPI (cyan) and GFAP (yellow). Scale bars: 250um (5x) and 50um (20x), white boxes indicate zoomed in region. (B) Representative bright field images of GFAP immunohistochemistry staining at ×4 and ×20 magnification. Scale bars: 250um (4x) and 50um (20x), black boxes indicate zoomed in region. (C) Quantification of total percent positive GFAP staining. (D) A representative western blot showing GFAP expression in cell lysates obtained from control and NGLY1 disease midbrain organoids. (E) Quantification of GFAP protein expression normalized to total protein. Data representative of all slices derived from three midbrain organoids. Statistical significance determined by multiple t-test analysis denoted by * = (p ≤ 0.05), ** = (p ≤ 0.01), *** = (p ≤ 0.001), **** = (p ≤ 0.0001).
FIGURE 5
FIGURE 5
Expression of GABA and MOR in NGLY1 midbrains. (A) Representative images using brightfield and immunofluorescence microscopy for WT, NGLY1 diseased and NGLY1 KO midbrain organoids stained with antibody against GABA at different timepoints (45, 60 and 90 days). Scale bars: 500 µM (for 45, 60 and 90 days) and 50 µM (for 90 days zoomed in image). (B) Graph showing percent total GABA positive signal in different organoids at different timepoints. (C) Representative brightfield immunohistochemistry images for MOR expression at ×4 and ×40 magnification. Scale bars: 250um (4x) and 25um (40x), red boxes indicate zoomed in region. (D) Quantification of total percent positive MOR staining. Data representative of all slices derived from three midbrain organoids. Statistical significance determined by multiple t-test analysis denoted by * = (p ≤ 0.05), ** = (p ≤ 0.01), *** = (p ≤ 0.001), **** = (p ≤ 0.0001).
FIGURE 6
FIGURE 6
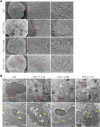
Electron microscopy characterization of midbrain organoids. (A) SEM images at 100x, ×500 and ×1500 magnification. (B) TEM images at 1000x and 6000x magnification showing cellular organelles (ER-endoplasmic reticulum, M-mitochondria, L-lysosome, G-golgi, AP-autophagosome).
FIGURE 7
FIGURE 7
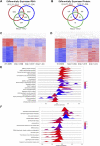
Multiomic analysis of NGLY1 deficient midbrain organoids. (A) Venn diagram summary of differentially expressed genes in midbrain organoids, differential expression was defined as absolute value log-2 fold-change >1 with a FDR <0.01. (B) Venn diagram summary of differentially expressed proteins in midbrain organoids, differential expression was defined as absolute value fold-change > |25%| with a FDR <0.05. (C) Heatmap showing upregulated and downregulated transcripts in NGLY1 deficient midbrain organoids. Expression normalized to wild type, red corresponds to higher expression, blue represents lower expression. (D) Heatmap showing upregulated and downregulated proteins in NGLY1 deficient midbrain organoids. Expression normalized to wild type, red corresponds to higher expression, and blue represents lowered expression. (E) Gene set enrichment analysis of global transcriptomic analysis of NGLY1 deficient midbrain organoids using the NCATS BioPlanet pathway annotation, pathways with an FDR < 0.20 were included. (F) Gene set enrichment analysis of proteomic profiling of NGLY1 deficient midbrain organoids utilizing the NCATS BioPlanet pathway database, pathways with an FDR < 0.25 were included.

References

    1. Arenas E. (2008). Foxa2: The rise and fall of dopamine neurons. Cell Stem Cell 2, 110–112. 10.1016/j.stem.2008.01.012 - DOI - PubMed
    1. Asahina M., Fujinawa R., Nakamura S., Yokoyama K., Tozawa R., Suzuki T. (2020). Ngly1 -/- rats develop neurodegenerative phenotypes and pathological abnormalities in their peripheral and central nervous systems. Hum. Mol. Genet. 29, 1635–1647. 10.1093/hmg/ddaa059 - DOI - PMC - PubMed
    1. Bouarab C., Thompson B., Polter A. M. (2019). VTA GABA neurons at the interface of stress and reward. Front. Neural Circuits 13, 78. 10.3389/fncir.2019.00078 - DOI - PMC - PubMed
    1. Caglayan A. O., Comu S., Baranoski J. F., Parman Y., Kaymakçalan H., Akgumus G. T., et al. (2015). NGLY1 mutation causes neuromotor impairment, intellectual disability, and neuropathy. Eur. J. Med. Genet. 58, 39–43. 10.1016/j.ejmg.2014.08.008 - DOI - PMC - PubMed
    1. D'Amelio M., Cavallucci V., Cecconi F. (2010). Neuronal caspase-3 signaling: Not only cell death. Cell Death Differ. 17, 1104–1114. 10.1038/cdd.2009.180 - DOI - PubMed