. 2023 Feb 15:11:1091047.
doi: 10.3389/fcell.2023.1091047. eCollection 2023.

resVAE ensemble: Unsupervised identification of gene sets in multi-modal single-cell sequencing data using deep ensembles

Affiliations

resVAE ensemble: Unsupervised identification of gene sets in multi-modal single-cell sequencing data using deep ensembles

Foo Wei Ten et al. Front Cell Dev Biol. .

Abstract

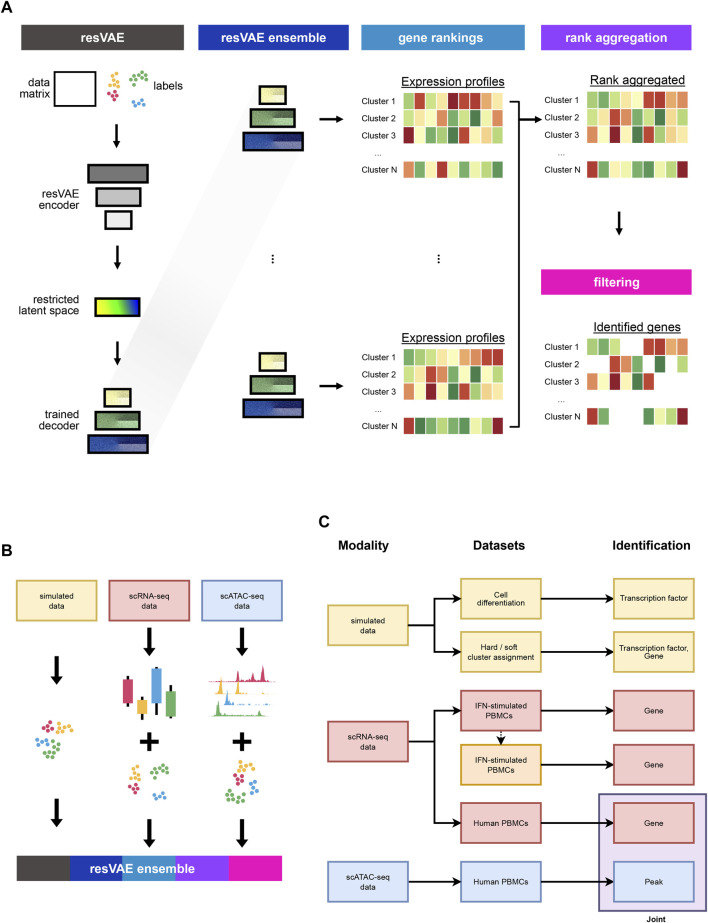
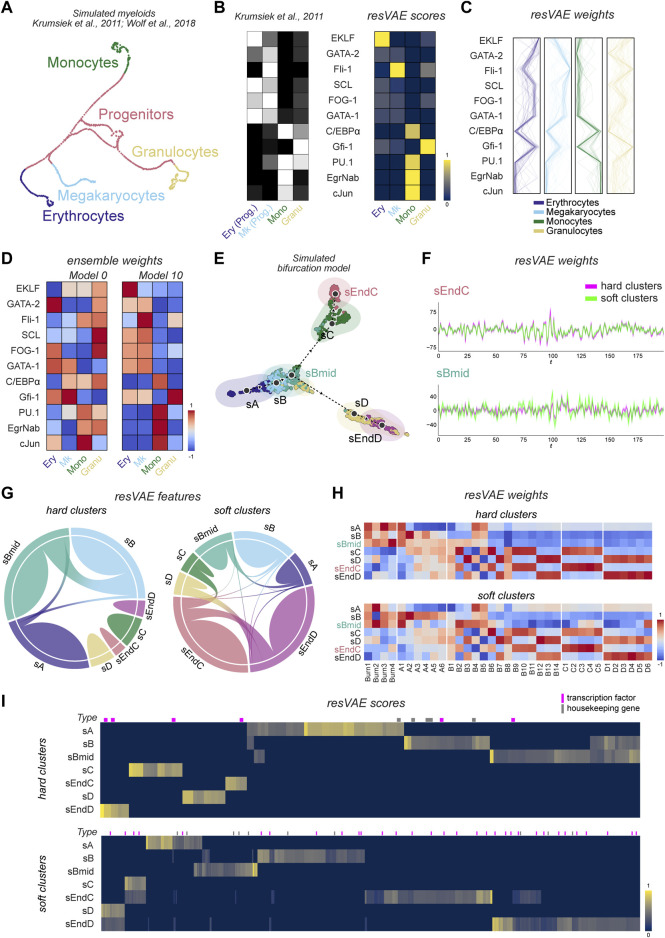
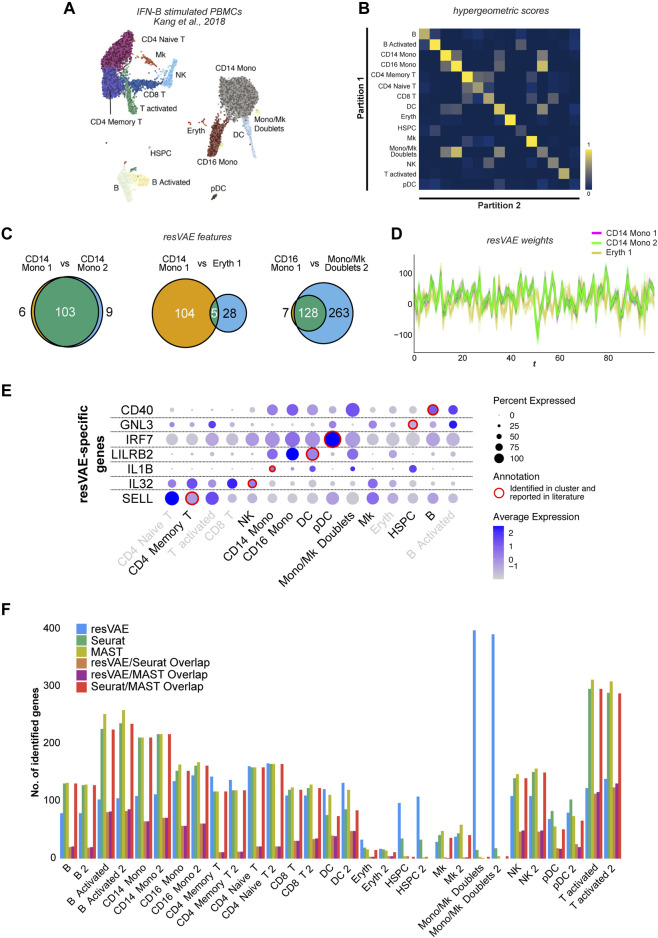
Feature identification and manual inspection is currently still an integral part of biological data analysis in single-cell sequencing. Features such as expressed genes and open chromatin status are selectively studied in specific contexts, cell states or experimental conditions. While conventional analysis methods construct a relatively static view on gene candidates, artificial neural networks have been used to model their interactions after hierarchical gene regulatory networks. However, it is challenging to identify consistent features in this modeling process due to the inherently stochastic nature of these methods. Therefore, we propose using ensembles of autoencoders and subsequent rank aggregation to extract consensus features in a less biased manner. Here, we performed sequencing data analyses of different modalities either independently or simultaneously as well as with other analysis tools. Our resVAE ensemble method can successfully complement and find additional unbiased biological insights with minimal data processing or feature selection steps while giving a measurement of confidence, especially for models using stochastic or approximation algorithms. In addition, our method can also work with overlapping clustering identity assignment suitable for transitionary cell types or cell fates in comparison to most conventional tools.

Keywords: bioinformatics; deep learning; ensemble; gene set analysis; rank aggregation; single-cell sequencing.


Conflict of interest statement

The authors declare that the research was conducted in the absence of any commercial or financial relationships that could be construed as a potential conflict of interest.

Figures

FIGURE 1
FIGURE 1
The variational autoencoder based resVAE architecture allows each label to have its own label-specific latent space for label-specific features identification. (A) shows the overall design of the resVAE ensemble workflow. (B) shows the use case of the resVAE ensemble methodology that can be applied to various forms of single-cell data with their corresponding cluster identities, including simulated data, scRNA-seq counts and scATAC-seq peaks. (C) highlights the overview of this manuscript. We highlighted the application of the resVAE ensemble methodology on simulated data and single-cell sequencing datasets of different modalities to identify features that could be used for further analysis.
FIGURE 2
FIGURE 2
Results of resVAE ensemble on two simulated datasets. (AD) correspond to the simulated PBMC dataset, while (EI) correspond to the simulated bifurcation model dataset. (A) shows the UMAP of the cells from the simulated myeloid differentiation dataset provided in Scanpy (Krumsiek et al., 2011; Wolf et al., 2018). (B) shows the result of resVAE ensemble (right) in comparison the summarized expression levels of the 11 features present used to model the simulation (left, Krumsiek et al., 2011). (C) the lines show the weight mappings of these features in their corresponding clusters across all trained resVAE decoders. (D) shows the overall performance of two example models from the ensemble. (Ery: Erythrocytes; Mk: Megakaryocytes; Mono: Monocytes; Granu: Granulocytes; Prog: Progenitors). (E) shows the UMAP of the seven different cell states from the simulated bifurcation trajectory dataset. (F) shows the Andrews curves that highlight the structures of the resVAE decoders’ weights mappings of two different clustering analysis methods in two example populations, sEndC and sBmid. (G) shows the features identified by resVAE ensemble for the two different cluster assignment methods across all clusters. (H) shows the median weights mappings of the transcription factors across all models for the two cluster assignment methods. (I) shows the features identified by resVAE ensemble and their scores. The magenta and gray bars above the heatmaps correspond to transcription factors and housekeeping genes, respectively.
FIGURE 3
FIGURE 3
Results of explorative analyses using resVAE ensemble on the IFN-beta stimulated PBMC dataset. (A) shows the UMAP of the IFN-beta stimulated PBMC dataset with artificially introduced partitions shown in different shades. (B) shows the heatmap highlighting the significance scores of overlaps in genes identified by resVAE ensemble across the different clusters and partitions. (C) shows the number of overlapping identified genes between the different clusters. (D) shows the Andrews curves of the decoders’ median weights mappings described by the leftmost and middle Venn diagrams in (C). (E) shows some selected examples of biologically meaningful genes missed by Seurat but identified by resVAE ensemble. (F) shows the comparison of the number of identified genes using resVAE ensemble, Seurat and MAST as well as how much they overlap.
FIGURE 4
FIGURE 4
Results of explorative analyses using resVAE ensemble on the Human PBMC scRNA-seq and scATAC-seq datasets. (A) shows the UMAPs of the scRNA-seq and scATAC-seq datasets described by Stuart et al. (2021). (B) shows examples of transcription factor binding motifs and their footprinting identified in the Monocytes clusters. (C) shows the resVAE scores of the identified genes and peaks in the scRNA-seq and scATAC-seq data, respectively. (D) the chord diagrams highlight the extent of the sharing of identified features among the clusters. (E) shows examples of cell type enrichment terms that can be obtained from the identified peaks of CD14 Monocytes and NK CD56Dim clusters.

Similar articles

References

    1. Bishop G. A., Hostager B. S. (2001). Signaling by CD40 and its mimics in B cell activation. Immunol. Res. 24 (2), 97–109. 10.1385/IR:24:2:097 - DOI - PubMed
    1. Cannoodt R., Saelens W., Deconinck L., Saeys Y. (2021). Spearheading future omics analyses using dyngen, a multi-modal simulator of single cells. Nat. Commun. 12 (1), 3942–3949. 10.1038/s41467-021-24152-2 - DOI - PMC - PubMed
    1. Cao J., Spielmann M., Qiu X., Huang X., Ibrahim D. M., Hill A. J., et al. (2019). The single-cell transcriptional landscape of mammalian organogenesis. Nature 566 (7745), 496–502. 10.1038/s41586-019-0969-x - DOI - PMC - PubMed
    1. Cunin P., Nigrovic P. A. (2019). Megakaryocytes as immune cells. J. Leukoc. Biol. 105 (6), 1111–1121. 10.1002/JLB.MR0718-261RR - DOI - PMC - PubMed
    1. Datta L. (2020). A survey on activation functions and their relation with xavier and he normal initialization. arXiv preprint arXiv:2004.06632 .

LinkOut - more resources