

Comparison of the gut microbiome and resistome in captive African and Asian elephants on the same diet
- PMID: 36875997
- PMCID: PMC9978182
- DOI: 10.3389/fvets.2023.986382
Comparison of the gut microbiome and resistome in captive African and Asian elephants on the same diet
Abstract
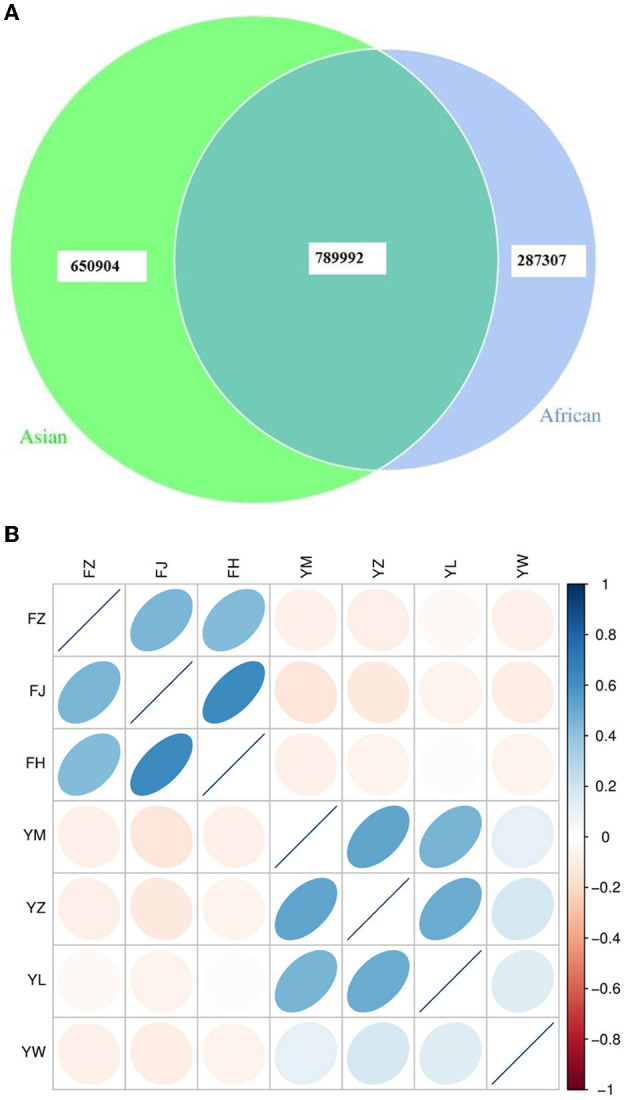
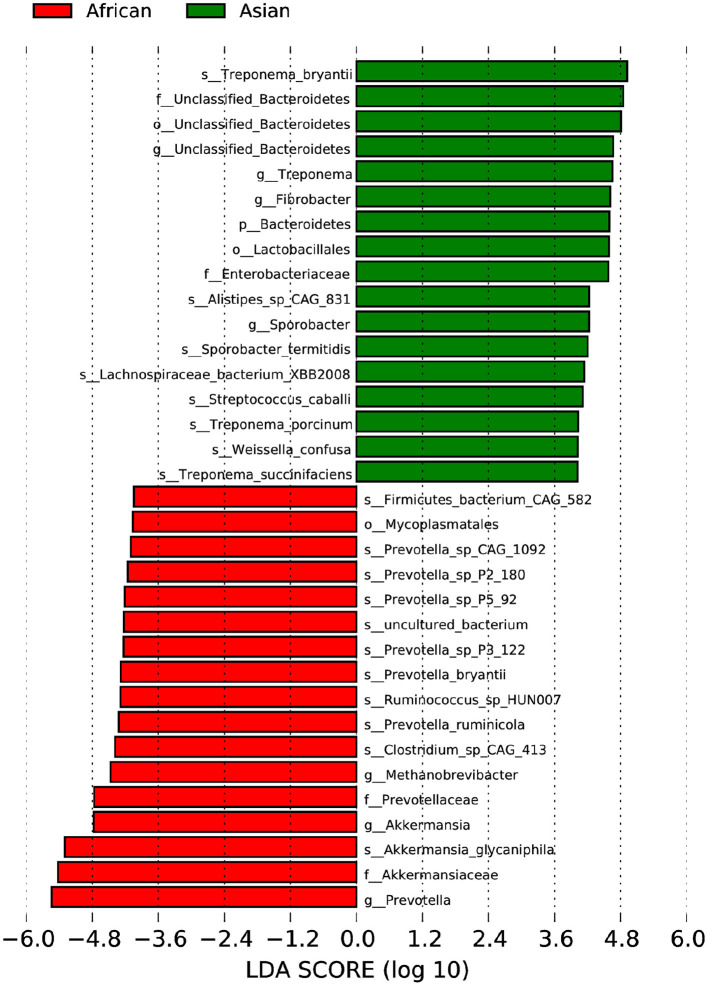
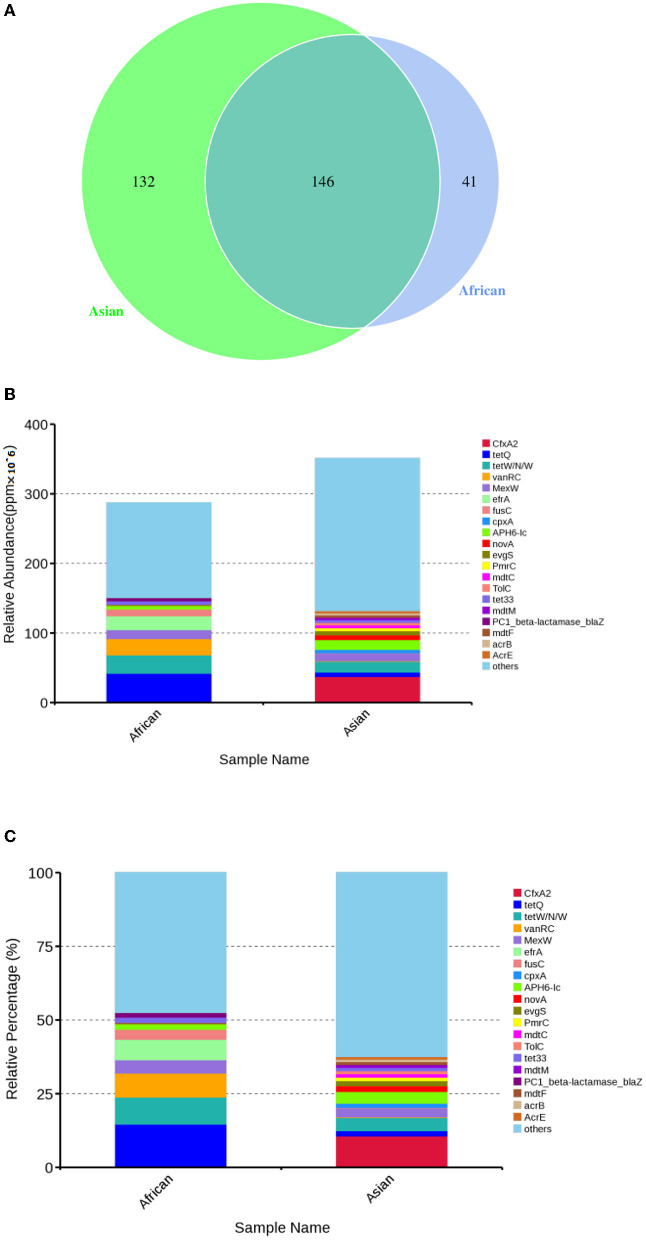
Elephants are endangered species and threatened with extinction. They are monogastric herbivorous, hindgut fermenters and their digestive strategy requires them to consume large amounts of low quality forage. The gut microbiome is important to their metabolism, immune regulation, and ecological adaptation. Our study investigated the structure and function of the gut microbiota as well as the antibiotic resistance genes (ARGs) in captive African and Asian elephants on the same diet. Results showed that captive African and Asian elephants had distinct gut bacterial composition. MetaStats analysis showed that the relative abundance of Spirochaetes (FDR = 0.00) and Verrucomicrobia (FDR = 0.01) at the phylum level as well as Spirochaetaceae (FDR = 0.01) and Akkermansiaceae (FDR = 0.02) at the family level varied between captive African and Asian elephants. Among the top ten functional subcategories at level 2 (57 seed pathway) of Kyoto Encyclopedia of Genes and Genomes (KEGG) database, the relative gene abundance of cellular community-prokaryotes, membrane transport, and carbohydrate metabolism in African elephants were significantly lower than those in Asian elephants (0.98 vs. 1.03%, FDR = 0.04; 1.25 vs. 1.43%, FDR = 0.03; 3.39 vs. 3.63%; FDR = 0.02). Among the top ten functional subcategories at level 2 (CAZy family) of CAZy database, MetaStats analysis showed that African elephants had higher relative gene abundance of Glycoside Hydrolases family 28 (GH 28) compared to Asian elephants (0.10 vs. 0.08%, FDR = 0.03). Regarding the antibiotic resistance genes carried by gut microbes, MetaStats analysis showed that African elephants had significantly higher relative abundance of vanO (FDR = 0.00), tetQ (FDR = 0.04), and efrA (FDR = 0.04) than Asian elephants encoding resistance for glycopeptide, tetracycline, and macrolide/rifamycin/fluoroquinolone antibiotic, respectively. In conclusion, captive African and Asian elephants on the same diet have distinct gut microbial communities. Our findings established the ground work for future research on improving gut health of captive elephants.
Keywords: captivity; diet; elephant; microbiome; resistome.
Copyright © 2023 Feng, Hua, Zhang, Liu, Luo, Li, Chen, Zhu, Wang and Lu.
Conflict of interest statement
The authors declare that the research was conducted in the absence of any commercial or financial relationships that could be construed as a potential conflict of interest.
Figures


Similar articles
-
Clinical health issues, reproductive hormones, and metabolic hormones associated with gut microbiome structure in African and Asian elephants.Anim Microbiome. 2021 Dec 20;3(1):85. doi: 10.1186/s42523-021-00146-9. Anim Microbiome. 2021. PMID: 34930501 Free PMC article.
-
Comparison of Fecal Antimicrobial Resistance Genes in Captive and Wild Asian Elephants.Antibiotics (Basel). 2023 May 6;12(5):859. doi: 10.3390/antibiotics12050859. Antibiotics (Basel). 2023. PMID: 37237762 Free PMC article.
-
Comparative and functional analyses of fecal microbiome in Asian elephants.Antonie Van Leeuwenhoek. 2022 Sep;115(9):1187-1202. doi: 10.1007/s10482-022-01757-1. Epub 2022 Jul 28. Antonie Van Leeuwenhoek. 2022. PMID: 35902439
-
Global landscape of gut microbiome diversity and antibiotic resistomes across vertebrates.Sci Total Environ. 2022 Sep 10;838(Pt 2):156178. doi: 10.1016/j.scitotenv.2022.156178. Epub 2022 May 23. Sci Total Environ. 2022. PMID: 35618126 Review.
-
Chemical signals in the reproduction of Asian (Elephas maximus) and African (Loxodonta africana) elephants.Anim Reprod Sci. 1998 Oct;53(1-4):19-34. doi: 10.1016/s0378-4320(98)00124-9. Anim Reprod Sci. 1998. PMID: 9835364 Review.
Cited by
-
Exploring microbial diversity and biosynthetic potential in zoo and wildlife animal microbiomes.Nat Commun. 2024 Sep 26;15(1):8263. doi: 10.1038/s41467-024-52669-9. Nat Commun. 2024. PMID: 39327429 Free PMC article.
-
Short-read full-length 16S rRNA amplicon sequencing for characterisation of the respiratory bacteriome of captive and free-ranging African elephants (Loxodonta africana).Sci Rep. 2024 Jun 26;14(1):14768. doi: 10.1038/s41598-024-65841-4. Sci Rep. 2024. PMID: 38926469 Free PMC article.
References
-
- Brown JL, Paris S, Prado-Oviedo NA, Meehan CL, Hogan JN, Morfeld KA, et al. . Reproductive health assessment of female elephants in North American zoos and association of husbandry practices with reproductive dysfunction in African elephants (Loxodonta africana). PLoS ONE. (2016) 11:e0145673. 10.1371/journal.pone.0145673 - DOI - PMC - PubMed
-
- Morfeld KA, Meehan CL, Hogan JN, Brown JL. Assessment of body condition in African (Loxodonta africana) and Asian (Elephas maximus) elephants in North American zoos and management practices associated with high body condition scores. PLoS ONE. (2016) 11:e0155146. 10.1371/journal.pone.0155146 - DOI - PMC - PubMed
LinkOut - more resources
Full Text Sources