

SARS-CoV-2-related bat virus behavior in human-relevant models sheds light on the origin of COVID-19
- PMID: 36876574
- PMCID: PMC10074129
- DOI: 10.15252/embr.202256055
SARS-CoV-2-related bat virus behavior in human-relevant models sheds light on the origin of COVID-19
Abstract
Bat sarbecovirus BANAL-236 is highly related to SARS-CoV-2 and infects human cells, albeit lacking the furin cleavage site in its spike protein. BANAL-236 replicates efficiently and pauci-symptomatically in humanized mice and in macaques, where its tropism is enteric, strongly differing from that of SARS-CoV-2. BANAL-236 infection leads to protection against superinfection by a virulent strain. We find no evidence of antibodies recognizing bat sarbecoviruses in populations in close contact with bats in which the virus was identified, indicating that such spillover infections, if they occur, are rare. Six passages in humanized mice or in human intestinal cells, mimicking putative early spillover events, select adaptive mutations without appearance of a furin cleavage site and no change in virulence. Therefore, acquisition of a furin site in the spike protein is likely a pre-spillover event that did not occur upon replication of a SARS-CoV-2-like bat virus in humans or other animals. Other hypotheses regarding the origin of the SARS-CoV-2 should therefore be evaluated, including the presence of sarbecoviruses carrying a spike with a furin cleavage site in bats.
Keywords: adaptive mutations; animal model; bat coronavirus; pathogenesis; serology.
© 2023 The Authors.
Conflict of interest statement
The authors declare that they have no conflict of interest.
Figures

Schematic representation of infection of K18‐hACE2 transgenic mice expressing human ACE2 (hACE2, black) or wild‐type BALB/c mice (white) with BANAL‐236 (red) or SARS‐CoV‐2 Wuhan‐372 (blue) viruses. Sample size shown as “x”. Lung, liver, spleen, and brain were collected at day 3 (D3) post‐infection. Blood was collected at D30 post‐infection before challenge with SARS‐CoV‐2 Wuhan‐D614G (yellow) virus. A second blood sample was collected at D14 post‐challenge. Number of mice per group is shown as “x”.
Body weight variation of K18‐hACE2 or BALB/c mice infected by BANAL‐236 (red) or Wuhan‐372 (blue) viruses at 104 PFU (solid lines) or 103 PFU (dotted lines) expressed as the mean (± SEM) body weight variation. Significant differences observed between K18‐hACE2 mice infected at 104 PFU by BANAL‐236 or Wuhan‐372 at day 4 is noted by an asterisk (Student test, P < 0.05). “#” artifactual body weight loss due to an incident occurred in the animal core facility on that day.
Quantification of BANAL‐236 and Wuhan‐372 in lung, spleen, and liver of mice infected at 104 PFU. Viral loads are expressed as the mean (± SD) genome copies of genomic RNA per g organ (solid bars) or as PFUs per g organ (dotted bars). The limit of detection of the RT–qPCR and viral titration are represented as a plain or dashed lines, respectively.
Neutralizing antibody titer (expressed in ED50) of mice primo‐infected at 104 PFU by BANAL‐236 (red) or SARS‐CoV‐2 Wuhan‐372 (blue) viruses. The antibody response against the Wuhan‐D614G challenge strain of mice primo‐infected by BANAL‐236 is presented as a dashed line. PNT means pseudo‐neutralization. Error bars represent the standard error of the mean (SEM), P = 0.05.
Survival curves of mice challenged with SARS‐CoV‐2 Wuhan‐D614G at 104 PFU, after a primo‐infection by BANAL‐236 or Wuhan‐372 viruses at 103 or 104 PFU. Survival of K18‐hACE2 naive mice infected by SARS‐CoV‐2 Wuhan‐D614G at 104 PFU is presented as a reference (yellow).
Histopathological analysis, 3 days post‐inoculation, of the lung of K18‐hACE2 mice infected with 104 PFU of BANAL‐236 (a–d) or SARS‐CoV‐2 Wuhan‐372 (e,f) viruses. Interstitial pneumonia characterized by interstitial inflammation, often centered on blood vessels (perivasculitis, black arrows) or bronchi/bronchioles (black arrowheads), and endothelial cell injury and inflammation (endotheliitis). Lesions were globally more severe after Wuhan‐372 infection (n = 4; all of moderate severity) than after BANAL‐236 infection (n = 4; 3/4 of minimal severity (a–c) and 1/4 of moderate severity (d)). Scale bar: 100 μm. Low‐magnification images are provided in Appendix Fig S3.
Clinical and biological results of the six serial passages of BANAL‐236 in K18‐hACE2 mice as a pool of lung homogenates of the previous passage. The last passage (P6) was then inoculated into K18‐hACE2 mice at 104 PFU. Middle panel: Viral load in the lung is expressed as the mean copies (± SEM) of genomic RNA per g of lung (solid line) or as PFUs per g of lung (dashed line). Right panel: Body weight variation of K18‐hACE2 mice infected by BANAL‐236 P1 (red, same results as those of Fig 1B) or P6 (green) viruses at 104 PFU. Significant differences observed between K18‐hACE2 mice infected by P1 or P6 are noted by an asterisk (**P < 0.01).

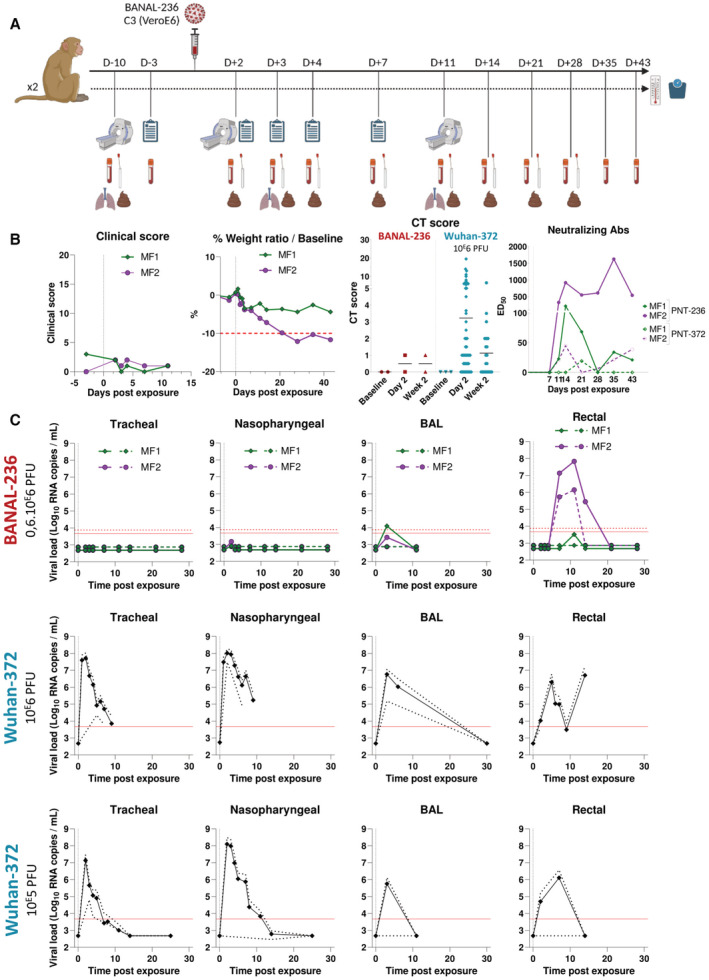
Schematic representation of infection of cynomolgus macaques by BANAL‐236 virus. CT scan, clinical scoring and biological samples were realized 10 and 3 days before infection, respectively, to serve as baseline (BL) reference. The body temperature and weight were monitored at each anesthesia. Clinical scoring was realized at BL and then from D2 to D11 post‐infection and CT scan at BL and at D2 and D11 post‐infection. Broncho‐alveolar lavage (BAL) was realized at D3 and D11 post‐infection and biological sampling of nasopharyngeal, tracheal, and rectal swabs at D2 to 28 post‐infection to monitor the virus load and antibody profile. Blood samples were collected 10 days before infection to 43 days post‐infection and were used for hematology, cytokine quantification, and antibody profiling.
Effects of infection by BANAL‐236 virus in non‐human primates. Animal #MF1 is presented in green and animal #MF2 in purple. Clinical score, body weight variation (in %), CT scores (compared to Wuhan‐372) and neutralizing antibodies are measured from 10 days before infection to 43 days post‐infection.
Viral load expressed in log10 copies of genomic RNA (solid line) or sub‐genomic RNA (dashed line) per ml of tracheal, nasopharyngeal, BAL, and rectal fluids. Lower limit of quantification is presented in red for both genomic (solid line) and sub‐genomic (dashed line) RNA, and limits of detection are presented in green for both genomic (solid line) and sub‐genomic (dashed line) RNA. Results were compared to historical data of SARS‐CoV‐2 Wuhan‐372 virus inoculated at 106 or 105 PFU (presented as the mean virus load ± 95% CI expressed in log10 copies of genomic RNA/ml).

Schematic representation of serial passages of BANAL‐236 virus in Vero E6 cells (C1–C3) followed by six passages in K18‐hACE2 mice or by six passages in Caco‐2 cells at a constant multiplicity of infection (MOI; C4–C9).
Mutation profiles of BANAL‐236 after passages in VeroE6 cells, Caco‐2 cells, K18‐hACE2 mice and in the feces of macaque during the course of infection. Mutations reported in the heatmap were detected in at least three samples at a frequency above 10% in at least one sample. Rows are ordered according to the different passages and columns are clustered by SNVs frequencies.
Stacked histogram to compare the SNV frequencies of BANAL‐236 from the Caco‐2 and mice serial passages along the MZ9370003.2 genome. Mutations reported were detected in at least three serial samples. K18‐hACE2 lung passages are color coded in red in the upper panel and Caco‐2 passages are color coded in green in the lower panel. Each colored square height summarizes the allelic frequency (AF).
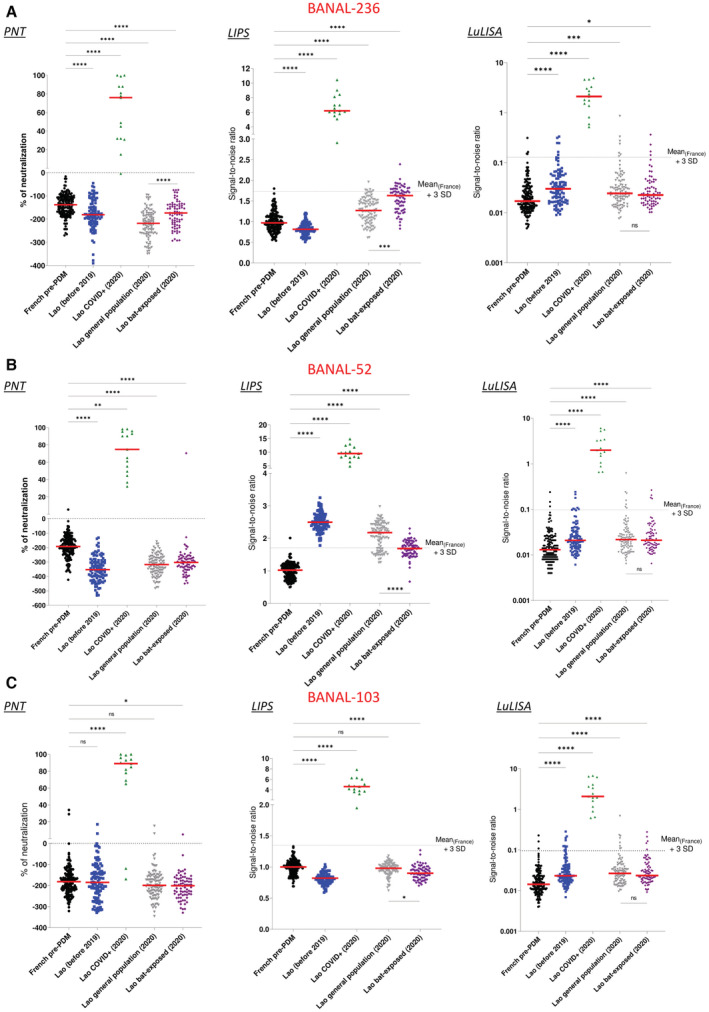
- A–C
Results of Pseudoneutralization (PNT), Luciferase immunoprecipitation (LIPS), and LuLISA tests are shown. Pre‐pandemic French sera (black) were used as negative controls and Laotian sera samples from confirmed SARS‐CoV‐2 infection (green) were used as cross‐reacting positive controls. Laotian sera samples collected in the general population before 2019 (blue, n = 100) or late 2020 (gray, n = 100) or in people exposed to bats (purple, n = 74) were tested for BANAL‐236 (A), BANAL‐52 (B) and BANAL‐103 (C) antibody responses. The ANOVA non‐parametric Kruskal–Wallis test was conducted to compare each sub‐population to the reference French population (*P < 0.05; **P < 0.005; ***P < 0.0005; ****P < 0.0001). The red bars represent the median.
References
-
- Abraham MJ, Murtola T, Schulz R, Páll S, Smith JC, Hess B, Lindahl E (2015) GROMACS: high performance molecular simulations through multi‐level parallelism from laptops to supercomputers. SoftwareX 1–2: 19–25
-
- Berendsen HJC, Postma JPM, van Gunsteren WF, DiNola A, Haak JR (1984) Molecular dynamics with coupling to an external bath. J Chem Phys 81: 3684–3690
-
- Bonomi M, Bussi G, Camilloni C, Tribello GA, Banáš P, Barducci A, Bernetti M, Bolhuis PG, Bottaro S, Branduardi D et al (2019) Promoting transparency and reproducibility in enhanced molecular simulations. Nat Methods 16: 670–673 - PubMed
-
- Bussi G, Donadio D, Parrinello M (2007) Canonical sampling through velocity rescaling. J Chem Phys 126: 014101 - PubMed
Publication types
MeSH terms
Substances
Grants and funding
LinkOut - more resources
Full Text Sources
Medical
Molecular Biology Databases
Miscellaneous
