

Dorsal Subluxation of the First Metacarpal During Thumb Flexion is an Indicator of Carpometacarpal Osteoarthritis Progression
- PMID: 36877171
- PMCID: PMC10194679
- DOI: 10.1097/CORR.0000000000002575
Dorsal Subluxation of the First Metacarpal During Thumb Flexion is an Indicator of Carpometacarpal Osteoarthritis Progression
Abstract
Background: Measurable changes in patients with progression of thumb carpometacarpal (CMC) osteoarthritis (OA) include joint space narrowing, osteophyte formation, subluxation, and adjacent-tissue changes. Subluxation, an indication of mechanical instability, is postulated as an early biomechanical indicator of progressing CMC OA. Various radiographic views and hand postures have been proposed to best assess CMC subluxation, but 3D measurements derived from CT images serve as the optimal metric. However, we do not know which thumb pose yields subluxation that most indicates OA progression.
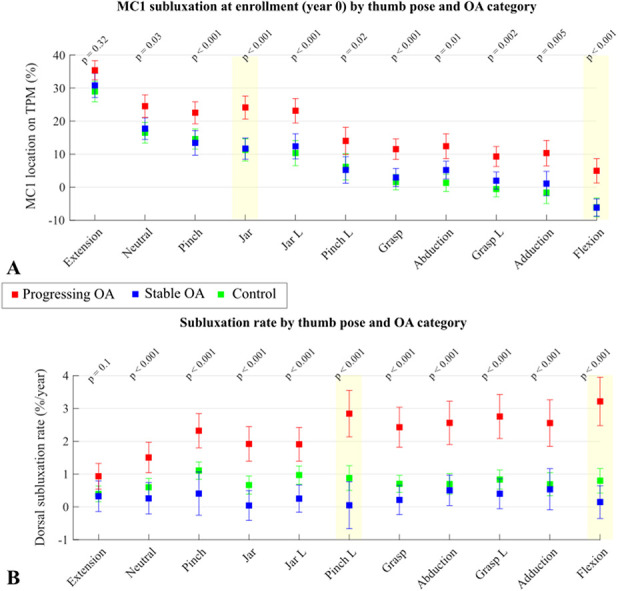
Questions/purposes: Using osteophyte volume as a quantitative measure of OA progression, we asked: (1) Does dorsal subluxation vary by thumb pose, time, and disease severity in patients with thumb CMC OA? (2) In which thumb pose(s) does dorsal subluxation most differentiate patients with stable CMC OA from those with progressing CMC OA? (3) In those poses, what values of dorsal subluxation indicate a high likelihood of CMC OA progression?
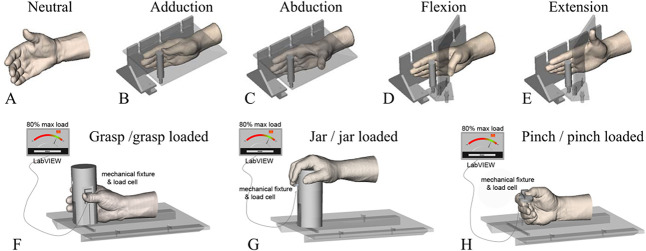
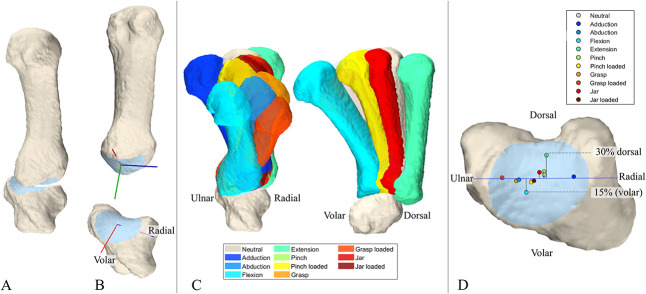
Methods: Between 2011 and 2014, 743 patients were seen at our institutions for trapeziometacarpal pain. We considered individuals who were between the ages of 45 and 75 years, had tenderness to palpation or a positive grind test result, and had modified Eaton Stage 0 or 1 radiographic thumb CMC OA as potentially eligible for enrollment. Based on these criteria, 109 patients were eligible. Of the eligible patients, 19 were excluded because of a lack of interest in study participation, and another four were lost before the minimum study follow-up or had incomplete datasets, leaving 86 (43 female patients with a mean age of 53 ± 6 years and 43 male patients with a mean age of 60 ± 7 years) patients for analysis. Twenty-five asymptomatic participants (controls) aged 45 to 75 years were also prospectively recruited to participate in this study. Inclusion criteria for controls included an absence of thumb pain and no evidence of CMC OA during clinical examination. Of the 25 recruited controls, three were lost to follow-up, leaving 22 for analysis (13 female patients with a mean age of 55 ± 7 years and nine male patients with a mean age of 58 ± 9 years). Over the 6-year study period, CT images were acquired of patients and controls in 11 thumb poses: neutral, adduction, abduction, flexion, extension, grasp, jar, pinch, grasp loaded, jar loaded, and pinch loaded. CT images were acquired at enrollment (Year 0) and Years 1.5, 3, 4.5, and 6 for patients and at Years 0 and 6 for controls. From the CT images, bone models of the first metacarpal (MC1) and trapezium were segmented, and coordinate systems were calculated from their CMC articular surfaces. The volar-dorsal location of the MC1 relative to the trapezium was computed and normalized for bone size. Patients were categorized into stable OA and progressing OA subgroups based on trapezial osteophyte volume. MC1 volar-dorsal location was analyzed by thumb pose, time, and disease severity using linear mixed-effects models. Data are reported as the mean and 95% confidence interval. Differences in volar-dorsal location at enrollment and rate of migration during the study were analyzed for each thumb pose by group (control, stable OA, and progressing OA). A receiver operating characteristic curve analysis of MC1 location was used to identify thumb poses that differentiated patients whose OA was stable from those whose OA was progressing. The Youden J statistic was used to determine optimized cutoff values of subluxation from those poses to be tested as indicators of OA progression. Sensitivity, specificity, negative predictive values, and positive predictive values were calculated to assess the performance of pose-specific cutoff values of MC1 locations as indicators of progressing OA.
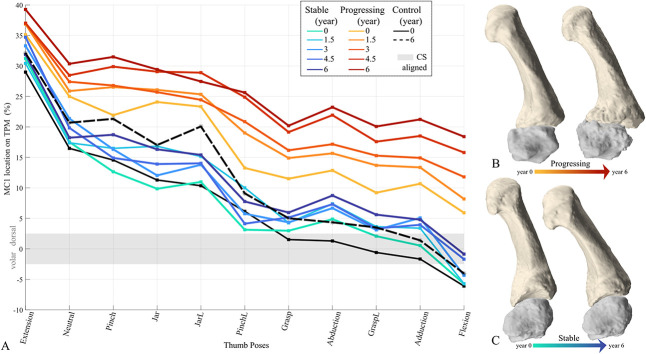
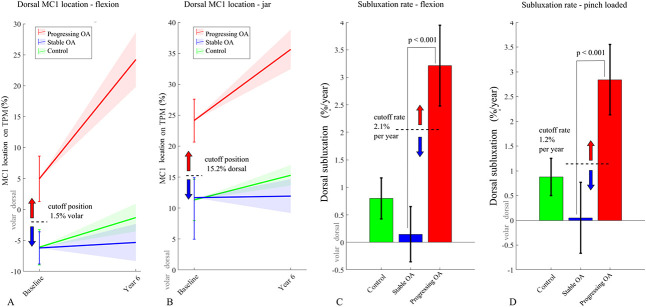
Results: In flexion, the MC1 locations were volar to the joint center in patients with stable OA (mean -6.2% [95% CI -8.8% to -3.6%]) and controls (mean -6.1% [95% CI -8.9% to -3.2%]), while patients with progressing OA exhibited dorsal subluxation (mean 5.0% [95% CI 1.3% to 8.6%]; p < 0.001). The pose associated with the most rapid MC1 dorsal subluxation in the progressing OA group was thumb flexion (mean 3.2% [95% CI 2.5% to 3.9%] increase per year). In contrast, the MC1 migrated dorsally much slower in the stable OA group (p < 0.001), at only a mean of 0.1% (95% CI -0.4% to 0.6%) per year. A cutoff value of 1.5% for the volar MC1 position during flexion at enrollment (C-statistic: 0.70) was a moderate indicator of OA progression, with a high positive predictive value (0.80) but low negative predictive value (0.54). Positive and negative predictive values of subluxation rate in flexion (2.1% per year) were high (0.81 and 0.81, respectively). The metric that most indicated a high likelihood of OA progression (sensitivity 0.96, negative predictive value 0.89) was a dual cutoff that combined the subluxation rate in flexion (2.1% per year) with that of loaded pinch (1.2% per year).
Conclusion: In the thumb flexion pose, only the progressing OA group exhibited MC1 dorsal subluxation. The MC1 location cutoff value for progression in flexion was 1.5% volar to the trapezium , which suggests that dorsal subluxation of any amount in this pose indicates a high likelihood of thumb CMC OA progression. However, volar MC1 location in flexion alone was not sufficient to rule out progression. The availability of longitudinal data improved our ability to identify patients whose disease will likely remain stable. In patients whose MC1 location during flexion changed < 2.1% per year and whose MC1 location during pinch loading changed < 1.2% per year, the confidence that their disease would remain stable throughout the 6-year study period was very high. These cutoff rates were a lower limit, and any patients whose dorsal subluxation advanced faster than 2% to 1% per year in their respective hand poses, were highly likely to experience progressive disease.
Clinical relevance: Our findings suggest that in patients with early signs of CMC OA, nonoperative interventions aimed to reduce further dorsal subluxation or operative treatments that spare the trapezium and limit subluxation may be effective. It remains to be determined whether our subluxation metrics can be rigorously computed from more widely available technologies, such as plain radiography or ultrasound.
Copyright © 2023 by the Association of Bone and Joint Surgeons.
Conflict of interest statement
All ICMJE Conflict of Interest Forms for authors and Clinical Orthopaedics and Related Research® editors and board members are on file with the publication and can be viewed on request.
Figures
Comment in
-
CORR Insights®: Dorsal Subluxation of the First Metacarpal During Thumb Flexion is an Indicator of Carpometacarpal Osteoarthritis Progression.Clin Orthop Relat Res. 2023 Jun 1;481(6):1238-1239. doi: 10.1097/CORR.0000000000002618. Epub 2023 Mar 9. Clin Orthop Relat Res. 2023. PMID: 36892532 Free PMC article. No abstract available.
Similar articles
-
Signs and symptoms to determine if a patient presenting in primary care or hospital outpatient settings has COVID-19.Cochrane Database Syst Rev. 2022 May 20;5(5):CD013665. doi: 10.1002/14651858.CD013665.pub3. Cochrane Database Syst Rev. 2022. PMID: 35593186 Free PMC article.
-
Comparison of Two Modern Survival Prediction Tools, SORG-MLA and METSSS, in Patients With Symptomatic Long-bone Metastases Who Underwent Local Treatment With Surgery Followed by Radiotherapy and With Radiotherapy Alone.Clin Orthop Relat Res. 2024 Dec 1;482(12):2193-2208. doi: 10.1097/CORR.0000000000003185. Epub 2024 Jul 23. Clin Orthop Relat Res. 2024. PMID: 39051924
-
Surgery for thumb (trapeziometacarpal joint) osteoarthritis.Cochrane Database Syst Rev. 2015 Feb 23;2015(2):CD004631. doi: 10.1002/14651858.CD004631.pub4. Cochrane Database Syst Rev. 2015. Update in: Cochrane Database Syst Rev. 2017 Apr 03;4:CD004631. doi: 10.1002/14651858.CD004631.pub5. PMID: 25702783 Free PMC article. Updated.
-
The Black Book of Psychotropic Dosing and Monitoring.Psychopharmacol Bull. 2024 Jul 8;54(3):8-59. Psychopharmacol Bull. 2024. PMID: 38993656 Free PMC article. Review.
-
Does Augmenting Irradiated Autografts With Free Vascularized Fibula Graft in Patients With Bone Loss From a Malignant Tumor Achieve Union, Function, and Complication Rate Comparably to Patients Without Bone Loss and Augmentation When Reconstructing Intercalary Resections in the Lower Extremity?Clin Orthop Relat Res. 2025 Jun 26. doi: 10.1097/CORR.0000000000003599. Online ahead of print. Clin Orthop Relat Res. 2025. PMID: 40569278
Cited by
-
Do osteophytes alter thumb carpometacarpal Biomechanics? a preliminary in vitro study.J Biomech. 2024 Nov;176:112333. doi: 10.1016/j.jbiomech.2024.112333. Epub 2024 Sep 19. J Biomech. 2024. PMID: 39326245
-
Osteoarthritis Progression, Pain, and Function in Early Carpometacarpal Osteoarthritis: A Six-Year Longitudinal Study.J Hand Surg Glob Online. 2025 Jul 22;7(5):100795. doi: 10.1016/j.jhsg.2025.100795. eCollection 2025 Sep. J Hand Surg Glob Online. 2025. PMID: 40741515 Free PMC article.
-
Disease severity versus pain severity: Range of motion differences during single- and multiplanar tasks in women with carpometacarpal osteoarthritis.J Orthop Res. 2024 Aug;42(8):1710-1718. doi: 10.1002/jor.25833. Epub 2024 Mar 14. J Orthop Res. 2024. PMID: 38483094 Free PMC article.
References
-
- Altman RD, Gold GE. Atlas of individual radiographic features in osteoarthritis, revised. Osteoarthritis Cartilage. 2007;15:A1-56. - PubMed
-
- Berger AJ, Meals RA. Management of osteoarthrosis of the thumb joints. J Hand Surg Am. 2015;40:843-850. - PubMed
-
- Chavance M, Escolano S. Misspecification of the covariance structure in generalized linear mixed models. Stat Methods Med Res. 2016;25:630-643. - PubMed
MeSH terms
Grants and funding
LinkOut - more resources
Full Text Sources
Medical
