

Mathematical Model of COVID-19 Pandemic with Double Dose Vaccination
- PMID: 36877326
- PMCID: PMC9986676
- DOI: 10.1007/s10441-023-09460-y
Mathematical Model of COVID-19 Pandemic with Double Dose Vaccination
Abstract
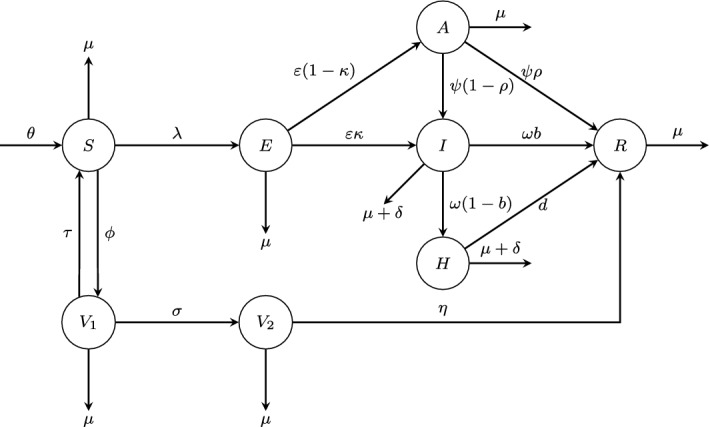
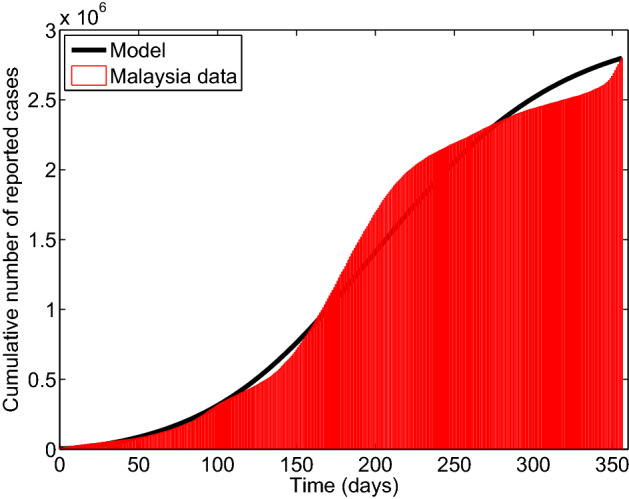
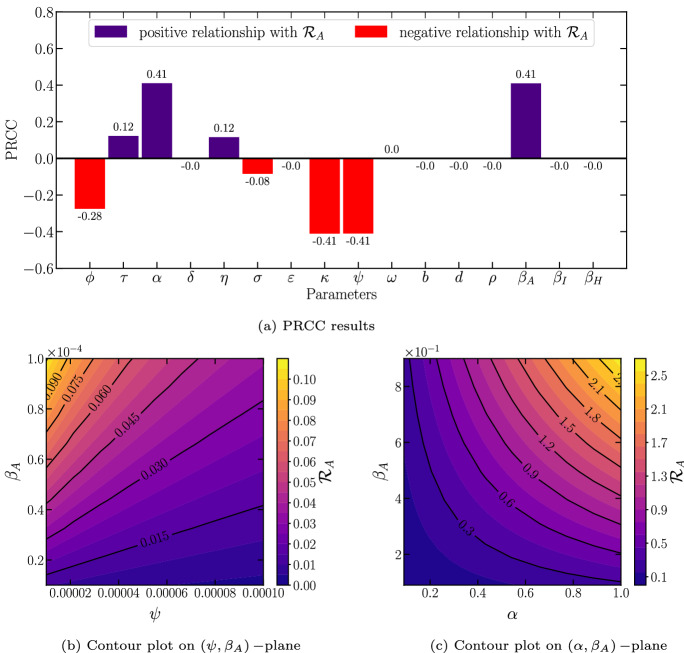
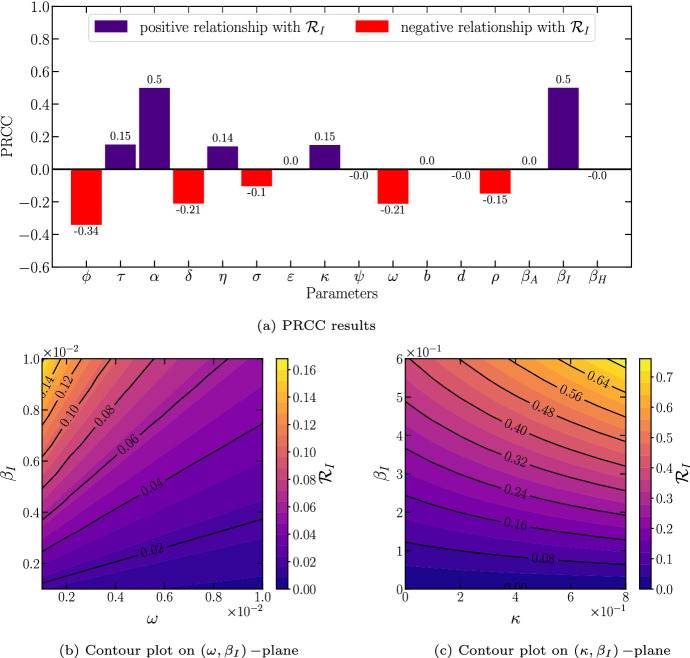
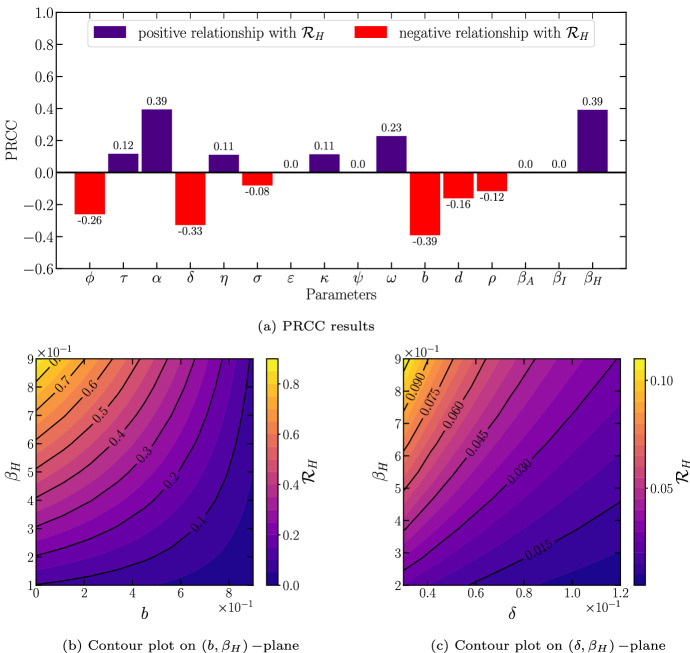
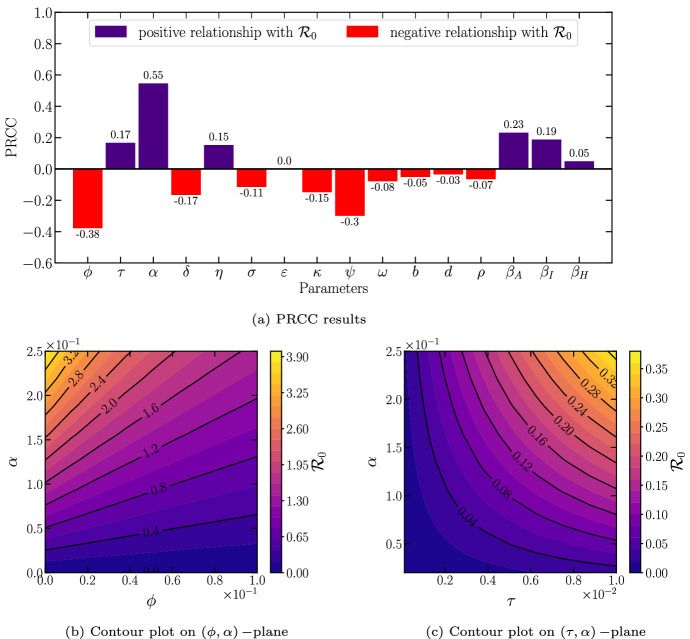
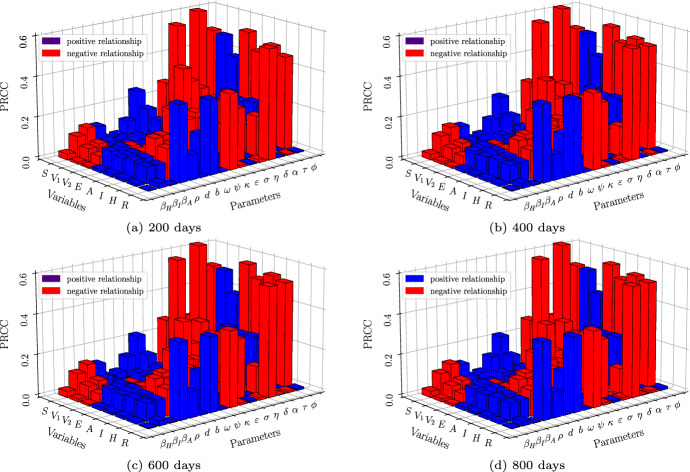
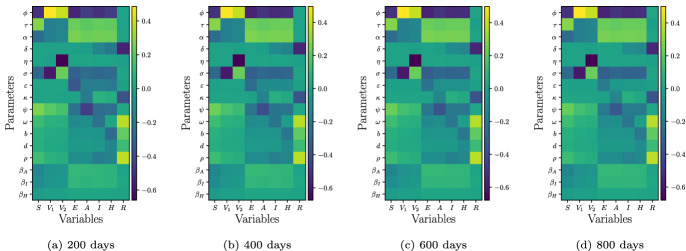
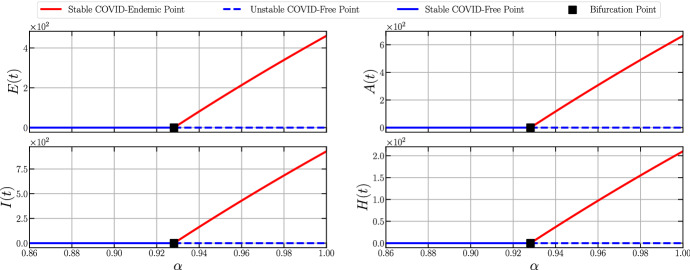
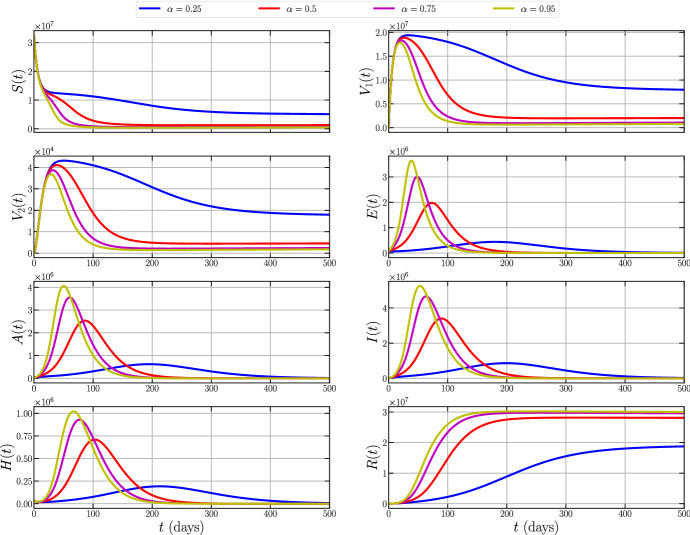
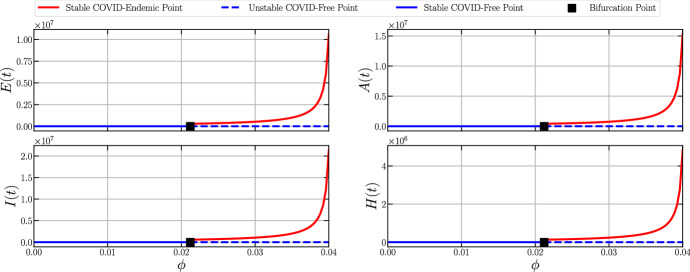
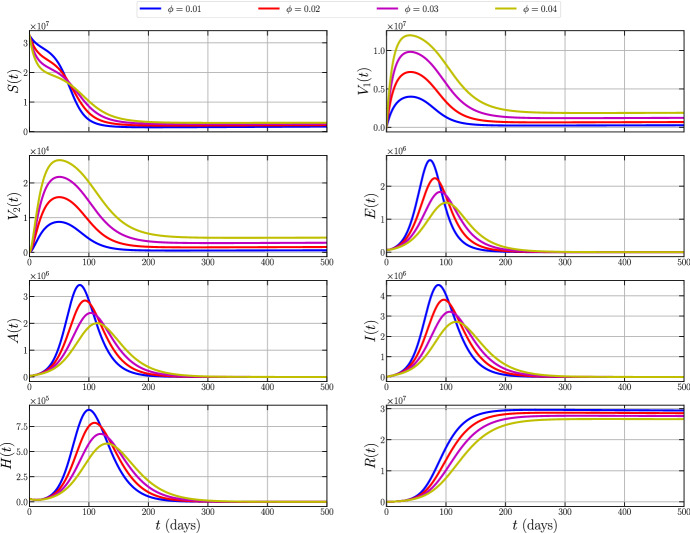
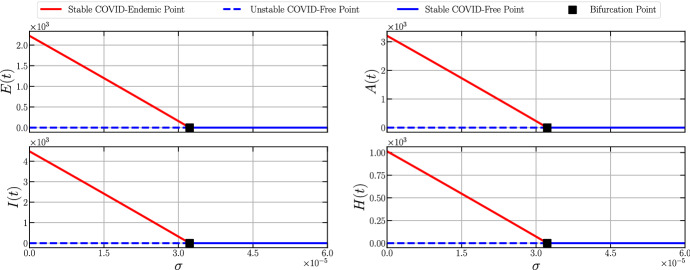
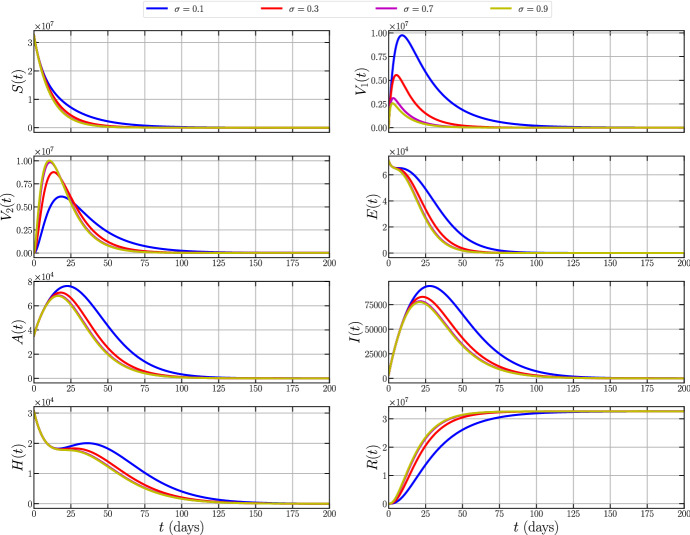
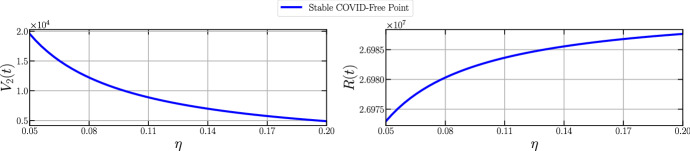
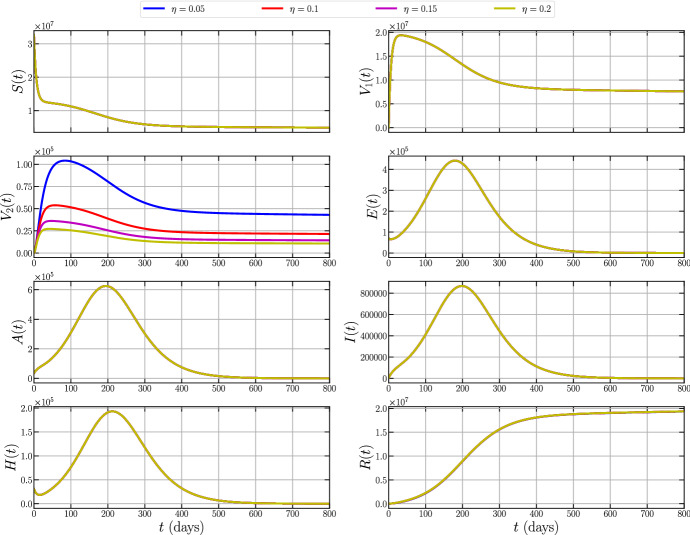
This paper is concerned with the formulation and analysis of an epidemic model of COVID-19 governed by an eight-dimensional system of ordinary differential equations, by taking into account the first dose and the second dose of vaccinated individuals in the population. The developed model is analyzed and the threshold quantity known as the control reproduction number [Formula: see text] is obtained. We investigate the equilibrium stability of the system, and the COVID-free equilibrium is said to be locally asymptotically stable when the control reproduction number is less than unity, and unstable otherwise. Using the least-squares method, the model is calibrated based on the cumulative number of COVID-19 reported cases and available information about the mass vaccine administration in Malaysia between the 24th of February 2021 and February 2022. Following the model fitting and estimation of the parameter values, a global sensitivity analysis was performed by using the Partial Rank Correlation Coefficient (PRCC) to determine the most influential parameters on the threshold quantities. The result shows that the effective transmission rate [Formula: see text], the rate of first vaccine dose [Formula: see text], the second dose vaccination rate [Formula: see text] and the recovery rate due to the second dose of vaccination [Formula: see text] are the most influential of all the model parameters. We further investigate the impact of these parameters by performing a numerical simulation on the developed COVID-19 model. The result of the study shows that adhering to the preventive measures has a huge impact on reducing the spread of the disease in the population. Particularly, an increase in both the first and second dose vaccination rates reduces the number of infected individuals, thus reducing the disease burden in the population.
Keywords: COVID-19; Effective reproduction number; Mathematical model; Sensitivity analysis.
© 2023. Prof. Dr. Jan van der Hoeven stichting voor theoretische biologie.
Conflict of interest statement
The authors declare that they have no conflict of interest concerning the publication of this manuscript
Figures
References
-
- Abro GEM, Zulkifli SA, Asirvadam VS, Mathur N, Kumar R, Oad VK (2021) Dynamic modeling of COVID-19 disease with impact of lockdown in Pakistan & Malaysia, In: 2021 IEEE international conference on signal and image processing applications (ICSIPA), IEEE, pp. 156–161
MeSH terms
LinkOut - more resources
Full Text Sources
Medical
