

T-Cell Repertoire Analysis in the Conjunctiva of Murine Dry Eye Model
- PMID: 36877515
- PMCID: PMC10007900
- DOI: 10.1167/iovs.64.3.14
T-Cell Repertoire Analysis in the Conjunctiva of Murine Dry Eye Model
Abstract
Purpose: Dry eye is closely related to the activation and proliferation of immune cells, especially T cells. However, the determination of the preferential T-cell clonotypes is technically challenging. This study aimed to investigate the characterization of T-cell receptor (TCR) repertoire in the conjunctiva during dry eye.
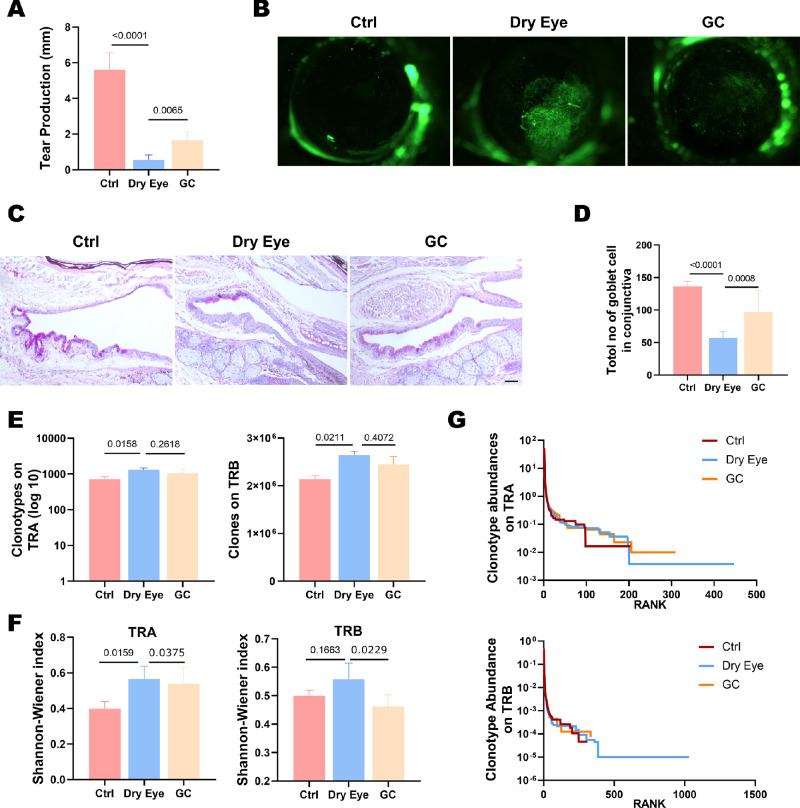
Methods: A desiccating stress animal model was established using C57/BL6 mice (8-10 weeks, female). After 7 days of stress stimulation, the slit-lamp image and Oregon-green-dextran staining were used to evaluate the ocular surface injury. Periodic acid-Schiff staining was used to measure the number of goblet cells. Flow cytometry was used to detect the activation and proliferation of T cells in the conjunctiva and cervical lymph nodes. Next-generation sequencing was used to detect the αβ TCR repertoire of the conjunctiva.
Results: The αβ TCR diversity increased significantly in the dry eye group, including the higher CDR3 amino acid length, marked gene usage on TCR V and J gene segments, extensive V(D)J recombination, and distinct CDR3 aa motifs. More important, several T-cell clonotypes were uniquely identified in dry eye. Furthermore, these perturbed rearrangements were reversed after glucocorticoid administration.
Conclusions: A comprehensive analysis of the αβ TCR repertoire in the conjunctiva of the dry eye mouse model was performed. Data in this study contributed significantly to the research on dry eye pathogenesis by demonstrating the TCR gene distribution and disease-specific TCR signatures. This study further provided some potential predictive T-cell biomarkers for future studies.
Conflict of interest statement
Disclosure:
Figures


Similar articles
-
Tear production and ocular surface changes in experimental dry eye after elimination of desiccating stress.Invest Ophthalmol Vis Sci. 2011 Sep 21;52(10):7267-73. doi: 10.1167/iovs.11-7231. Invest Ophthalmol Vis Sci. 2011. PMID: 21849424
-
PD-L1 Checkpoint Inhibition Narrows the Antigen-Specific T Cell Receptor Repertoire in Chronic Lymphocytic Choriomeningitis Virus Infection.J Virol. 2020 Aug 31;94(18):e00795-20. doi: 10.1128/JVI.00795-20. Print 2020 Aug 31. J Virol. 2020. PMID: 32641478 Free PMC article.
-
Therapeutic Effect of MK2 Inhibitor on Experimental Murine Dry Eye.Invest Ophthalmol Vis Sci. 2017 Sep 1;58(11):4898-4907. doi: 10.1167/iovs.17-22240. Invest Ophthalmol Vis Sci. 2017. PMID: 28973340
-
Application of the molecular analysis of the T-cell receptor repertoire in the study of immune-mediated hematologic diseases.Hematology. 2003 Jun;8(3):173-81. doi: 10.1080/1024533031000107505. Hematology. 2003. PMID: 12745651 Review.
-
Mucosal tolerance disruption favors disease progression in an extraorbital lacrimal gland excision model of murine dry eye.Exp Eye Res. 2016 Oct;151:19-22. doi: 10.1016/j.exer.2016.07.004. Epub 2016 Jul 18. Exp Eye Res. 2016. PMID: 27443502 Review.
Cited by
-
Single-Cell RNA Sequencing Revealed Functional Conjunctival Keratinocytes Loss via TGF-β-Wnt/β-Catenin Signaling in Sjögren's Syndrome Related Dry Eye.Invest Ophthalmol Vis Sci. 2025 Apr 1;66(4):43. doi: 10.1167/iovs.66.4.43. Invest Ophthalmol Vis Sci. 2025. PMID: 40238113 Free PMC article.
References
-
- Craig JP, Nichols KK, Akpek EK, et al. .. TFOS DEWS II definition and classification report. Ocular Surface. 2017; 15(3): 276–283. - PubMed
-
- Stern ME, Gao J, Schwalb TA, et al. .. Conjunctival T-cell subpopulations in Sjögren's and non-Sjögren's patients with dry eye. Invest Ophthalmol Vis Sci. 2002; 43(8): 2609–2614. - PubMed
-
- Zhang X, Lin X, Liu Z, et al. .. Topical application of mizoribine suppresses CD4+ T-cell-mediated pathogenesis in murine dry eye. Invest Ophthalmol Vis Sci. 2017; 58(14): 6056–6064. - PubMed
-
- Corrales RM, Stern ME, De Paiva CS, Welch J, Li DQ, Pflugfelder SC.. Desiccating stress stimulates expression of matrix metalloproteinases by the corneal epithelium. Invest Ophthalmol Vis Sci. 2006; 47(8): 3293–3302. - PubMed
Publication types
MeSH terms
Substances
LinkOut - more resources
Full Text Sources
Medical
