

Spatiotemporal Trends in Self-Reported Mask-Wearing Behavior in the United States: Analysis of a Large Cross-sectional Survey
- PMID: 36877548
- PMCID: PMC10028521
- DOI: 10.2196/42128
Spatiotemporal Trends in Self-Reported Mask-Wearing Behavior in the United States: Analysis of a Large Cross-sectional Survey
Abstract
Background: Face mask wearing has been identified as an effective strategy to prevent the transmission of SARS-CoV-2, yet mask mandates were never imposed nationally in the United States. This decision resulted in a patchwork of local policies and varying compliance, potentially generating heterogeneities in the local trajectories of COVID-19 in the United States. Although numerous studies have investigated the patterns and predictors of masking behavior nationally, most suffer from survey biases and none have been able to characterize mask wearing at fine spatial scales across the United States through different phases of the pandemic.
Objective: Urgently needed is a debiased spatiotemporal characterization of mask-wearing behavior in the United States. This information is critical to further assess the effectiveness of masking, evaluate the drivers of transmission at different time points during the pandemic, and guide future public health decisions through, for example, forecasting disease surges.
Methods: We analyzed spatiotemporal masking patterns in over 8 million behavioral survey responses from across the United States, starting in September 2020 through May 2021. We adjusted for sample size and representation using binomial regression models and survey raking, respectively, to produce county-level monthly estimates of masking behavior. We additionally debiased self-reported masking estimates using bias measures derived by comparing vaccination data from the same survey to official records at the county level. Lastly, we evaluated whether individuals' perceptions of their social environment can serve as a less biased form of behavioral surveillance than self-reported data.
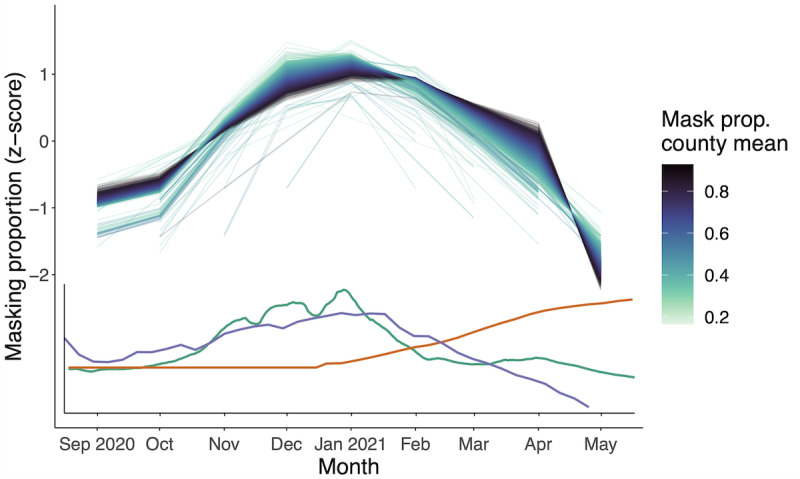
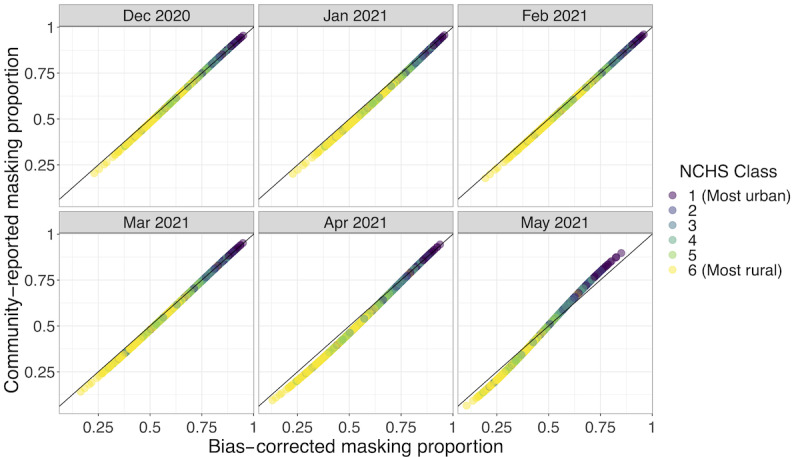
Results: We found that county-level masking behavior was spatially heterogeneous along an urban-rural gradient, with mask wearing peaking in winter 2021 and declining sharply through May 2021. Our results identified regions where targeted public health efforts could have been most effective and suggest that individuals' frequency of mask wearing may be influenced by national guidance and disease prevalence. We validated our bias correction approach by comparing debiased self-reported mask-wearing estimates with community-reported estimates, after addressing issues of a small sample size and representation. Self-reported behavior estimates were especially prone to social desirability and nonresponse biases, and our findings demonstrated that these biases can be reduced if individuals are asked to report on community rather than self behaviors.
Conclusions: Our work highlights the importance of characterizing public health behaviors at fine spatiotemporal scales to capture heterogeneities that may drive outbreak trajectories. Our findings also emphasize the need for a standardized approach to incorporating behavioral big data into public health response efforts. Even large surveys are prone to bias; thus, we advocate for a social sensing approach to behavioral surveillance to enable more accurate estimates of health behaviors. Finally, we invite the public health and behavioral research communities to use our publicly available estimates to consider how bias-corrected behavioral estimates may improve our understanding of protective behaviors during crises and their impact on disease dynamics.
Keywords: COVID-19; US; United States; behavior; community; decision-making; disease; effectiveness; face mask; nonpharmaceutical interventions; spatiotemporal; surveillance; survey; survey bias.
©Juliana C Taube, Zachary Susswein, Shweta Bansal. Originally published in JMIR Public Health and Surveillance (https://publichealth.jmir.org), 06.03.2023.
Conflict of interest statement
Conflicts of Interest: None declared.
Figures


Update of
-
Spatiotemporal trends in self-reported mask-wearing behavior in the United States: Analysis of a large cross-sectional survey.medRxiv [Preprint]. 2023 Jan 4:2022.07.19.22277821. doi: 10.1101/2022.07.19.22277821. medRxiv. 2023. Update in: JMIR Public Health Surveill. 2023 Mar 6;9:e42128. doi: 10.2196/42128. PMID: 36656779 Free PMC article. Updated. Preprint.
References
-
- Funk S, Salathé M, Jansen VAA. Modelling the influence of human behaviour on the spread of infectious diseases: a review. J R Soc Interface. 2010 Sep 06;7(50):1247–1256. doi: 10.1098/rsif.2010.0142. https://europepmc.org/abstract/MED/20504800 rsif.2010.0142 - DOI - PMC - PubMed
-
- Bayham J, Kuminoff NV, Gunn Q, Fenichel EP. Measured voluntary avoidance behaviour during the 2009 A/H1N1 epidemic. Proc Biol Sci. 2015 Nov 07;282(1818):20150814. doi: 10.1098/rspb.2015.0814. https://royalsocietypublishing.org/doi/abs/10.1098/rspb.2015.0814?url_ve... rspb.2015.0814 - DOI - PMC - PubMed
Publication types
MeSH terms
Grants and funding
LinkOut - more resources
Full Text Sources
Medical
Miscellaneous
