. 2023 Mar 14;120(11):e2218960120.
doi: 10.1073/pnas.2218960120. Epub 2023 Mar 6.

HIV post-treatment controllers have distinct immunological and virological features

Affiliations

HIV post-treatment controllers have distinct immunological and virological features

Behzad Etemad et al. Proc Natl Acad Sci U S A. .

Abstract

HIV post-treatment controllers (PTCs) are rare individuals who maintain low levels of viremia after stopping antiretroviral therapy (ART). Understanding the mechanisms of HIV post-treatment control will inform development of strategies aiming at achieving HIV functional cure. In this study, we evaluated 22 PTCs from 8 AIDS Clinical Trials Group (ACTG) analytical treatment interruption (ATI) studies who maintained viral loads ≤400 copies/mL for ≥24 wk. There were no significant differences in demographics or frequency of protective and susceptible human leukocyte antigen (HLA) alleles between PTCs and post-treatment noncontrollers (NCs, n = 37). Unlike NCs, PTCs demonstrated a stable HIV reservoir measured by cell-associated RNA (CA-RNA) and intact proviral DNA assay (IPDA) during analytical treatment interruption (ATI). Immunologically, PTCs demonstrated significantly lower CD4+ and CD8+ T cell activation, lower CD4+ T cell exhaustion, and more robust Gag-specific CD4+ T cell responses and natural killer (NK) cell responses. Sparse partial least squares discriminant analysis (sPLS-DA) identified a set of features enriched in PTCs, including a higher CD4+ T cell% and CD4+/CD8+ ratio, more functional NK cells, and a lower CD4+ T cell exhaustion level. These results provide insights into the key viral reservoir features and immunological profiles for HIV PTCs and have implications for future studies evaluating interventions to achieve an HIV functional cure.

Keywords: HIV; T cell; analytical treatment interruption; post-treatment controller; reservoir.


Conflict of interest statement

J.Z.L has received research support from Merck. M.M.L. and X.G.Y have received research support from Gilead Sciences. I.F. has received honoraria as a consultant to Gilead Sciences, ViiV Healthcare, and Merck and has received research support from Janssen Therapeutics, Sanofi, Moderna, and Pfizer. The content of this publication does not necessarily reflect the views or policies of the Department of Health and Human Services, nor does mention of trade names, commercial products, or organizations imply endorsement by the US Government.

Figures

Fig. 1.
Fig. 1.
Pre-ATI and ATI characteristics. (A) Viral load (VL) trajectory before and during ATI. Each participant’s viral load trajectory is depicted in dotted lines in the background, and Loess curves with 95% (CI) are shown. (B) CD4+ T cell count before and during ATI. (C) VL before and during ATI. Time point selection for PTCs and NCs is described in the Methods section. ****P < 0.0001.
Fig. 2.
Fig. 2.
Longitudinal analysis of HIV reservoir. Longitudinal (A) intact provirus from IPDA, (B) total provirus from IPDA, (C) defective provirus from IPDA, (D) CA-RNA, and (E) expression ratio (CA-RNA/total HIV DNA). Between-group comparison was conducted with the Wilcoxon rank-sum test adjusted for multiple time point comparisons with the Benjamini–Hochberg procedure. (F) Longitudinal Spearman correlation between different reservoir measurements. *P < 0.05, **P < 0.01, ***P < 0.001, and ****P < 0.0001.
Fig. 3.
Fig. 3.
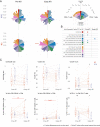
Longitudinal trajectory in T cell subsets. (A) Polar plots describing global CD4+ and CD8+ T cell subset levels. The mean percentile level for each variable from each group at each time point is shown as the radius of the polar plot. Red asterisks indicate significant longitudinal changes in NCs by pairwise within-group comparisons. (B) Summary of between-group comparison in each T cell feature category. Adonis nonparametric MANOVA was used to compare between-group differences in each T cell feature category. (C) Selected T cell features with significant between-group differences or longitudinal differences. Black asterisks, between-group differences (Wilcoxon rank-sum test); red asterisks, within-group longitudinal differences (pairwise Wilcoxon signed-rank test). *P < 0.05, **P < 0.01, and ****P < 0.0001.
Fig. 4.
Fig. 4.
T cell function and HIV viral control. (A) Polar plots describing global CD4+ and CD8+ T cell cytokine secretion upon Gag peptide pool stimulation. Mean percentiles are shown in the polar plot. (B) %CD8+ T cells secreting TNF-α and %CD4+ T cell secreting IFN-γ, the two T cell function features that were significantly different between PTCs and NCs. Medians (line) and individual data were shown for both PTCs and NCs. (C) Pairwise Spearman correlation between CD4+, CD8+ T cell function, and HIV virology parameters. (D) Selected correlation plots between T cell function and HIV virology parameters. Spearman correlation coefficient (Rho) and P values are shown. *P < 0.05, **P < 0.01, ***P < 0.001, and ****P < 0.0001.
Fig. 5.
Fig. 5.
NK cell phenotype and function. (A) %CD38+ in CD56- NK cells and %CD69+ in total NK cells, two NK activation markers that were significantly different between PTCs and NCs. (B) Correlation plots between NK features and CA-RNA before ATI and VL in early ATI. (C) Correlation plots demonstrating a significant correlation between NK features and virological features pre-ATI and early ATI. Spearman correlation coefficient (Rho) and P values are shown. *P < 0.05, **P < 0.01, ***P < 0.001, and ****P < 0.0001.
Fig. 6.
Fig. 6.
Longitudinal analysis of soluble proinflammatory markers. (A) Dot and Tukey box plots describing the longitudinal trajectory of soluble proinflammatory markers. Black asterisks indicate between-group comparison at one time point, adjusted for multiple comparisons with the Benjamini–Hochberg procedure. Red asterisks indicate significant longitudinal changes in NCs by pairwise within-group comparisons. For D-dimer, IL6, IP10, and sCsD14, 37 NCs and 21 PTCs had results available before ATI. For sCD163, 30 NCs and 13 PTCs had result available before ATI. For TNFR1, TNFR2, IFN-γ, TGFβ1, and IL10, 26 NCs and 20 or 21 PTCs had pre-ATI results available. For CRP, 26 NCs and 12 PTCs had pre-ATI results available. (B) Exploratory analysis assessing correlation between reservoir measures and proinflammatory markers. Pairwise Spearman correlation analysis was performed for each group at each time point. *P < 0.05, **P < 0.01, ***P < 0.001, and ****P < 0.0001.
Fig. 7.
Fig. 7.
Viro-immunological features associated with post-treatment control. (A) PLS-DA plot after feature selection. (B) Features contributing to Component 1, with a contribution rate >0.05, are plotted. (C) Receiver operating characteristic curve for Component 1. (D) Correlation network plot highlighting selected features. Pairwise Spearman correlations are calculated, and only those with Spearman coefficient Rho absolute values > 0.5 and P < 0.01 are included. (E) Heat map including selected features. Ward’s hierarchical clustering was performed. Each feature is scaled to Z score.

References

    1. Lederman M. M., et al. , A cure for HIV infection: "Not in my lifetime" or "just around the corner"? Pathog. Immun. 1, 154–164 (2016). - PMC - PubMed
    1. Li Y., Mohammadi A., Li J. Z., challenges and promise of human immunodeficiency virus remission. J. Infect. Dis. 223, S4–S12 (2021). - PMC - PubMed
    1. Hutter G., et al. , Long-term control of HIV by CCR5 Delta32/Delta32 stem-cell transplantation. N. Engl. J. Med. 360, 692–698 (2009). - PubMed
    1. Henrich T. J., et al. , Long-term reduction in peripheral blood HIV type 1 reservoirs following reduced-intensity conditioning allogeneic stem cell transplantation. J. Infect. Dis. 207, 1694–1702 (2013). - PMC - PubMed
    1. Pereyra F., et al. , The major genetic determinants of HIV-1 control affect HLA class I peptide presentation. Science 330, 1551–1557 (2010). - PMC - PubMed

Publication types