. 2023 Jun 8;141(23):2841-2852.
doi: 10.1182/blood.2022018885.

CDK7 controls E2F- and MYC-driven proliferative and metabolic vulnerabilities in multiple myeloma

Affiliations

CDK7 controls E2F- and MYC-driven proliferative and metabolic vulnerabilities in multiple myeloma

Yao Yao et al. Blood. .

Abstract

Therapeutic targeting of CDK7 has proven beneficial in preclinical studies, yet the off-target effects of currently available CDK7 inhibitors make it difficult to pinpoint the exact mechanisms behind MM cell death mediated by CDK7 inhibition. Here, we show that CDK7 expression positively correlates with E2F and MYC transcriptional programs in cells from patients with multiple myeloma (MM); its selective targeting counteracts E2F activity via perturbation of the cyclin-dependent kinases/Rb axis and impairs MYC-regulated metabolic gene signatures translating into defects in glycolysis and reduced levels of lactate production in MM cells. CDK7 inhibition using the covalent small-molecule inhibitor YKL-5-124 elicits a strong therapeutic response with minimal effects on normal cells, and causes in vivo tumor regression, increasing survival in several mouse models of MM including a genetically engineered mouse model of MYC-dependent MM. Through its role as a critical cofactor and regulator of MYC and E2F activity, CDK7 is therefore a master regulator of oncogenic cellular programs supporting MM growth and survival, and a valuable therapeutic target providing rationale for development of YKL-5-124 for clinical use.


Conflict of interest statement

Conflict-of-interest disclosure: N.K. is now an employee of Kymera Therapeutics, Inc. N.S.G. is a founder, science advisory board member, and equity holder in Syros, C4, Allorion, Jengu, B2S, Inception, EoCys, Larkspur (board member), and Soltego (board member). The Gray laboratory receives, or has received, research funding from Novartis, Takeda, Astellas, Taiho, Janssen, Kinogen, Arbella, Deerfield, and Sanofi. N.S.G. and N.K. are named inventors on patent claiming YKL-5-124. K.C.A. has received consulting fees from Bristol-Myers Squibb (BMS), Celgene, Gilead, Janssen, Precision Biosciences, Sanofi-Aventis, Takeda, and Tolero; and serves on the board of directors of, and has stock options in, Oncopep. N.C.M. is a consultant for BMS, Janssen, Oncopep, Amgen, Karyopharm, Legened, AbbVie, Takeda, and GSK; and serves on the board of directors of, and stock options in, Oncopep. C.Y.L. is an executive and shareholder of Kronos Bio; has licensed intellectual property to Syros Pharmaceuticals; and is a shareholder and adviser of Ovibio, which is involved in the commercialization of YKL-5-124. R.A.Y. is a founder and equity holder in Syros Pharmaceuticals. B.N. is an inventor on patent applications related to the dTAG system (WO/2017/024318, WO/2017/024319, WO/2018/148440, WO/2018/148443, and WO/2020/146250). M.C. has received royalties for the VkMYCDLox technology. C.M. serves on the scientific advisory board of Adicet Bio; and discloses consultant/honoraria from Genentech, Fate Therapeutics, Ionis Pharmaceuticals, FIMECS, Secura Bio, and Oncopeptides; and discloses research funding from Janssen/Johnson & Johnson, EMD Serono, Arch Oncology, Karyopharm, Sanofi, Nurix, BMS, H3 Biomedicine/Eisai, Springworks, Abcuro, and Novartis. The remaining authors declare no competing financial interests.

Figures

None
Graphical abstract
Figure 1.
Figure 1.
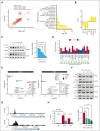
MM cells are selectively sensitive to CDK7 inhibition. (A) Primary cells from patients newly diagnosed with MM (n = 4), MM cell lines (n = 30), PHA-activated PBMCs (n = 9), and nontransformed human cell lines (GMO5756, IMR90, HEEpiC, and HS-5 cell lines) were treated with different concentrations of YKL-5-124 for 48 hours and assessed for cell viability using CellTiter-Glo (CTG). IC50 analysis was performed with GraphPad software. Data are shown as the mean value ± SD; ∗∗∗P < .001. (B) H929 and AMO1 cells were engineered with a dTAG epitope (dTAG-CDK7WT). Cell viability was measured in H929 dTAG-CDK7WT and AMO1 dTAG-CDK7WT cells after treatment with dTAG˅-1 by CTG and represented as fold change increase compared with time of seeding (T0). (C) Control and YKL-5-124–treated MM cells were subjected to global quantitative TMT-based proteomic and phosphoproteomic analyses. KSEA for prediction of kinase activity was applied to identify activated (green bars) and inhibited kinases (red bar) in the YKL-5-124–treated group compared with control cells. (D) Whole-cell lysates from H929 cells treated with several concentrations of YKL-5-124 for 24 hours were subjected to western blot (WB) analysis and probed with indicated antibodies, with GAPDH or tubulin as a loading control (left). The ratio of phosphorylated/total forms of indicated CDKs was analyzed with Image J software and represented as fold change from untreated cells. Mean values ± SD in 3 MM cell lines is shown in the graph (right). (E) Whole-cell lysates from H929 cells treated with several concentrations of YKL-5-124 for different times (1, 4, 6, and 16 hours) were subjected to WB analysis and probed with selected antibodies (upper). The ratio of phosphorylated/total RNA polymerase II was analyzed with Image J software and represented as fold change from untreated cells. Mean values ± SD in 3 MM cell lines is shown in the graph (lower). IC50, 50% inhibitory; KSEA, kinase-substrate enrichment analysis; PBMCs, peripheral blood mononuclear cells; PHA, phytohemagglutinin; SD, standard deviation; TMT, tandem mass tag; WT, wild type.
Figure 2.
Figure 2.
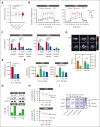
Impairment of T-loop phosphorylation by CDK7 inhibition causes cell cycle arrest and Rb activation in MM cells. (A) MM cell lines (n = 8) were treated with the indicated concentrations of YKL-5-124 for 24 hours. Cell cycle was evaluated by propidium iodide staining followed by flow cytometric analysis and analyzed with ModFit LT 5.0 software. (B) Whole-cell lysates from H929 and AMO1 cells treated with the indicated concentrations of YKL-5-124 for 24 hours were subjected to WB analysis and probed with antibodies against Rb and p-Rb, and GAPDH as a loading control. The ratio of phosphorylated/total forms of indicated Rb was analyzed with Image J software and represented as fold change from untreated cells. Mean values ± SD in 4 MM cell lines is shown in the graph. (C) H929 cells stably expressing E2F1 luciferase reporter were treated with 50 nM YKl-5-124 for 24 hours. E2F1 activity was assessed using the Promega luciferase reporter assay system, and fold change of E2F1 activity compared with untreated cells is displayed (mean ± SD). ∗∗∗P < .001. (D) H929 and AMO1 cells were treated with 250 nM YKL-5-124 for 24 hours, and the nuclear extract was analyzed by EMSA. The shifted probe caused by E2F1 binding is indicated by the band labeled E2F1. (E) H929 and AMO1 cells were treated with 500 nM YKL-5-124 for 24 hours and chromatin immunoprecipitated using E2F1 or control mouse IgG antibodies. The crosslinked DNA was subjected to quantitative polymerase chain reaction using primers specific for a representative set of E2F1 target genes. Data are represented as the percentage of input. (F) E2F score was calculated by using E2F1 genes identified previously. After RNA-seq normalization, we converted expression values for each gene to z scores, with a mean of 0 and SD of 1. After scaling the expression, we calculated the total score as the sum of scaled scores from all the genes. A Pearson correlation coefficient was calculated between E2F score and CDK7 expression. (G) AMO1 cells expressing control vector (PCW) or T121 were treated with doxycycline for 24 hours, followed by YKL-5-124 (500 nM) for 6 hours, and then chromatin immunoprecipitated using E2F1 or control mouse IgG antibodies. The crosslinked DNA was subjected to quantitative polymerase chain reaction using primers specific for a representative set of E2F1 target genes. Data are represented as the percentage of input. (H) AMO1 cells expressing either PCW or T121 plasmid were treated with doxycycline for 24 hours, followed by YKL-5-124 for 24 hours. The cell cycle was evaluated by propidium iodide staining followed by flow cytometric analysis. (I-J) MM cells expressing either control or T121 plasmid were treated with doxycycline for 24 hours followed by YKL-5-124 treatment for 48 hours. Cell viability was measured by CTG assay (I) and apoptosis by annexin V+ staining (J). Data represent the mean of 4 independent experiments. IgG, immunoglobulin G; SD, standard deviation.
Figure 3.
Figure 3.
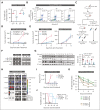
YKL-5-124 treatment disrupts oncogenic gene expression programs in MM. (A) Scatter plot visualizing gene set enrichment analysis normalized enrichment score comparisons between H929 and AMO1 cells treated with DMSO or YKL-5-124 (100 nM) for 24 hours. The bar graph shows NES for the top 18 gene signatures in both cell lines after treatment with YKL-5-124. (B) Biological upstream regulators associated with CDK7 inhibition were identified using ingenuity pathway analysis (IPA). (C) Whole-cell lysates from AMO1 and H929 cells treated with YKL-5-124 for 0.5 to 4 hours were subjected to WB analysis and probed with MYC antibody, with GAPDH as a loading control. The ratio of MYC/GAPDH was analyzed with Image J software and represented as fold change from untreated cells. Mean values ± SD in 2 MM cell lines is shown in the graph. (D) The diagram depicts the intermediates of glycolysis, and the enzymes regulated by CDK7 (red bars). Mean of log2-fold change for H929 and AMO1 cells after treatment with YKL-5-124 are shown (∗P < .05). (E) Bubble plot showing the differentially expressed proteins involved in the glycolytic pathway after treatment with YKL-5-124 for 24 hours. The x-axis displays the log2 (fold change), and the y-axis represents the negative log of the adjusted P value. (F) A panel of cells treated with YKL-5-124 for 24 hours was subjected to western blot analysis and probed with antibodies against HK2 and β-actin as a loading control (upper panel). The ratio of HK2/actin was analyzed with Image J software and represented as fold change from untreated cells (lower panel). Mean values ± SD in 5 MM cell lines are shown in the graph. (G) ChIP-seq tracks showing MYC signal on individual loci for LDHA and HK2. The x-axis shows genomic coordinates with gene model depicted below. The y-axis shows signal in units of rpm/bp. (H) MM1S cells were treated with YKL-5-124 for 6 hours and subjected to ChIP with a MYC or IgG antibody. HK2, LDHA, and a negative control region were amplified by polymerase chain reaction. Data are shown as mean ± SD of triplicates and represented as the percentage of input. bp, base pair; ChIP, chromatin immunoprecipitation; CHIP, clonal hematopoiesis of indeterminate potential; DMSO, dimethyl sulfoxide; FDR, false discovery rate; IgG, immunoglobulin G; NES, normalized enrichment score; rpm, units of reads per million; SD, standard deviation.
Figure 4.
Figure 4.
MYC-dependent aerobic glycolysis is impaired in CDK7-inhibited MM cells. (A) DepMap CRISPR screen (Avana library 18Q4) dependency data indicating that MM cell lines are among the most sensitive to HK2 depletion based on cell line rank. Mean of chronos scores for each disease type are shown in the graph. (B-C) H929 and AMO1 cells were treated with DMSO or YKL-5-124 and analyzed with a glycolysis stress assay on a Seahorse XFe96 extracellular flux analyzer. (B-C) ECAR was detected at baseline, after injection of glucose, oligomycin, and 2-deoxy-D-glucos e (2-DG). Basal glycolytic rate and spare glycolytic capacity were analyzed by overall ECAR in control and YKL-5-124–treated groups at different concentrations of YKL-5-124. (D) Representative 18F-FDG PET-computed tomography images (upper panel) and quantification (lower panel) of H929 cell xenografts in mice after treatment (10 mg/kg YKL-5-124 or vehicle, for 3 days). Bar graphs represent the SUV maximum and corresponding TV for mice. (E) LDH activity was measured in cell lysate from AMO1 cells treated with YKL-5-124 for 24 hours. (F) Culture supernatant (5 μL) from both untreated cells after 6 and 24 hours of culture, and 24 hour–treated cells was used to measure lactate secretion using Lactate-Glo assay. (G) H929 and AMO1 cells were transduced with empty vector or HK2-overexpression vector and subjected to western blot analysis or treated with YKL-5-124 for 72 hours for cell killing assessment. IC50 values are shown in the graph. (H) H929 and AMO1 cells were cultured in glucose or galactose (10 mM) media for a week and treated with DMSO or increasing concentrations of YKL-5-124. Cellular viability was determined by CTG assay. (I) Three MM cell lines (H929, AMO1, and MM1S) were cultured in the presence of different concentrations of YKL-5-124 with or without bortezomib (2.5 nM), lenalidomide (5 μM), melphalan (2.5 μM), or carfilzomib (1 nM), and cell survival was assessed by CTG. Data are presented as CI values evaluated using the Calcusyn software. CI, combination index; DMSO, dimethyl sulfoxide; ECAR, extracellular acidification rate; IC50, 50% inhibitory; PET, positron emission tomography; SUV, standardized uptake value; TV, tumor volume.
Figure 5.
Figure 5.
CDK7 inhibition reduces myeloma burden and enhances survival in vivo mouse models of MM. (A) BMMNC from 3 patients with relapsed MM were treated with 500 nM YKL-5-124 or DMSO for 24 hours. Cell viability in the CD138+ and CD138 cell populations was evaluated by flow cytometry analysis. (B) Primary CD138+ cells were cultured in the absence or presence of YKL-5-124 for 3 days, and apoptotic cell death was assessed by flow cytometric analysis. Percentages of annexin V+/DAPI (early apoptosis) and annexin V+/DAPI+ (late apoptosis) cells are shown in the graphs. (C) A schematic diagram for the subcutaneous SCID model. (D) In the early treatment model, mice injected with H929 cells were randomized and treated with either YKL-5-124 or vehicle at first detection of tumor (tumor volume ∼100 mm3). Mice received 3 different doses of YKL-5-124 for 5 consecutive days per week for 2 weeks. Tumor volume was measured in 2 perpendicular dimensions by caliper once every week. Baseline values were not significantly different among groups. (E) Sublethally irradiated SCID mice were injected subcutaneously with AMO1 cells expressing CDK7WT (left) or CDK7C312S (right). Mice were randomized to a 5 or 10 mg/kg group, for 5 consecutive days per week for 2 weeks. Tumor volume was evaluated by caliper measurement. P values indicate significant difference between groups. ∗∗∗P < .001. (F) Western blot analysis was performed in cell lysates from tumors excised from representative mice and blotted with Rb and p-Rb antibodies. (G) Western blot analysis was performed in cell lysates from tumors excised from representative mice and blotted with indicated antibodies. Images were analyzed with Image J software and signals normalized to loading control. (H-J) NSG mice were orthotopically xenografted after intravenous injection with Molp8-luc cells. Upon detection of MM lesions (∼2 weeks after tumor cell injection), mice were randomly assigned to receive YKL-5-124 (2.5 or 5 mg/kg, intraperitoneal, 5 days per week, for 4 weeks) or vehicle control. Whole-body bioluminescence images (BLI) (H) and measurements (mean ± SEM) (I) are shown. Survival was evaluated from the first day of treatment until death. Survival curves (Kaplan-Meier) were analyzed using GraphPad analysis software (log-rank test, P = .0002) (J). (K) Monoclonal, tumor-derived, immunoglobulin (M-protein) levels were evaluated in MM-bearing Vk∗MYC mice before and after YKL-5-124 treatment (5 and 10 mg/kg) and normalized to time 0. BMMNC, bone marrow mononuclear cells; DMSO, dimethyl sulfoxide; NSG, NOD/SCID-γ; SCID, severe combined immunodeficiency.

Comment in

References

    1. Deshpande A, Sicinski P, Hinds PW. Cyclins and cdks in development and cancer: a perspective. Oncogene. 2005;24(17):2909–2915. - PubMed
    1. Tiedemann RE, Mao X, Shi CX, et al. Identification of kinetin riboside as a repressor of CCND1 and CCND2 with preclinical antimyeloma activity. J Clin Invest. 2008;118(5):1750–1764. - PMC - PubMed
    1. Ramanathan Y, Rajpara SM, Reza SM, et al. Three RNA polymerase II carboxyl-terminal domain kinases display distinct substrate preferences. J Biol Chem. 2001;276(14):10913–10920. - PubMed
    1. Glover-Cutter K, Larochelle S, Erickson B, et al. TFIIH-associated Cdk7 kinase functions in phosphorylation of C-terminal domain Ser7 residues, promoter-proximal pausing, and termination by RNA polymerase II. Mol Cell Biol. 2009;29(20):5455–5464. - PMC - PubMed
    1. Wang Y, Zhang T, Kwiatkowski N, et al. CDK7-dependent transcriptional addiction in triple-negative breast cancer. Cell. 2015;163(1):174–186. - PMC - PubMed

Publication types

MeSH terms

Substances