Development of Expert-Level Classification of Seizures and Rhythmic and Periodic Patterns During EEG Interpretation
- PMID: 36878708
- PMCID: PMC10136013
- DOI: 10.1212/WNL.0000000000207127
Development of Expert-Level Classification of Seizures and Rhythmic and Periodic Patterns During EEG Interpretation
Erratum in
-
Correction to Author Disclosures.Neurology. 2024 Dec 24;103(12):e210123. doi: 10.1212/WNL.0000000000210123. Epub 2024 Nov 21. Neurology. 2024. PMID: 39571126 Free PMC article. No abstract available.
Abstract
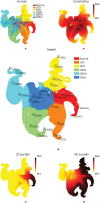
Background and objectives: Seizures (SZs) and other SZ-like patterns of brain activity can harm the brain and contribute to in-hospital death, particularly when prolonged. However, experts qualified to interpret EEG data are scarce. Prior attempts to automate this task have been limited by small or inadequately labeled samples and have not convincingly demonstrated generalizable expert-level performance. There exists a critical unmet need for an automated method to classify SZs and other SZ-like events with expert-level reliability. This study was conducted to develop and validate a computer algorithm that matches the reliability and accuracy of experts in identifying SZs and SZ-like events, known as "ictal-interictal-injury continuum" (IIIC) patterns on EEG, including SZs, lateralized and generalized periodic discharges (LPD, GPD), and lateralized and generalized rhythmic delta activity (LRDA, GRDA), and in differentiating these patterns from non-IIIC patterns.
Methods: We used 6,095 scalp EEGs from 2,711 patients with and without IIIC events to train a deep neural network, SPaRCNet, to perform IIIC event classification. Independent training and test data sets were generated from 50,697 EEG segments, independently annotated by 20 fellowship-trained neurophysiologists. We assessed whether SPaRCNet performs at or above the sensitivity, specificity, precision, and calibration of fellowship-trained neurophysiologists for identifying IIIC events. Statistical performance was assessed by the calibration index and by the percentage of experts whose operating points were below the model's receiver operating characteristic curves (ROCs) and precision recall curves (PRCs) for the 6 pattern classes.
Results: SPaRCNet matches or exceeds most experts in classifying IIIC events based on both calibration and discrimination metrics. For SZ, LPD, GPD, LRDA, GRDA, and "other" classes, SPaRCNet exceeds the following percentages of 20 experts-ROC: 45%, 20%, 50%, 75%, 55%, and 40%; PRC: 50%, 35%, 50%, 90%, 70%, and 45%; and calibration: 95%, 100%, 95%, 100%, 100%, and 80%, respectively.
Discussion: SPaRCNet is the first algorithm to match expert performance in detecting SZs and other SZ-like events in a representative sample of EEGs. With further development, SPaRCNet may thus be a valuable tool for an expedited review of EEGs.
Classification of evidence: This study provides Class II evidence that among patients with epilepsy or critical illness undergoing EEG monitoring, SPaRCNet can differentiate (IIIC) patterns from non-IIIC events and expert neurophysiologists.
© 2023 American Academy of Neurology.
Conflict of interest statement
The authors report no disclosures relevant to the manuscript. Go to
Figures


Comment in
-
Putting the "Big" in Big Data: Learning to Be Just as (Un)certain as a Clinician at EEG.Neurology. 2023 Apr 25;100(17):799-800. doi: 10.1212/WNL.0000000000207224. Epub 2023 Mar 6. Neurology. 2023. PMID: 36878700 No abstract available.
References
-
- Chong DJ, Hirsch LJ. Which EEG patterns warrant treatment in the critically ill? Reviewing the evidence for treatment of periodic epileptiform discharges and related patterns. J Clin Neurophysiol. 2005;22(2):79-91. - PubMed
Publication types
MeSH terms
Grants and funding
- R01 NS062092/NS/NINDS NIH HHS/United States
- UL1 TR001863/TR/NCATS NIH HHS/United States
- R01 NS102190/NS/NINDS NIH HHS/United States
- RF1 NS120947/NS/NINDS NIH HHS/United States
- R01 HL161253/HL/NHLBI NIH HHS/United States
- P20 GM130447/GM/NIGMS NIH HHS/United States
- R01 NS102574/NS/NINDS NIH HHS/United States
- R01 AG029289/AG/NIA NIH HHS/United States
- R01 NS107291/NS/NINDS NIH HHS/United States
- K24 NS088568/NS/NINDS NIH HHS/United States
- R01 NS111022/NS/NINDS NIH HHS/United States
- RF1 AG064312/AG/NIA NIH HHS/United States
- R01 NS126282/NS/NINDS NIH HHS/United States
LinkOut - more resources
Full Text Sources
Medical
Research Materials
