. 2023 May;130(5):302-311.
doi: 10.1038/s41437-023-00603-y. Epub 2023 Mar 6.

Genetic variation of morphological scaling in Drosophila melanogaster

Affiliations

Genetic variation of morphological scaling in Drosophila melanogaster

Austin S Wilcox et al. Heredity (Edinb). 2023 May.

Abstract

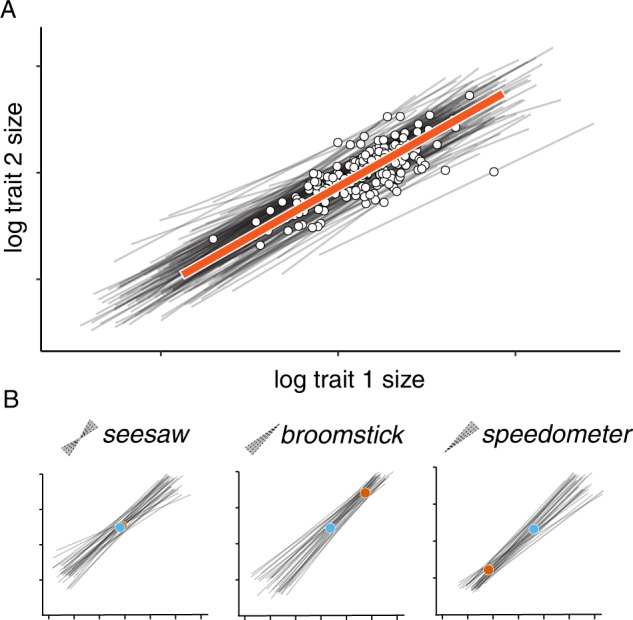
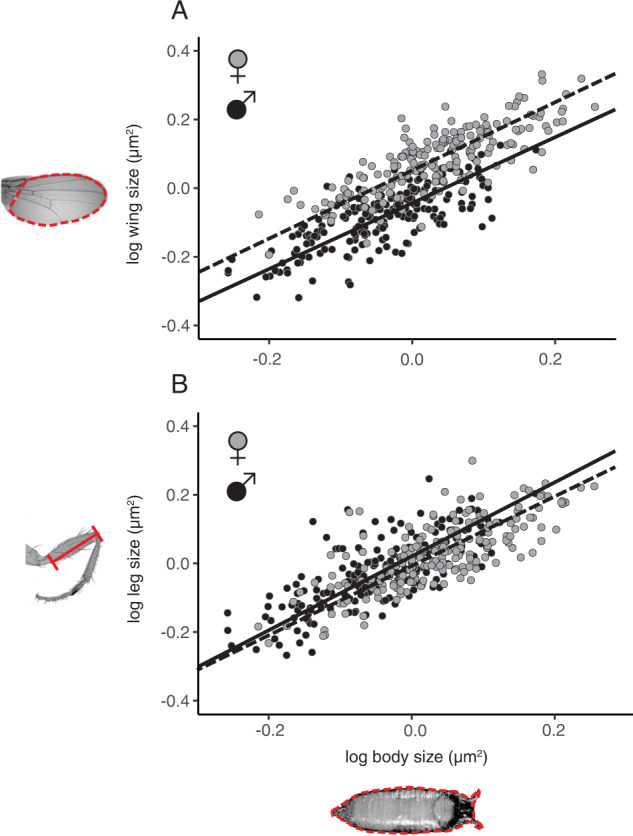
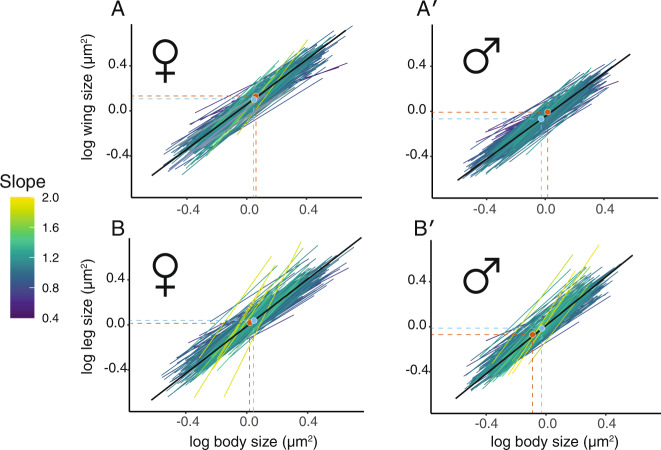
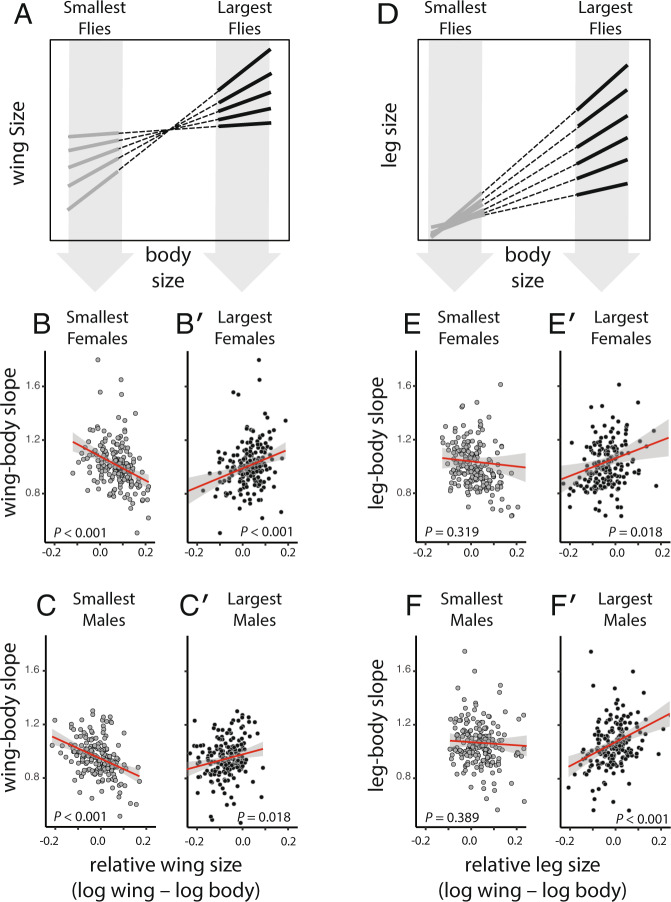
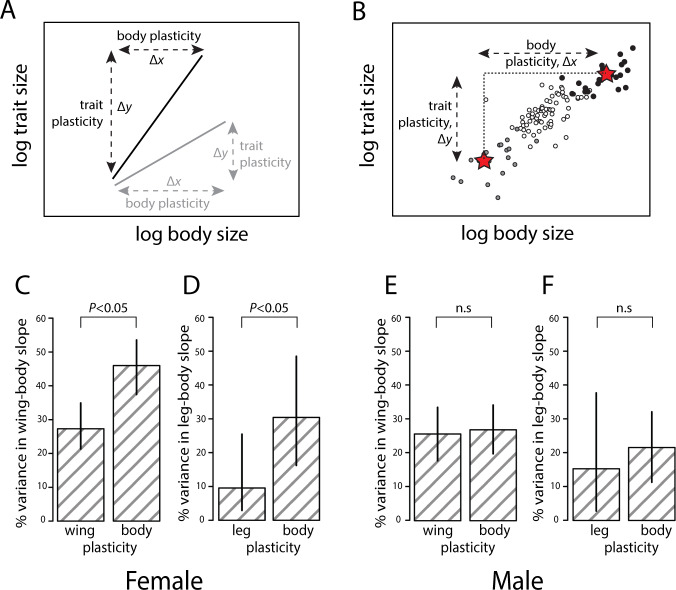
Morphological scaling relationships between the sizes of individual traits and the body captures the characteristic shape of a species, and their evolution is the primary mechanism of morphological diversification. However, we have almost no knowledge of the genetic variation of scaling, which is critical if we are to understand how scaling evolves. Here we explore the genetics of population scaling relationships (scaling relationships fit to multiple genetically-distinct individuals in a population) by describing the distribution of individual scaling relationships (genotype-specific scaling relationships that are unseen or cryptic). These individual scaling relationships harbor the genetic variation in the developmental mechanisms that regulate trait growth relative to body growth, and theoretical studies suggest that their distribution dictates how the population scaling relationship will respond to selection. Using variation in nutrition to generate size variation within 197 isogenic lineages of Drosophila melanogaster, we reveal extensive variation in the slopes of the wing-body and leg-body individual scaling relationships among genotypes. This variation reflects variation in the nutritionally-induced size plasticity of the wing, leg, and body. Surprisingly, we find that variation in the slope of individual scaling relationships primarily results from variation in nutritionally-induced plasticity of body size, not leg or wing size. These data allow us to predict how different selection regimes affect scaling in Drosophila, and is the first step in identifying the genetic targets of such selection. More generally, our approach provides a framework for understanding the genetic variation of scaling, an important prerequisite to explaining how selection changes scaling and morphology.


Conflict of interest statement

The authors declare no competing interests.

Figures

Fig. 1
Fig. 1. Individual and population scaling relationships.
A Individual scaling relationships (thin gray lines) result from variation in body size due to variation in a single environmental or genetic factor, with all other size-regulatory factors held constant. However, because each individual has a single genotype and is exposed to a single combination of environmental factors, it occupies only a single point on its individual scaling relationship (white circles). The observed population scaling relationship (red line) is the scaling relationship among individuals in a population. B The distribution of individual scaling relationships determines how the population scaling relationship responds to selection (Frankino et al. 2019), and can be classified as speedometer, broomstick, or seesaw, depending on where the median point of intersection (green circle) lies relative to the bivariate mean of trait sizes (yellow circle).
Fig. 2
Fig. 2. The population scaling relationships of the wing and leg size against body size in Drosophila melanogaster.
A The wing-body population scaling relationship. B. The leg-body population scaling relationship. Points show the mean wing/leg/body size of all flies in each lineage (females: gray points; males: black points). Lines show the mean population scaling relationship, generated by sampling a single individual from each lineage, fitting the MA regression, and repeating 10,000 times by sex (females: broken lines; males: solid lines). For both wing-body and leg-body scaling relationships, there is a significant difference in intercept but not slope between females (gray) and males (black) (Table 1). The measurements taken are shown in red on the images of the wing, leg and pupa.
Fig. 3
Fig. 3. Distribution of individual scaling relationships among isogenic fly lineages.
The distribution of wing-body individual scaling relationships in females (A) and males (A′). Males have proportionally smaller wings and shallower slopes than females (Table 1). The distribution of leg-body individual scaling relationships in females (B) and males (B′). Males have proportionally larger legs and steeper slopes than females (Table 1). The steepness of the slope is indicated by color (blue = shallow, yellow = steep). The blue circle shows the bivariate mean of trait-body size. The red circle shows the median point of intersection (MPI) for the lines. The black line is the mean individual scaling relationship across all lineages. All the scaling relationships were fit using MA model II regression and extend two standard deviations above and below the mean body size for each lineage.
Fig. 4
Fig. 4. The relationship between mean relative wing and leg size and the slope of individual scaling relationships among isogenic fly lineages.
A For a seesaw distribution of individual cryptic scaling relationships (dashed lines), among the largest individuals (black lines), there should be a positive correlation between the mean relative wing size for a lineage and the slope of the lineage’s individual scaling relationship, whereas this relationship should be negative among the smallest individuals (gray lines). B, C For both females (B, B′) and males (C, C′), there was a significant positive relationship between relative wing size for the largest 25% of individuals in each lineage and slope of the lineage’s individual wing-body scaling relationship (B′, C′, black points: OLS model I regression: slope = relative wing size, F1,192 > 5.702, p < 0.0179 for both), and a significant negative relationship between relative wing size for the smallest 25% of individuals in each lineage, and slope (B, C, gray points: OLS model I regression: slope = relative wing size, F1,192 > 32.04, p < 0.001 for both). D For a speedometer distribution of individual scaling relationships (dashed lines), for the largest individuals (black lines), there should be a positive correlation between their mean relative wing size in each lineage and the slope of the lineage’s individual scaling relationship, whereas this relationship should be weaker or absent among the smallest individuals (gray lines). E, F For both females (E, E′) and males (F, F′), there was a significant positive relationship between relative leg size for the largest 25% of individuals in each lineage, and slope of the lineage’s individual leg-body scaling relationship (E′, F′, black points: OLS model I regression: slope = relative leg size, F1,192 > 5.811, p < 0.017 for both), but no relationship between relative wing size for the smallest 25% of individuals in each lineage, and slope (E, F: OLS model I regression: slope = relative leg size, F1,192 < 0.997, p > 0.319 for both).
Fig. 5
Fig. 5. Variation in slope among lineages reflects variation in wing-, leg- and body-size plasticity.
A The slope of an individual nutritional scaling relationship reflects the nutritional plasticity of body size relative to trait size, and variation in either or both generates variation among slopes. B We used the differences in mean body/wing/leg size (red stars) between the largest (black points) and smallest (white points) 20% of flies in each lineage as a measure of plasticity. Variation in the slope of the wing-body (C) and leg-body (D) scaling relationship is primarily due to variation in body-size plasticity in females. Variation in the slope of the wing-body (E) and leg-body (F) scaling relationship is due to variation in both wing/leg-size and body-size plasticity in males. Percent variance was calculated by first fitting a multiple regression of slope against trait- and body-size plasticity among lineages, and then calculating the relative importance of each regressor using Lindeman, Merenda and Gold’s method. Error bars are 95% confidence intervals determined using 1000 bootstraps of the data.

References

    1. Baker RH, Wilkinson GS. Phylogenetic analysis of sexual dimorphism and eye-span allometry in stalk-eyed flies (Diopsidae) Evolution. 2001;55:1373–1385. - PubMed
    1. Bates D, Mächler M, Bolker B, Walker S (2015). Fitting Linear Mixed-Effects Models Using lme4. J Stat Softw 67
    1. Bolstad GH, Cassara JA, Márquez E, Hansen TF, Linde K, van der, Houle D, et al. Complex constraints on allometry revealed by artificial selection on the wing of Drosophila melanogaster. Proc Natl Acad Sci USA. 2015;112:13284–13289. doi: 10.1073/pnas.1505357112. - DOI - PMC - PubMed
    1. Bryant PJ, Schmidt O. The genetic control of cell proliferation in Drosophila imaginal discs. J Cell Sci. 1990;1990:169–189. doi: 10.1242/jcs.1990.Supplement_13.16. - DOI - PubMed
    1. Casasa S, Moczek AP. Insulin signalling’s role in mediating tissue-specific nutritional plasticity and robustness in the horn-polyphenic beetle Onthophagus taurus. Proc Biol Sci. 2018;285:20181631. - PMC - PubMed

Publication types

LinkOut - more resources