. 2023 Mar 6;13(1):3704.
doi: 10.1038/s41598-023-30733-6.

Ex vivo expansion of circulating tumour cells (CTCs)

Affiliations

Ex vivo expansion of circulating tumour cells (CTCs)

Bashir M Mohamed et al. Sci Rep. .

Abstract

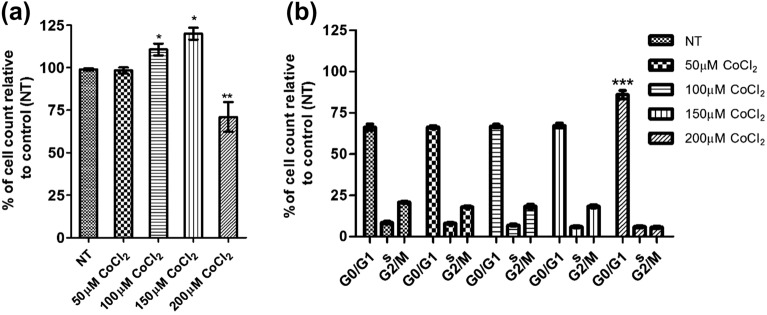
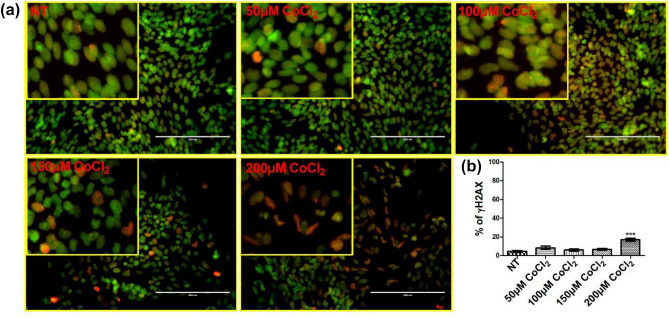
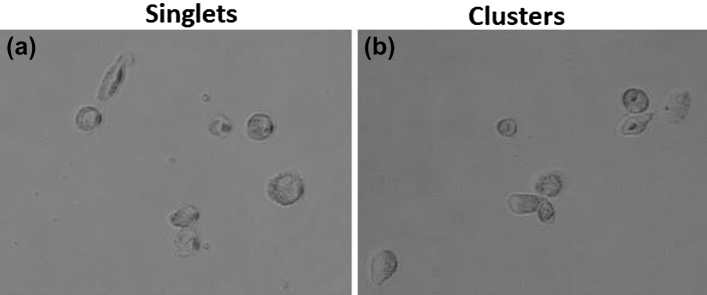
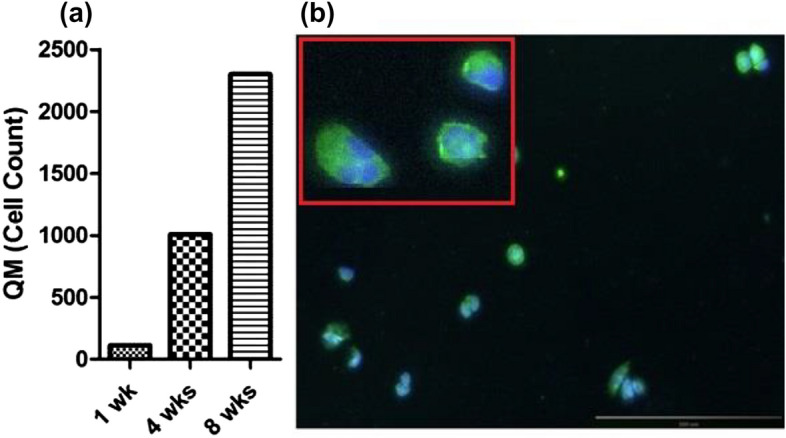
Circulating tumour cells (CTCs) are a critical intermediate step in the process of cancer metastasis. The reliability of CTC isolation/purification has limited both the potential to report on metastatic progression and the development of CTCs as targets for therapeutic intervention. Here we report a new methodology, which optimises the culture conditions for CTCs using primary cancer cells as a model system. We exploited the known biology that CTCs thrive in hypoxic conditions, with their survival and proliferation being reliant on the activation of hypoxia-inducible factor 1 alpha (HIF-1α). We isolated epithelial-like and quasi-mesenchymal CTC phenotypes from the blood of a cancer patient and successfully cultured these cells for more than 8 weeks. The presence of CTC clusters was required to establish and maintain long-term cultures. This novel methodology for the long-term culture of CTCs will aid in the development of downstream applications, including CTC theranostics.


Conflict of interest statement

The authors declare no competing interests.

Figures

Figure 1
Figure 1
Effect of CoCl2 on HIF-1α protein abundance. Primary ovarian cancer cells were incubated with different concentrations of CoCl2 (50,100, 150 and 200 µM) for 48 h. Cell lysates were collected and HIF‐1α protein was determined by ELISA. Data is presented as mean ± SEM (n = 3) and was analysed using one‐way ANOVA with Tukey’s post-hoc test, with respect to the corresponding not treated controls (NT), and statistically significant data is reported by *** for p < 0.001, ** for p < 0.01 and NS for not significant.
Figure 2
Figure 2
Effect of CoCl2 on cell viability and cell cycle. Primary ovarian cancer cells were either not treated (NT) or treated with different concentrations of CoCl2 (50,100,150 and 200 µM) for 48 h. Cells were stained with Hoechst 33342 and scanned and analysed using the Cytell imaging system and Cell Cycle BioApp software. (a) Viable cells were automatically counted and data were presented as mean ± SEM (n = 3) and were analysed using one‐way ANOVA with Tukey’s post-hoc test, “*”p < 0.05. (b) Cell cycle distribution was analysed using the cell cycle Bioapplication. Data were presented as mean ± SEM (n = 3). 2-way ANOVA with Bonferroni post-test analysis was carried out on the experimental data, with respect to the corresponding controls, and statistically, significant data is reported by *for p < 0.05; ** for p < 0.01 and *** for p < 0.001.
Figure 3
Figure 3
Gamma‐H2AX immunofluorescence staining. Primary ovarian cancer cells were incubated with various concentrations of CoCl2 (50,100,150 and 200 µM) for 48 h. (a) Cells were stained with Hoechst 33342 (Green) and γ‐H2AX (red) and then five microscopic fields per well were scanned and analysed using the Cytell imaging system. (b) The number of γ‐H2AX stained cells were automatically counted and data presented as mean ± SEM (n = 3). Data was analysed using one‐way ANOVA with Tukey’s post-test analysis relative to corresponding not treated controls (NT), ***p < 0.001.
Figure 4
Figure 4
Influence of CoCl2 on EpCAM and HER2 expression in primary ovarian cancer cells. Cells were incubated with (50,100,150 and 200 µM) CoCl2 for 48 h. Cells were stained either with anti-EpCAM (a,b) or anti-HER2 (c,d). Five microscopic fields per well were scanned and analysed and the expression level was performed using the Cytell imaging system and IN Cell Investigator image analysis software (e,f). Data is presented as mean ± SEM (n = 3). One-way ANOVA with Tukey’s post-hoc test was carried out, with respect to the corresponding not treated controls (NT), and statistically significant data was reported by * for p < 0.05.
Figure 5
Figure 5
Brightfield images of isolated CTCs. (a) CTC singlets and (b) CTC clusters were captured and isolated from a breast cancer patient using the ScreenCell device. Images were taken with an inverted microscope (20×).
Figure 6
Figure 6
Quasi-mesenchymal (QM) cells derived from a breast cancer patient blood sample. (a) The figure illustrates the number of QM cells cultured over time (1wk, 4 wks and 8 wks) as measured using a haemocytomer. (b) Immunostaining revealed that these cells express HER2 at 8 weeks. Cells were counterstained with Hoechst 33342, blue for visualisation of cell nuclei. Imaging was performed using an inverted microscope (10×).
Figure 7
Figure 7
Characterisation of Epithelial-Like CTCs derived from the blood of a breast cancer patient. The figure illustrates the number of CTCs grown over time (1 wk, 4 wks and 8 wks) in culture as measured by hemocytometry. (b) Immunostaining revealed that epithelial-like CTCs express EpCAM at 8 weeks. Cells were stained with Hoechst 33342, blue for nuclear visualisation. Imaging was performed using an inverted microscope (10×).
Figure 8
Figure 8
Iimmunofluorescent staining of isolated CTCs captured and isolated from an ovarian cancer patient using the ScreenCell device, (a,b). CTCs were immunofluorescently stained for (a) Hoechst, (b) EpCam (green). Ovarian cancer cells isolated from ascites of ovarian cancer patients, (c,d) . These cells were co-cultured with PBMCs. Following that, cells were fixed in 3% PFA, gently washed with PBS, and probed with anti-EpCam and anti-CD45 antibodies. Our results showed that only cancer cells were EpCam positive (green), while PBMCs were only positively stained with PE-conjugated anti-CD45 antibody (red), and cells were also stained with Hoechst 33342, (blue) for nuclear visualisation. Images were taken with an inverted microscope (10×).

References

    1. Chaffer CL, Weinberg RA. A perspective on cancer cell metastasis. Science. 2011;331:1559–1564. - PubMed
    1. Aceto N, et al. Circulating tumor cell clusters are oligoclonal precursors of breast cancer metastasis. Cell. 2014;158:1110–1122. - PMC - PubMed
    1. Ward MP, et al. Platelets, immune cells and the coagulation cascade; friend or foe of the circulating tumour cell? Mol. Cancer. 2021;20:59. - PMC - PubMed
    1. Alix-Panabières C, Pantel K. Challenges in circulating tumour cell research. Nat. Rev. Cancer. 2014;14:623–631. - PubMed
    1. Aceto N, Toner M, Maheswaran S, Haber DA. En route to metastasis: Circulating tumor cell clusters and epithelial-to-mesenchymal transition. Trends Cancer. 2015;1:44–52. - PubMed

Publication types