. 2023 Nov;41(11):1557-1566.
doi: 10.1038/s41587-023-01685-z. Epub 2023 Mar 6.

Microfluidics-free single-cell genomics with templated emulsification

Affiliations

Microfluidics-free single-cell genomics with templated emulsification

Iain C Clark et al. Nat Biotechnol. 2023 Nov.

Abstract

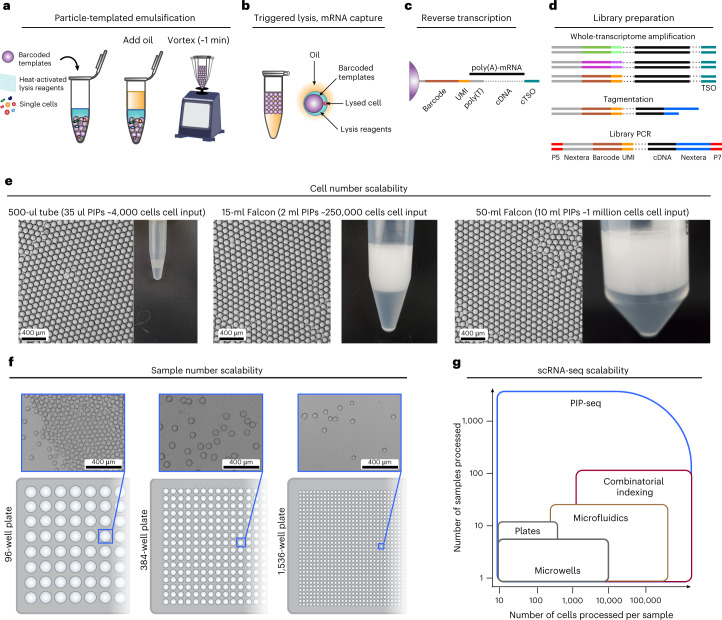
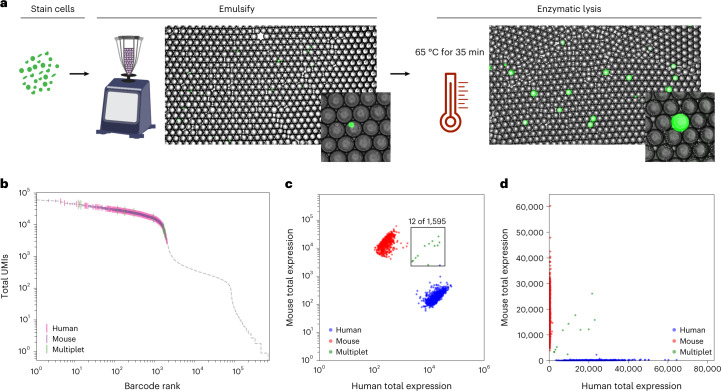
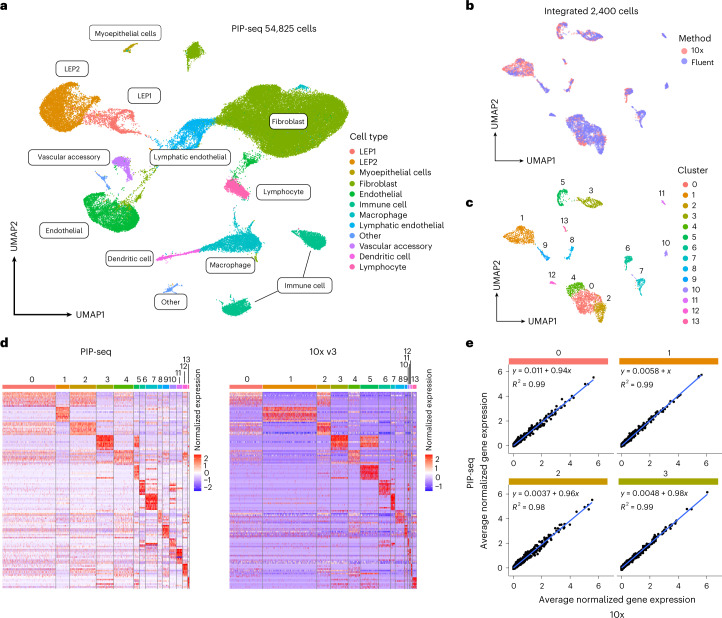
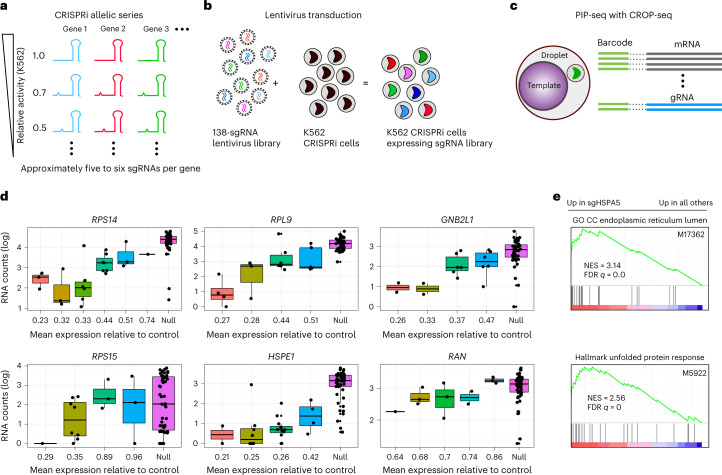
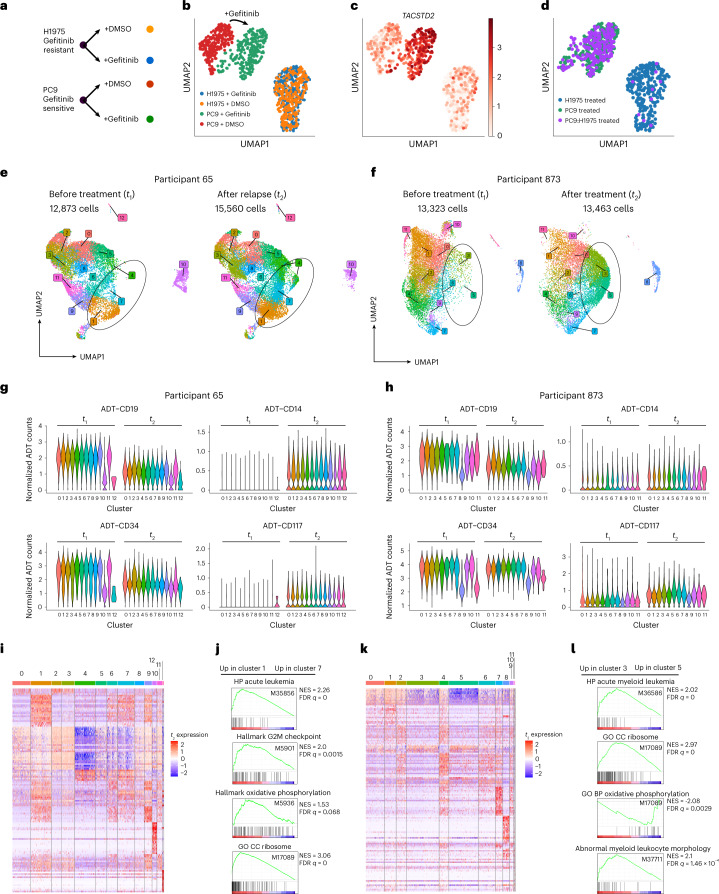
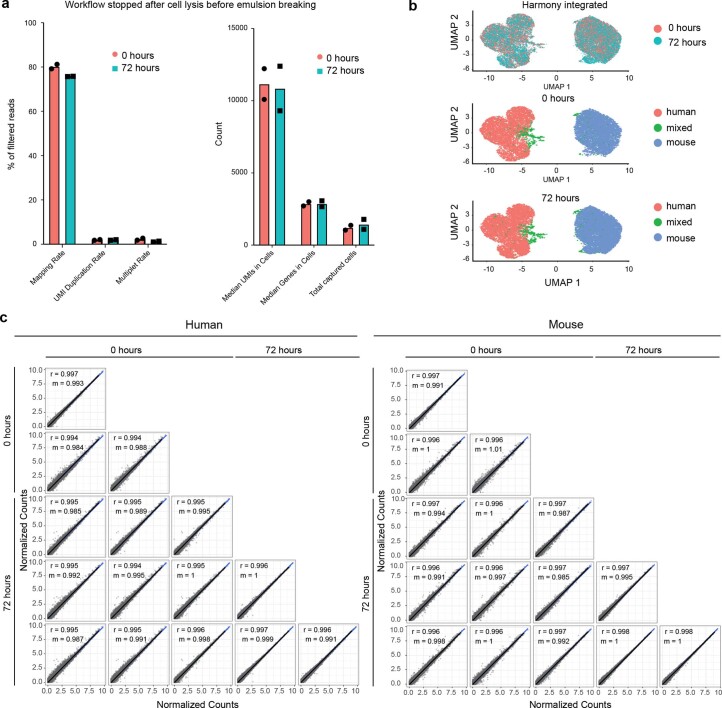
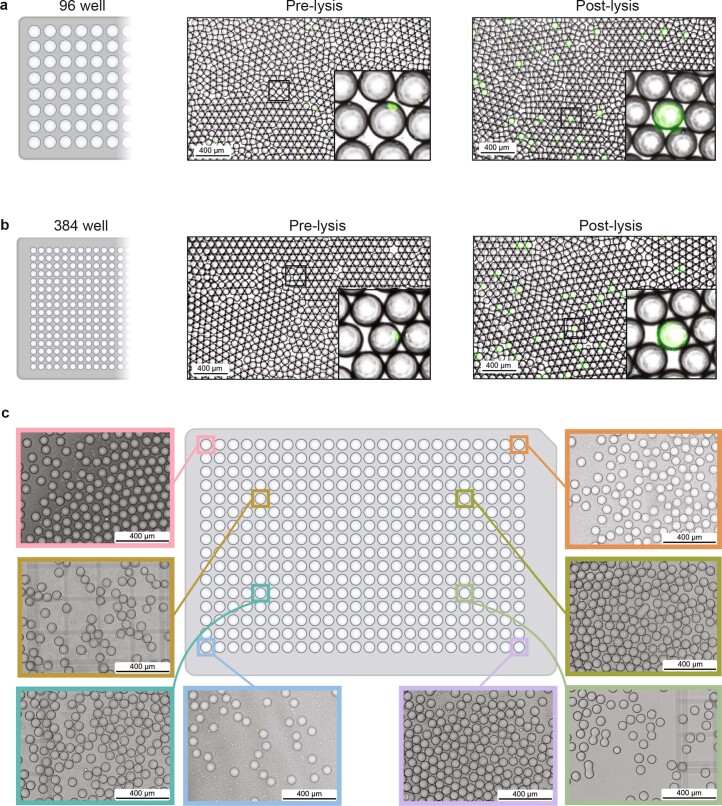
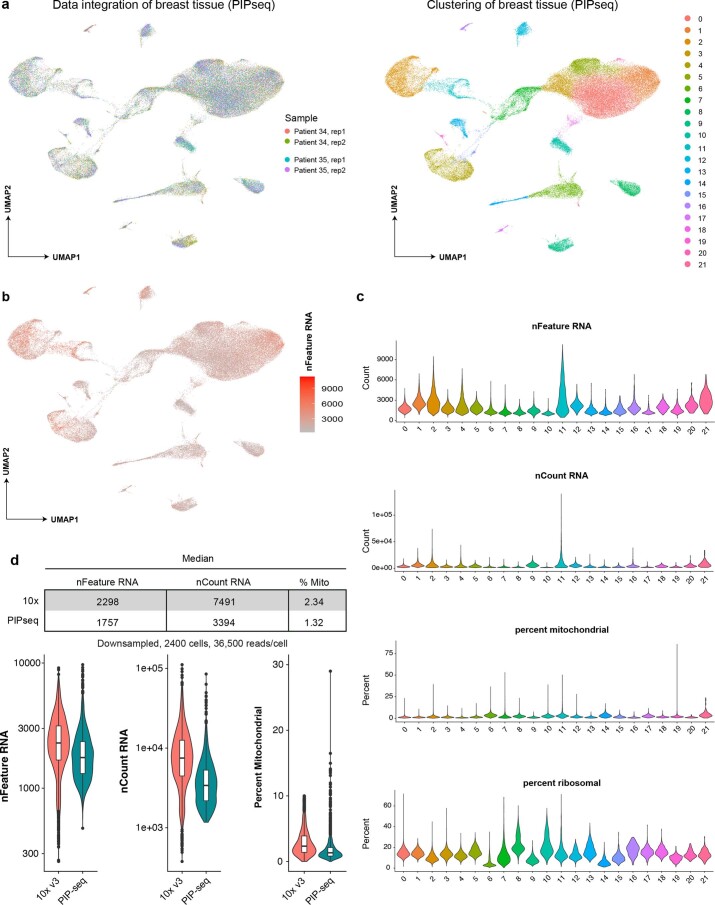
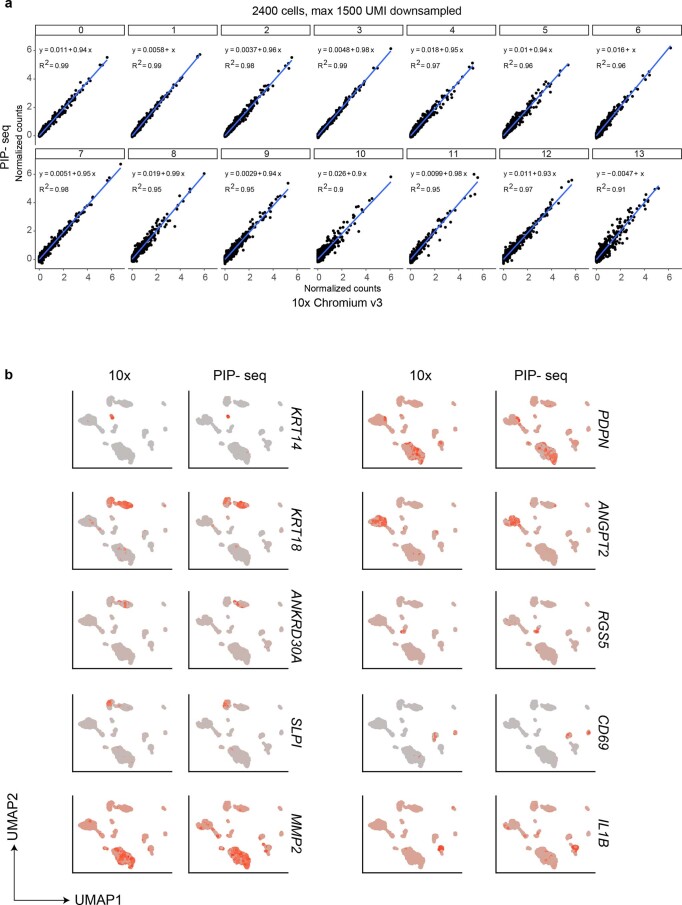
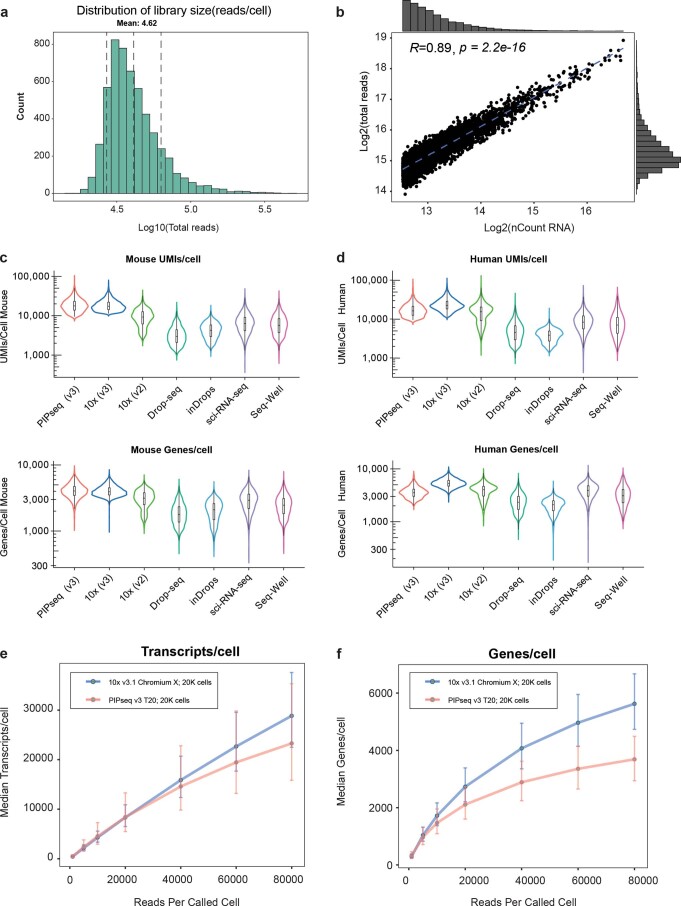
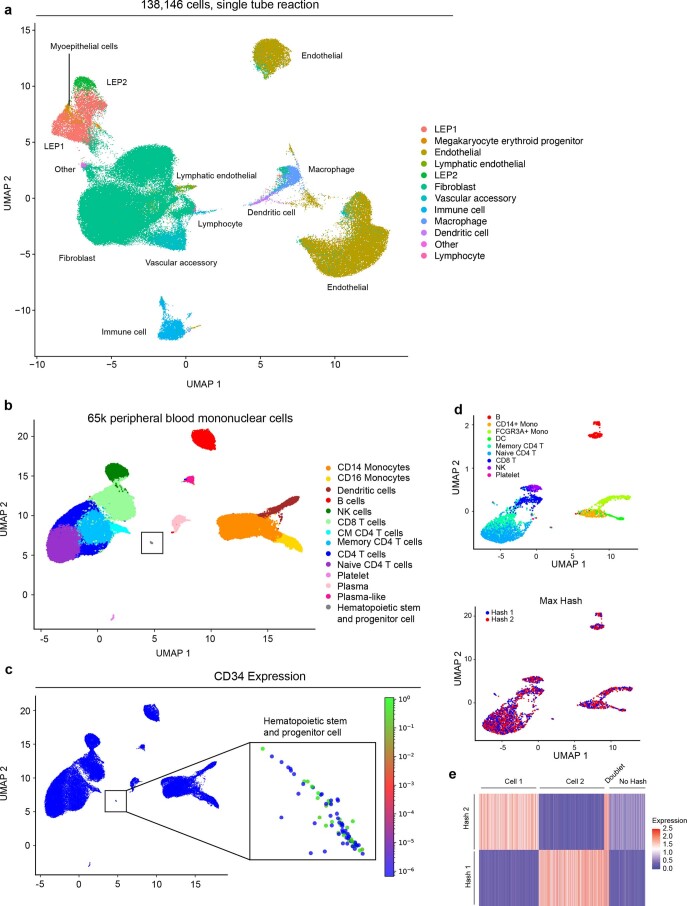
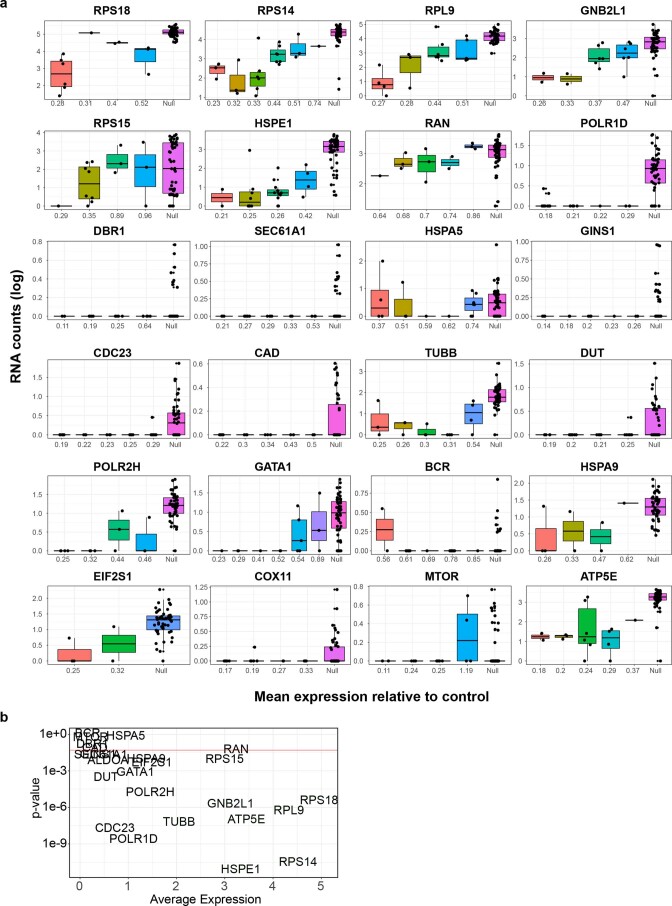
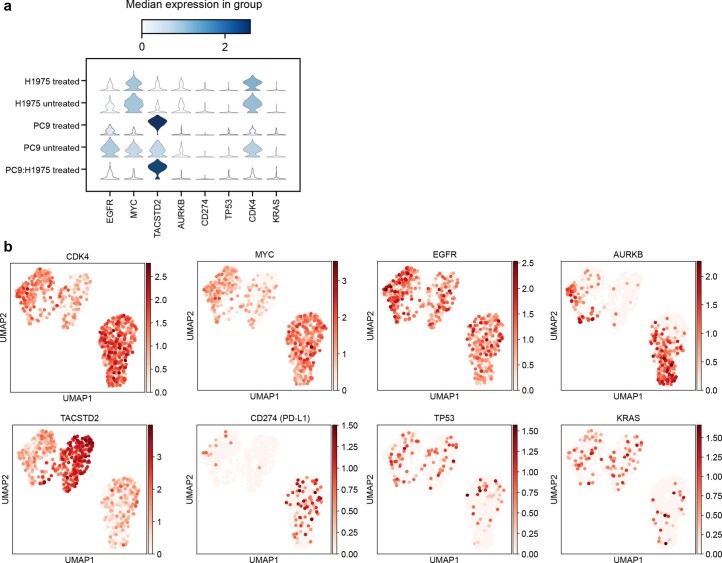
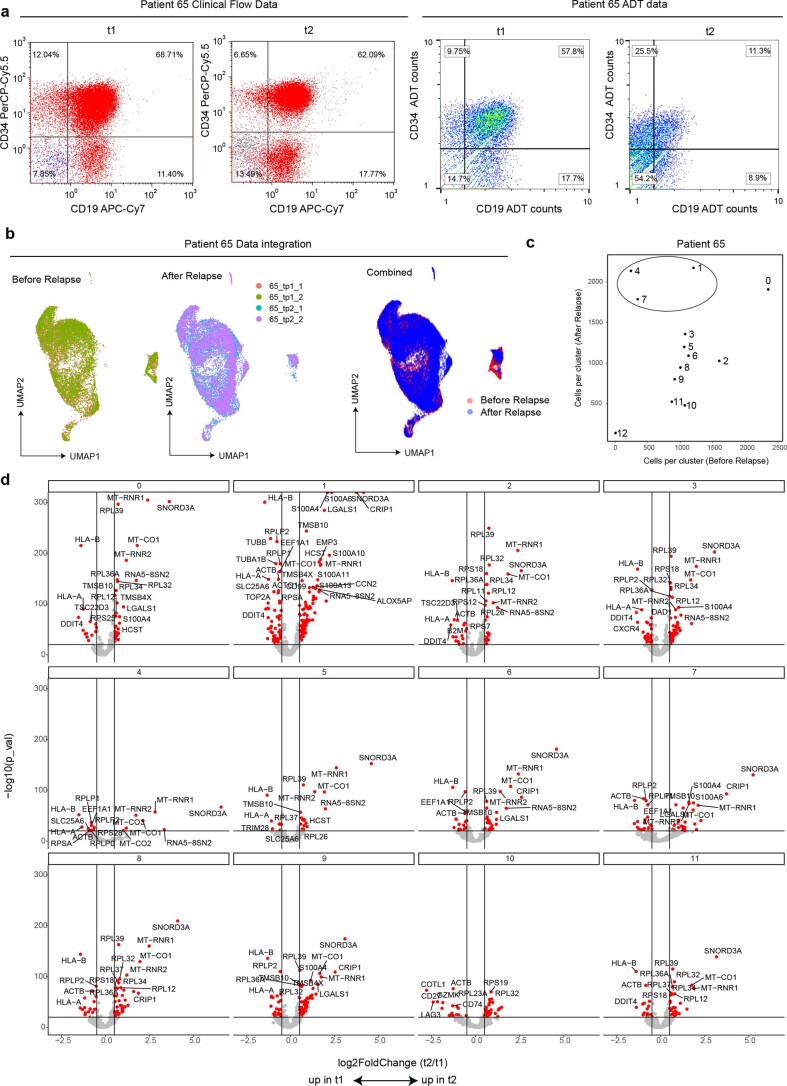
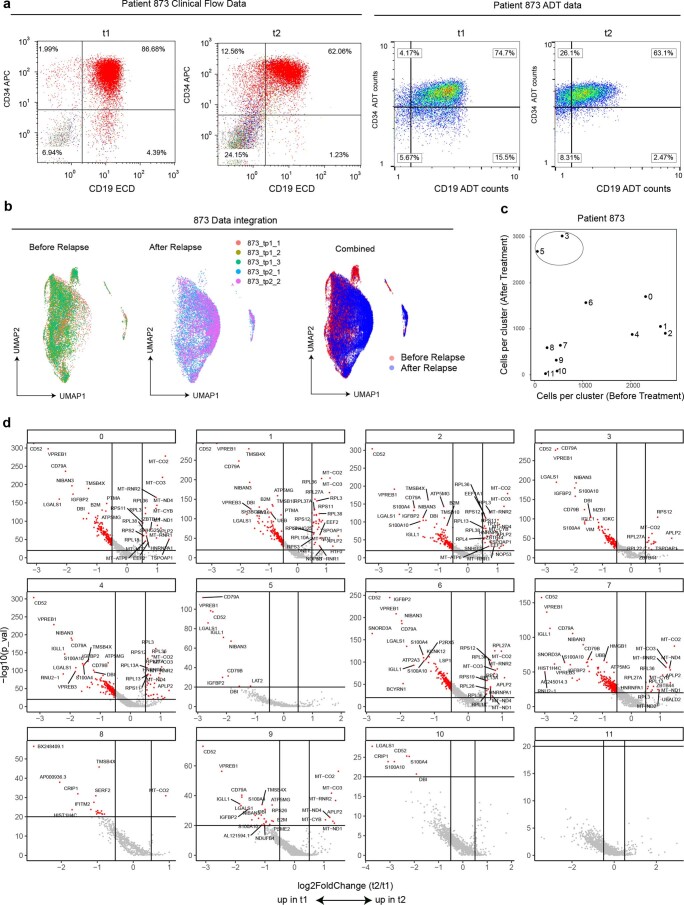
Current single-cell RNA-sequencing approaches have limitations that stem from the microfluidic devices or fluid handling steps required for sample processing. We develop a method that does not require specialized microfluidic devices, expertise or hardware. Our approach is based on particle-templated emulsification, which allows single-cell encapsulation and barcoding of cDNA in uniform droplet emulsions with only a vortexer. Particle-templated instant partition sequencing (PIP-seq) accommodates a wide range of emulsification formats, including microwell plates and large-volume conical tubes, enabling thousands of samples or millions of cells to be processed in minutes. We demonstrate that PIP-seq produces high-purity transcriptomes in mouse-human mixing studies, is compatible with multiomics measurements and can accurately characterize cell types in human breast tissue compared to a commercial microfluidic platform. Single-cell transcriptional profiling of mixed phenotype acute leukemia using PIP-seq reveals the emergence of heterogeneity within chemotherapy-resistant cell subsets that were hidden by standard immunophenotyping. PIP-seq is a simple, flexible and scalable next-generation workflow that extends single-cell sequencing to new applications.


Conflict of interest statement

A.R.A. filed a patent related to templated emulsification and is a founder of Fluent Biosciences. I.C.C. consults for Fluent Biosciences and is on its Scientific Advisory Board. K.M.F., R.H.M., Y.X., C.H., A.O., P.H., J.S.A.I., J.Q.Z., A.M.-Z. and C.D.A. are employees at Fluent Biosciences and are working to commercialize the PIP-seq technology. M.J. consults for Maze Therapeutics and Gate Biosciences. J.M.R. consults for Maze Therapeutics and Waypoint Bio. J.S.W. declares outside interest in 5 AM Venture, Amgen, Chroma Medicine, DEM Biosciences, KSQ Therapeutics, Maze Therapeutics, Tenaya Therapeutics, Tessera Therapeutics and Velia Therapeutics. All other authors have no competing interests to declare.

Figures

Fig. 1
Fig. 1. Rapid and scalable templated emulsification for single-cell genomics.
ad, PIP-seq enables the encapsulation, lysis and barcoding of single cells. a, Schematic of the emulsification process. Barcoded particle templates, cells and lysis reagents are combined with oil and vortexed to generate monodispersed droplets. b, Heat activation of PK results in lysis and release of mRNA that is captured on bead-bound barcoded poly(T) oligonucleotides. c, Oil removal is followed by bulk reverse transcription of mRNA into cDNA. cTSO is the complement of the template switch oligonucleotide. d, Barcoded whole-transcriptome-amplified cDNA is prepared for Illumina sequencing. eg, Efficient single-bead, single-drop encapsulation at scale. e, Particle-templated emulsification in different-sized tubes (1.5 ml, 15 ml and 50 ml) produces monodispersed emulsions capable of barcoding orders of magnitude different cell numbers. f, PIP-seq is compatible with plate-based emulsification, including 96-, 384- and 1,536-well plate formats. Representative images are shown from experiments completed three times. g, The estimated ability of different technologies to easily scale with respect to cell and sample number.
Fig. 2
Fig. 2. Heat-activated enzymatic lysis yields high-purity single-cell transcriptomes.
a, Fluorescence microscopy (brightfield and green fluorescent protein) of calcein-stained cells emulsified with barcoded bead templates before and after heat-activated lysis. Inset images show cell puncta (left) and release of calcein (right) after lysis. Representative images are shown from experiments completed at least three times. bd, Cell purity assessed with mouse–human mixing studies. b, Distribution of total UMIs as a function of cell barcode rank. The gray line represents all barcode groups, with called cells colored by species. c,d, Purity analysis of cell transcriptomes assessed using barnyard plots. Cells are colored by cell type (red, mouse reads; blue, human reads; green, mixed reads). Representative data are shown from species-mixing experiments completed over ten times.
Fig. 3
Fig. 3. Accurate single-cell transcriptional profiling of healthy breast tissue using PIP-seq.
a, Clustering and identification of cell types from PIP-seq data (54,825 cells from two individuals). be, Comparison of PIP-seq data to 10x Genomics data collected from the same tissue. b, Integration of PIP-seq and 10x data. c,d, Cell clustering and comparison of marker genes between platforms. d, Heat maps of marker gene expression show similar patterns in PIP-seq and 10x data. e, Correlations in normalized gene expression, by cluster, between platforms (see also Extended Data Fig. 4a).
Fig. 4
Fig. 4. Transcriptome and gRNA sequencing using PIP-seq.
a, Schematic of the CROP-seq sgRNA library designed with target mismatches to modulate the activity of essential genes. b, Lentiviral transduction of the CRISPRi library in K562 cells. c, Schematic of the capture and barcoding of polyadenylated mRNA and sgRNA using PIP-seq. RNA and sgRNA libraries are prepared separately and pooled for sequencing. d, Quantification of gene expression of sgRNAs within an allelic series. sgRNAs are ordered from high to low predicted knockdown efficiency. Non-targeting sgRNAs are denoted as “Null”. Box plots indicate the median, with the lower and upper hinges corresponding to the 25th and 75th percentiles, respectively, and raw data points are displayed (with slight jitter). e, Preranked gene set enrichment analysis (GSEA) of scRNA-seq data comparing sgHSPA5-transduced cells to non-sgHSPA5-transduced cells shows enrichment in genes related to endoplasmic reticulum stress and unfolded protein response; GO CC, Gene Ontology cellular component; NES, normalized enrichment score; FDR, false discovery rate.
Fig. 5
Fig. 5. Molecular signatures of drug-resistant cancer phenotypes in cell lines and human samples.
a, A two-by-two experimental study design using lung adenocarcinoma cell lines (H1975 and PC9) treated with gefitinib or DMSO. b, Clustering of scRNA-seq data after drug treatment shows transcriptional perturbations in gefitinib-sensitive PC9, but not gefitinib-resistant H1975, cells. c, Increased expression of TACSTD2 in PC9 cells challenged with gefitinib. d, Identification of drug-resistant H1975 cells spiked into drug-sensitive PC9 cells based on gefitinib-induced transcriptional perturbation. el, PIP-seq RNA and barcoded antibody (CITE-seq) analysis of MPAL. e, Clustering of single cells for participant 65 before (left) and after (right) chemotherapy. f, Clustering of single cells for participant 873 before (left) and after (right) chemotherapy. g,h, ADT abundance, by cluster, before (t1) and after (t2) chemotherapy. ADTs change as a function of chemotherapy but are consistent among clusters for both participant 65 (g) and participant 873 (h), with the exception of T cell subsets. il, Analysis of transcriptional heterogeneity in MPAL samples. i, Heat map of top differentially expressed marker genes by cluster after relapse in participant 63. j, GSEA preranked analysis comparing transcriptomic differences between clusters 1 and 7 in participant 65 using the following gene sets: Human Phenotype acute leukemia (M35856), hallmark G2M checkpoint (M5901), hallmark oxidative phosphorylation (M5936) and Gene Ontology cellular component (GO CC) ribosome (M17089). k, Heat map of top differentially expressed marker genes by cluster after relapse in participant 873. l, GSEA preranked analysis comparing transcriptomic differences between clusters 3 and 5 in participant 873 using gene sets Human Phenotype acute myeloid leukemia (M36586), Gene Ontology cellular component ribosome (M17089), Gene Ontology biological process (GO BP) oxidative phosphorylation (M17089) and abnormal myeloid leukocyte morphology (M37711).
Extended Data Fig. 1
Extended Data Fig. 1. Flexible sample processing with PIP-seq.
(a) Storage of droplets after emulsification for 72 hours at 0 °C did not change quality metrics. Each bar represents the average of two biologically independent experiments with the individual data points shown. (b) Data integration between time points. (c) Correlations in normalized gene expression, by sample, between time points for mouse and human cells.
Extended Data Fig. 2
Extended Data Fig. 2. High cell and sample number experiments with PIP-seq.
(a-c) Microscope images of droplets and cells in plate emulsification experiments. Representative images are from experiments completed at least three times. (a,b) Barcode bead templates, stained cells (puncta), and lysis reagents are combined with oil and vortexed in (a) 96-well and (b) 384-well plates to generate monodispersed droplets. Heat activation of Proteinase K results in lysis and release of calcein dye, and full-drop fluorescence. (c) Microscope images of droplets from random wells of a 384-well plate emulsification experiment.
Extended Data Fig. 3
Extended Data Fig. 3. Quality control analysis of PIP-seq using healthy breast tissue.
(a) Integration and clustering of 54,825 cells from 2 patients with 2 replicates per patient. (b) Coloring of UMAP by the number genes (nFeature RNA) for each cell. (c) The number of unique genes (nFeature RNA), transcripts (nCount RNA), percent mitochondrial reads, and percent ribosomal reads as a function of cluster. (d) Comparison between 10X Genomics’ and PIP-seq data after downsampling 2400 cells to 36,500 reads per cell. Box plots indicate the median with the lower and upper hinges corresponding to the 25th and 75th percentiles. (c,d) Each violin represents a combination of 4 individual samples (2 replicates from 2 patients).
Extended Data Fig. 4
Extended Data Fig. 4. Comparison, after down-sampling (2400 cells 1500 UMIs) of the larger breast tissue PIP-seq dataset to 10x Genomics data generated from identical samples.
(a) Correlations in normalized gene expression, by cluster, between platforms. (b) Expression of marker genes overlayed on clusters is consistent between platforms.
Extended Data Fig. 5
Extended Data Fig. 5. Data quality assessment of PIP-seq.
(a) Representative distribution of reads per cell. (b) Correlation between reads and genes per cell. Spearman’s R and p values were calculated in R v4.1.0. (c,d) Comparison of UMIs/cell and genes/cell in current single-cell methods. Plots display a violin for a single representative sample for each platform. Transcripts per cell and genes per cell are separated by cell species (mouse (c) and human (d)), identified using the 85% species thresholding technique, as described in the methods. Box plots show the median, 25th and 75th percentiles. (e,f) Comparison of PIP-seq to 10X Genomics across a range of sequencing depths (0-80,000 reads/cell) (e) UMIs/cell and (f) genes/cell 80k cells down sampled from one biological replicate. Points represent the median with the lower and upper error bars corresponding to the 25th and 75th percentiles, respectively.
Extended Data Fig. 6
Extended Data Fig. 6. High cell number PIP-seq.
(a) scRNA-seq of 138,146 single cells from breast tissue using a single-tube emulsification in 2-minutes. (b) scRNA-seq of 65k peripheral blood mononuclear cells (PBMCs) recovers a small population of CD34 cells. (c) Coloring of UMAP by the normalized expression of CD34 for each cell. (d,e) Hashing of PBMCs demonstrates compatibility of PIP-seq with barcoded antibodies.
Extended Data Fig. 7
Extended Data Fig. 7. CROP-seq with PIP-seq.
(a) Gene expression for each sgRNA within an allelic series for all genes in the CRISPRi library. Each sgRNA is ordered from predicted high to low knockdown efficiency. Non-targeting sgRNA are denoted as “Null.” Data is from one CROP-seq experiment. Box plots indicate the median with the lower and upper hinges corresponding to the 25th and 75th percentiles. Raw data points are displayed with a slight jitter. (b) The relationship between gene expression and predicted knockdown of each gene. Expected changes in transcription across the allelic series were prominent in highly expressed genes. p-value represents the significance of the generalized additive model relating gRNA identity to knockdown efficiency for each gene. P-values for each model were directly plotted along with the average expression for each gene (using log1p of the normalized counts). The horizontal red line shows the significance level of p = 0.05.
Extended Data Fig. 8
Extended Data Fig. 8. Identification of Gefitinib-specific transcriptional responses in cancer cell lines.
(a) Violin plots of median expression values for selected differentially expressed genes. (b) The expression of selected differentially expressed genes superimposed on H1975 and PC9 cell clusters.
Extended Data Fig. 9
Extended Data Fig. 9. Analysis of PIP-seq data from MPAL Patient 65.
(a) Clinical flow cytometry and corresponding antibody derived tag (ADT) data for patient 65 with mixed phenotypical acute leukemia (MPAL). (b) Integration of replicates and time points. (c) Correlation between the number of cells in each cluster before and after relapse identifies expansion of clusters 1,4, and7. (d) Volcano plots showing differential gene expression, by cluster, between t1 (before treatment) and t2 (after relapse).
Extended Data Fig. 10
Extended Data Fig. 10. Analysis of PIP-seq data from MPAL Patient 873.
(a) Clinical flow cytometry and corresponding antibody derived tag (ADT) data for patient 873 with mixed phenotypical acute leukemia (MPAL). (b) Integration of replicates and time points. (c) Correlation between the number of cells in each cluster before and after treatment identifies the expansion of clusters 3 and 5. (d) Volcano plots showing differential gene expression, by cluster, between t1 (before treatment) and t2 (after relapse).

References

    1. Eberwine J, et al. Analysis of gene expression in single live neurons. Proc. Natl Acad. Sci. USA. 1992;89:3010–3014. doi: 10.1073/pnas.89.7.3010. - DOI - PMC - PubMed
    1. Tang F, et al. mRNA-seq whole-transcriptome analysis of a single cell. Nat. Methods. 2009;6:377–382. doi: 10.1038/nmeth.1315. - DOI - PubMed
    1. Hagemann-Jensen M, et al. Single-cell RNA counting at allele and isoform resolution using Smart-seq3. Nat. Biotechnol. 2020;38:708–714. doi: 10.1038/s41587-020-0497-0. - DOI - PubMed
    1. Hahaut V, Picelli S. Full-length single-cell RNA-sequencing with FLASH-seq. Methods Mol. Biol. 2023;2584:123–164. doi: 10.1007/978-1-0716-2756-3_5. - DOI - PubMed
    1. Picelli S, et al. Full-length RNA-seq from single cells using Smart-seq2. Nat. Protoc. 2014;9:171–181. doi: 10.1038/nprot.2014.006. - DOI - PubMed