. 2023 Mar;55(3):597-611.
doi: 10.1038/s12276-023-00957-7. Epub 2023 Mar 6.

Increased retinoic acid signaling decreases lung metastasis in salivary adenoid cystic carcinoma by inhibiting the noncanonical Notch1 pathway

Affiliations

Increased retinoic acid signaling decreases lung metastasis in salivary adenoid cystic carcinoma by inhibiting the noncanonical Notch1 pathway

Meng-Jiao Zhou et al. Exp Mol Med. 2023 Mar.

Abstract

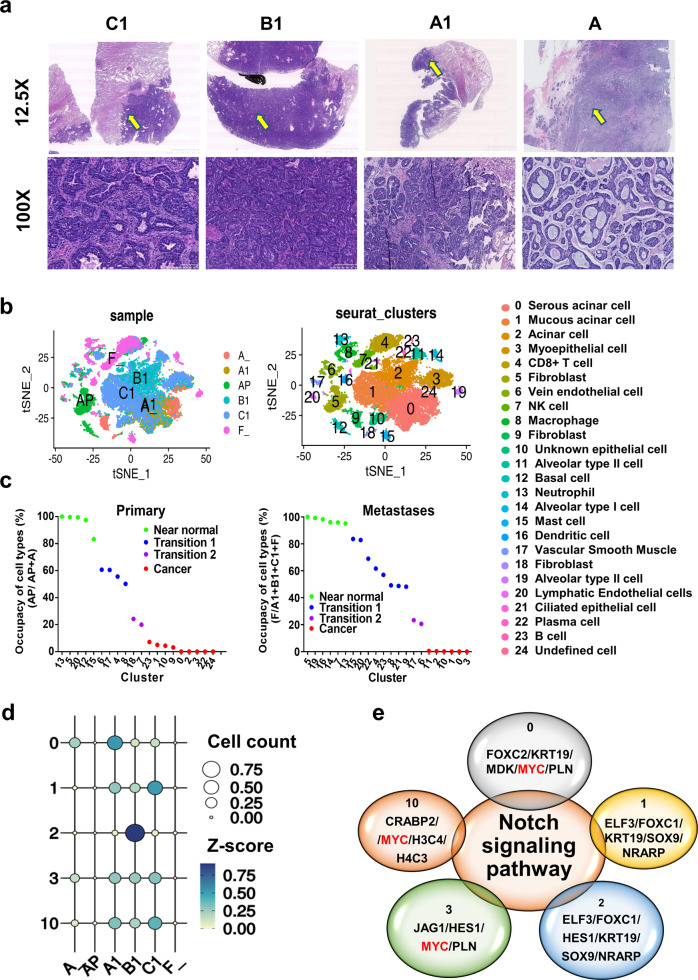
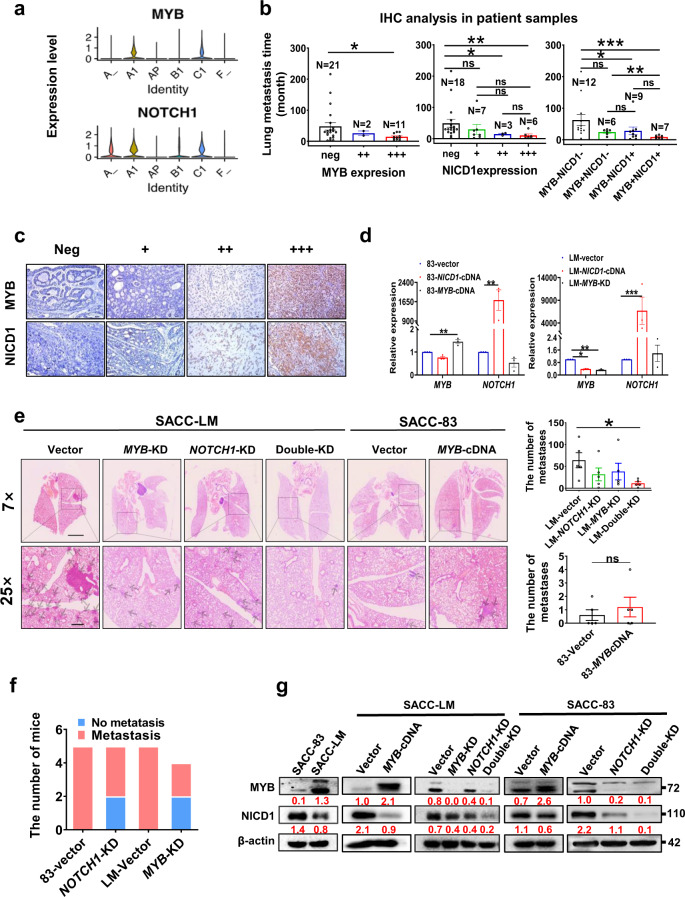
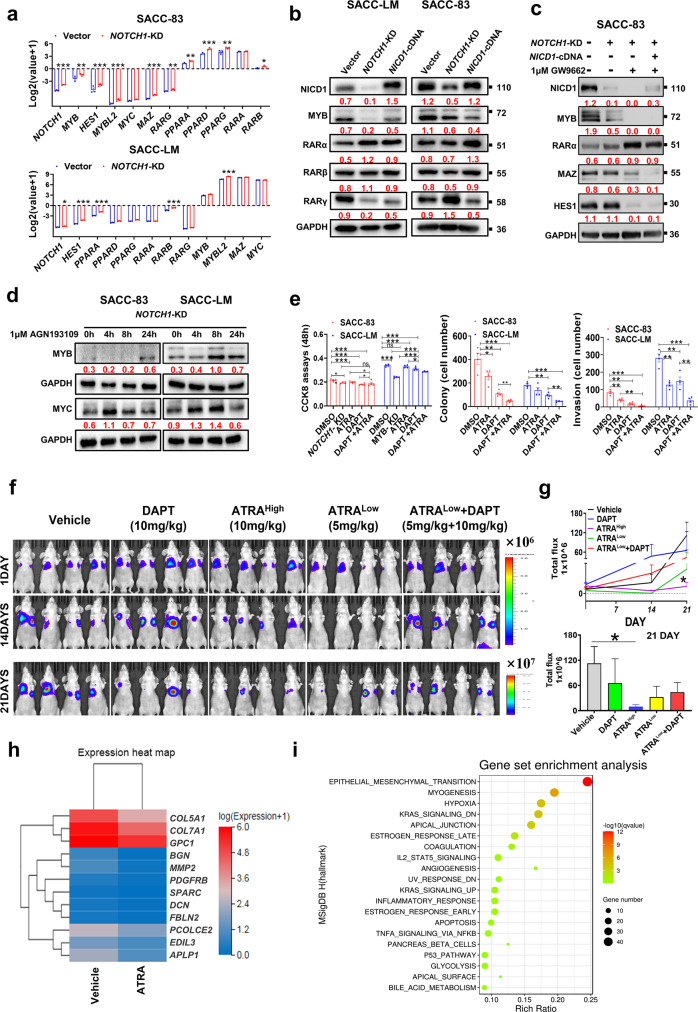
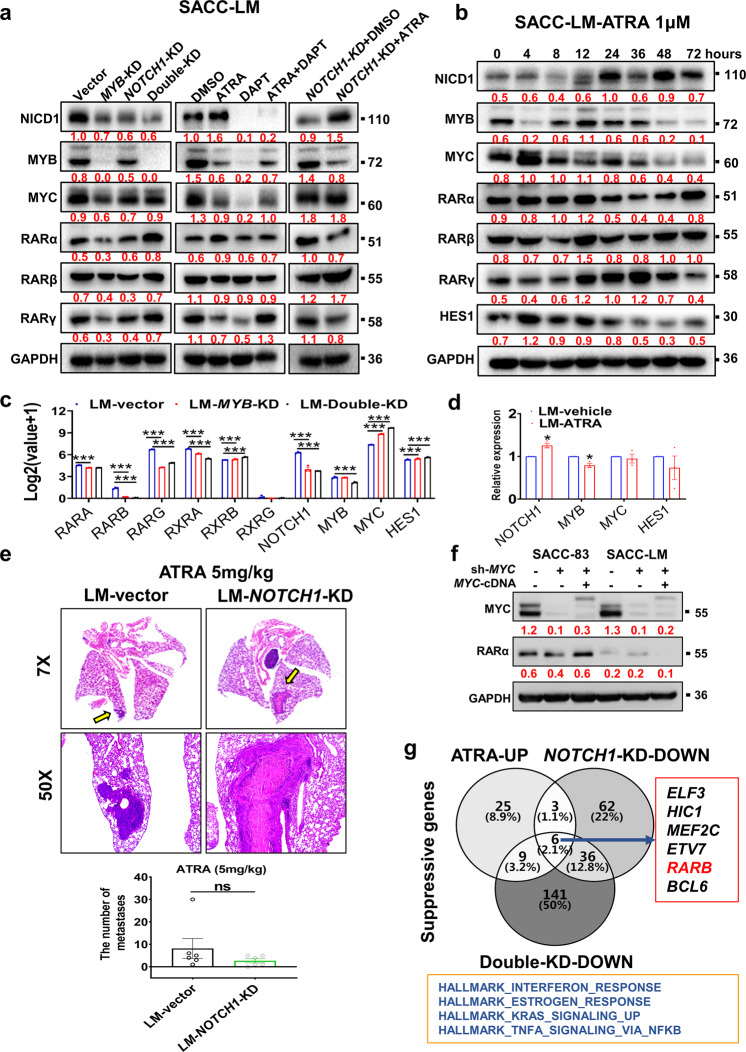
MYB-NFIB fusion and NOTCH1 mutation are common hallmark genetic events in salivary gland adenoid cystic carcinoma (SACC). However, abnormal expression of MYB and NOTCH1 is also observed in patients without MYB-NFIB fusion and NOTCH1 mutation. Here, we explore in-depth the molecular mechanisms of lung metastasis through single-cell RNA sequencing (scRNA-seq) and exome target capture sequencing in two SACC patients without MYB-NFIB fusion and NOTCH1 mutation. Twenty-five types of cells in primary and metastatic tissues were identified via Seurat clustering and categorized into four main stages ranging from near-normal to cancer-based on the abundance of each cell cluster in normal tissue. In this context, we identified the Notch signaling pathway enrichment in almost all cancer cells; RNA velocity, trajectory, and sub-clustering analyses were performed to deeply investigate cancer progenitor-like cell clusters in primary tumor-associated lung metastases, and signature genes of progenitor-like cells were enriched in the "MYC_TARGETS_V2" gene set. In vitro, we detected the NICD1-MYB-MYC complex by co-immunoprecipitation (Co-IP) and incidentally identified retinoic acid (RA) as an endogenous antagonist of genes in the "MYC_TARGETS_V2" gene set. Following this, we confirmed that all-trans retinoic acid (ATRA) suppresses the lung metastasis of SACC by correcting erroneous cell differentiation mainly caused by aberrant NOTCH1 or MYB expression. Bioinformatic, RNA-seq, and immunohistochemical (IHC) analyses of primary tissues and metastatic lung tissues from patients with SACC suggested that RA system insufficiency partially promotes lung metastasis. These findings imply the value of the RA system in diagnosis and treatment.


Conflict of interest statement

The authors declare no competing interests.

Figures

Fig. 1
Fig. 1. Cancer cell type definition and GO enrichment analysis based on scRNA-seq data.
a Images of HE staining show a primary SACC lesion (A) and lung metastases in the right middle lobe (B1) and the right lower lobe (A1 and C1) at 12.5× and 100× magnification. b t-SNE plots of six sample types (left) and all cells (right) led to the identification of 25 cell clusters based on cellular identity, and all cell types are defined by known marker genes (see Supplementary Table 2). c The statistical plots show the normal tissue occupancy for each cell type (see the formula in the Results) in the primary lesion (left) and metastases (right). These data were used to divide the cells into four stages: near-normal (>80%), transition 1 (50–75%), transition 2 (15–40%), and cancer (<14%). d The bubble plot indicates the number of cancer-stage cells (cells in clusters 0, 1, 2, 3, and 10) in the six samples. e The Venn diagram shows the predominant DEGs in the cancer-stage cell clusters (clusters 0, 1, 2, 3, and 10) and the shared enriched GO term: the Notch signaling pathway.
Fig. 2
Fig. 2. Characterizing metastasis-associated clusters or cancer stem cells.
a The dot plot shows marker genes likely related to SACC stemness and metastasis, as reported in the literature, that were enriched predominantly in cluster 10. b The t-SNE visualization of novel subtypes in cluster 10 shows the distribution in samples (left) and four novel subsets (right). c Violin plots of signature genes, including the top 12 marker genes, as well as MYB, MYBL1, MYBL2, and NOTCH1 in all the subtypes from cluster 10. d GO analysis of all subtypes; subtype 3, which is enriched in genes related to the antiapoptotic pathway, is highlighted. e RNA velocity analysis of all cells and all subtypes by Velocyto soft. The arrow in the plot indicates the direction of differentiation, and the length of the arrow indicates the speed of differentiation (a longer arrow indicates a faster speed). f PPI analysis showing the known interactions, MYB/MYBL2, NOTCH1, and the top eight marker genes.
Fig. 3
Fig. 3. Abnormal expression of both NOTCH1 and MYB cooperatively promotes the lung metastasis of SACC.
a Violin plot depicting the expression levels of MYB and NOTCH1 in six samples. b Statistical analysis of the association between the time to lung metastasis in 34 patients and MYB or/and NICD1 protein levels based on IHC staining. c Representative IHC images of MYB and NOTCH1 expression in lung metastatic lesions from patients (n = 34). d qPCR analysis of the efficiency of NOTCH1 or MYB overexpression or MYB knockdown in two SACC cell lines. e Representative HE images of lung tissues from mice with metastases at 2 or 4 weeks after tail vein injection with different cell lines (7× and 25× magnification). The statistical analysis of the number of metastases in lung tissues is shown on the right. f Statistical analysis and stacked bar chart of the number of mice with lung metastases at 4 weeks after the left ventricular injection of SACC cells (5 per group). g Western blot validation of MYB and NICD1 expression in SACC-83-vector, SACC-LM-vector, SACC-LM-MYB-cDNA, SACC-LM-NOTCH1-KD, SACC-LM-MYB-KD, SACC-LM-double-KD, SACC-83-vector, SACC-83-MYB-cDNA, SACC-83-NOTCH1-KD, and SACC-83-double-KD cells. β-Actin served as a loading control (n = 3). The p values in (b) and (e) were calculated using the two-tailed Mann–Whitney U-test, and those in (c) were calculated using the paired two-tailed Student’s t-test. Data were presented as the mean ± SEM. p < 0.05 (*), p < 0.01 (**), p < 0.001 (***), and p > 0.05 (n.s.).
Fig. 4
Fig. 4. The NICD1–MYB complex targets the “MYC_TARGETS_V2” gene set to initiate the lung metastasis of SACC.
a Venn diagram showing the number of overlapping genes identified by GSEA (q < 0.05) in SACC-LM cells, SACC-83 cells, subtype 3, and ChIP-seq data. Marker genes are listed on the right. b Violin plots of the expression of signature genes in the “MYC_TARGETS_V2” gene set for the four subtypes of cluster 10. c Endogenous Co-IP analysis of NICD1, MYB, and MYC in SACC-83 and SACC-LM cells. d RNA-seq data showing the expression levels of the screened “MYC_TARGETS_V2” gene set in SACC-LM cells compared to SACC-83 cells (left, upper). qPCR analysis of genes related to Notch signaling after knockdown of NOTCH1 or MYB in SACC cells. p values were calculated using the paired two-tailed Student’s t-test. Data were presented as the mean ± SEM. p < 0.05 (*), p < 0.01 (**), p < 0.001 (***). e, f Western blot analysis of the change in NOTCH1-related proteins in SACC-83-MYB-cDNA cells or after rescuing NICD1 or MYB expression in SACC-83-NOTCH1-KD or SACC-LM-NOTCH1-KD cells. g Western blot analysis of the indicated proteins upon knockdown or rescue of MYC expression in SACC-83 or SACC-LM cells. h Schematic diagram visualizing two different mechanisms by which NICD1 recruits MYB to target the “MYC_TARGETS_V2” gene set in poorly metastatic SACC-83 cells and recruits the pMYB–MYC, pMYB–MYC or unknown MYC complex to target the “MYC_TARGETS_V2” gene set in highly metastatic SACC-LM cells.
Fig. 5
Fig. 5. NOTCH1 knockdown triggers RA signaling to downregulate MYB, which inhibits the lung metastasis of SACC.
a Screening of RNA-seq data (three replicates per group) for genes that are up- and down-regulated upon NOTCH1 knockdown in SACC-83 and SACC-LM cells. Data analysis was performed via the Dr.Tom system (BGI). b Western blot validation of the changes in levels of MYB and RARs upon knockdown and rescue of NOTCH1 in SACC-83 cells and SACC-LM cells. c Western blot analysis of the changes in levels of targeted proteins in SACC-83 cells after treatment with 1 μM GW9662 (PPARγ inhibitor). d After NOTCH1 knockdown in two SACC cell lines and treatment with 1 μM AGN193109 (RAR antagonist), Western blot analysis was performed to evaluate the time-dependent changes in MYB and MYC expression. e Statistical analysis of cell proliferation, colony formation, and invasion assay results after treatment with ATRA (1 μM), DAPT (20 μM), or ATRA and DAPT or after NOTCH1 or MYB knockdown. Each experiment was repeated four times. f Luciferase imaging of lung metastatic lesions in nude mice after the intravenous injection of SACC-LM-luciferin cells and treatment with ATRA (5 mg/kg or 10 mg/kg), DAPT (10 mg/kg), or both (5 mg/kg ATRA; 10 mg/kg DAPT) (n = 4/group). g Statistical analysis of fluorescence intensity values of lung metastatic lesions for each group on days 1, 14, and 21, with a focus on day 21. h DEGs (FC >2 and p < 0.05) are shown in the heatmap, and the GSEA results are shown (i) in a dot plot (q < 0.05). The p values were calculated using the paired two-tailed Student’s t-test (e) and the two-tailed Mann–Whitney U-test (g). Data were presented as the mean ± SEM. p < 0.05 (*), p < 0.01 (**), and p < 0.001 (***).
Fig. 6
Fig. 6. ATRA suppresses the lung metastasis of SACC in a mouse model, possibly by activating the tumor-suppressive role of NOTCH1.
a Western blot analysis of RAR and MYC levels in SACC-LM cells upon knockdown of MYB and NOTCH1 alone or in combination or upon treatment with ATRA (1 µM), DAPT (20 µM), or both for 48 h. The grayscale values were calculated with ImageJ 4.0. b Western blot analysis of the time-dependent changes in RARs and HES1 in SACC-LM cells treated with ATRA (1 µM). c RNA-seq data (triplicate samples for each group) showing the changes in RAR and MYC mRNA levels after treatment or knockdown. Data analysis was performed via the Dr.Tom system (BGI). d qPCR validation of NOTCH1, MYB, MYC, and HES1 mRNA levels after ATRA treatment compared to control. e Representative HE images showing the lung metastases in the SACC-LM-NOTCH1-KD and SACC-LM-vector groups treated with ATRA (5 mg/kg) for 21 days (n = 6/group). The number of metastatic pulmonary nodules larger than 100 µm in diameter was calculated. f Western blot analysis of RARα expression upon MYC knockdown or rescue. g The Venn diagram shows the intersection of DEGs from ATRA treatment, NOTCH1-KD, and double-KD in SACC-LM cells to screen for NOTCH1-related genes that suppress metastasis. The grayscale values of the Western blot were calculated by ImageJ 4.0. The Western blot and qPCR experiments were repeated three times. GO enrichment analysis was performed in the Dr.com system (BGI). The p values were calculated using the paired two-tailed Student’s t-test (d) and the two-tailed Mann–Whitney U-test (e). Data were presented as the mean ± SEM. p < 0.05 (*), p < 0.01 (**), p < 0.001 (***), p > 0.05 (n.s.).
Fig. 7
Fig. 7. Lung metastasis in patients with SACC might partly be caused by insufficient RA signaling.
a Heatmap of the expression of genes related to RA signaling in SACC-83 cells and SACC-LM cells, as determined by RNA-seq. b Mutation analysis of RA signaling molecules from the cBioPortal database in 1184 samples from 1180 patients based on seven ACC studies. c Violin plot of scRNA-seq analysis of the expression levels of RA signaling molecules from six tissues of two patients and four subtypes of cluster 10. d, e Statistical analysis of the mRNA levels of MYB, NICD1, FABP7, NPM1, PRMT3, and RARs in five lung metastasis samples or 13 primary tumor samples (GSE 88804) versus matched normal tissue samples. The p values were calculated using the two-tailed Mann–Whitney U-test. Data were presented as the mean ± SEM. p < 0.05 (*), p < 0.01 (**), and p < 0.001 (***).
Fig. 8
Fig. 8. RARα shows significant downregulation in ACC metastatic lung tissues.
a Representative images of MYB, NICD1, FABP7, NPM1, PRMT3, and RARs IHC in 28 ACC lung metastasis samples or nine primary tumor samples versus matched normal tissue samples and statistical analysis (b). The p values were calculated using the two-tailed Mann–Whitney U-test. Data were presented as the mean ± SEM. p < 0.05 (*), p < 0.01 (**), and p < 0.001 (***).

References

    1. Seok J, et al. Lung metastasis in adenoid cystic carcinoma of the head and neck. Head. Neck. 2019;41:3976–3983. doi: 10.1002/hed.25942. - DOI - PubMed
    1. He S, et al. Clinicopathologic and prognostic factors in adenoid cystic carcinoma of head and neck minor salivary glands: a clinical analysis of 130 cases. Am. J. Otolaryngol. 2017;38:157–162. doi: 10.1016/j.amjoto.2016.11.014. - DOI - PubMed
    1. Szanto PA, Luna MA, Tortoledo ME, White RA. Histologic grading of adenoid cystic carcinoma of the salivary glands. Cancer. 1984;54:1062–1069. doi: 10.1002/1097-0142(19840915)54:6<1062::AID-CNCR2820540622>3.0.CO;2-E. - DOI - PubMed
    1. Sur RK, et al. Adenoid cystic carcinoma of the salivary glands: a review of 10 years. Laryngoscope. 1997;107:1276–1280. doi: 10.1097/00005537-199709000-00022. - DOI - PubMed
    1. van der Wal JE, Becking AG, Snow GB, van der Waal I. Distant metastases of adenoid cystic carcinoma of the salivary glands and the value of diagnostic examinations during follow-up. Head. Neck. 2002;24:779–783. doi: 10.1002/hed.10126. - DOI - PubMed

Publication types

MeSH terms