. 2023 Mar;29(3):667-678.
doi: 10.1038/s41591-023-02238-2. Epub 2023 Mar 6.

Multiomic analyses implicate a neurodevelopmental program in the pathogenesis of cerebral arachnoid cysts

Affiliations

Multiomic analyses implicate a neurodevelopmental program in the pathogenesis of cerebral arachnoid cysts

Adam J Kundishora et al. Nat Med. 2023 Mar.

Abstract

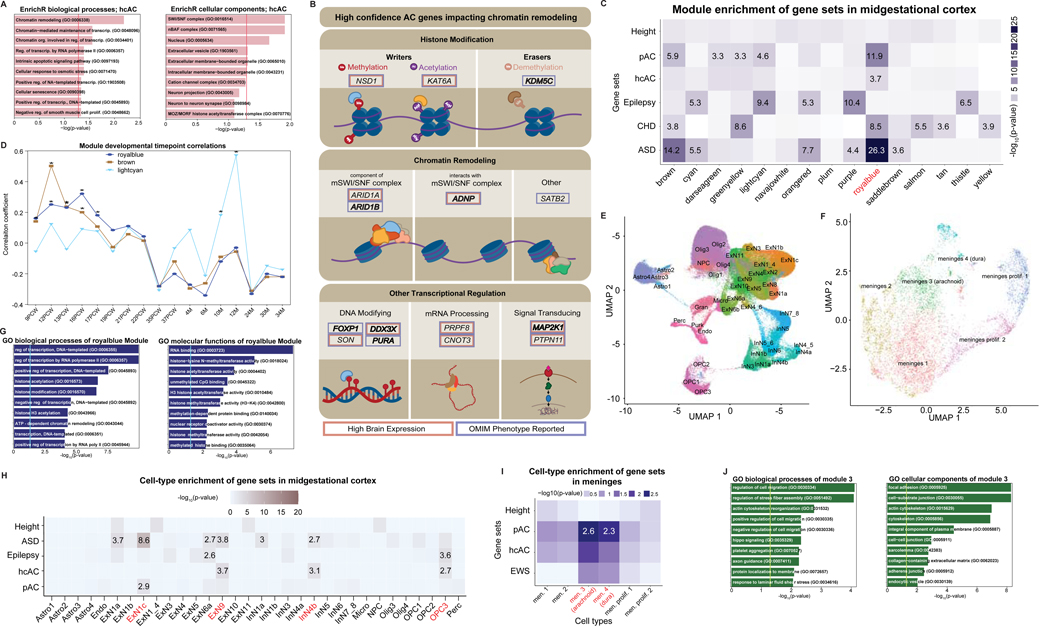
Cerebral arachnoid cysts (ACs) are one of the most common and poorly understood types of developmental brain lesion. To begin to elucidate AC pathogenesis, we performed an integrated analysis of 617 patient-parent (trio) exomes, 152,898 human brain and mouse meningeal single-cell RNA sequencing transcriptomes and natural language processing data of patient medical records. We found that damaging de novo variants (DNVs) were highly enriched in patients with ACs compared with healthy individuals (P = 1.57 × 10⁻³³). Seven genes harbored an exome-wide significant DNV burden. AC-associated genes were enriched for chromatin modifiers and converged in midgestational transcription networks essential for neural and meningeal development. Unsupervised clustering of patient phenotypes identified four AC subtypes and clinical severity correlated with the presence of a damaging DNV. These data provide insights into the coordinated regulation of brain and meningeal development and implicate epigenomic dysregulation due to DNVs in AC pathogenesis. Our results provide a preliminary indication that, in the appropriate clinical context, ACs may be considered radiographic harbingers of neurodevelopmental pathology warranting genetic testing and neurobehavioral follow-up. These data highlight the utility of a systems-level, multiomics approach to elucidate sporadic structural brain disease.


Conflict of interest statement

COMPETING INTERESTS

The authors declare no competing interests.

Figures

Extended Data Figure 1.
Extended Data Figure 1.. Graphical summary of the methodological framework of the study.
Extended Data Figure 2.
Extended Data Figure 2.. De novo variation (DNV) rate closely approximated Poisson distribution in AC cases and controls.
The observed number of DNVs per subject (bars) compared to the numbers expected (lines) from the Poisson distribution in the case (red) and control (blue) cohorts. ‘p’ denotes chi-squared p-value. P-values determined by Chi-squared goodness of fit test, two sided. Not adjusted
Extended Data Figure 3.
Extended Data Figure 3.. Quantile-quantile (Q-Q) plot comparing observed versus expected p-values (A) DeNovoWEST derived plots for de novo variants (DNVs) in each gene in 617 AC cases.
ADNP, ARIDB1, KDM5C, PURA, FOXP1, and MAP2K1 exhibit exome-wide significant enrichment for all DNVs in AC cases. ARID1B, ADNP, and FOXP1 exhibit significant enrichment of loss-of-function (LoF) DNVs comprising premature termination, frameshift, or splice-site variants. KDM5C and MAP2K1 exhibit significant enrichment of missense variants. ARID1B, FOXP1, ADNP, and KDM5C exhibit significant enrichment of protein-altering variants, including missense and predictive LoF DNVs. ARID1B, ADNP, FOXP1, MAP2K1, PURA, and KDM5C exhibit significant enrichment of protein-damaging variants, including D-mis and LoF DNVs. There is no significant enrichment of synonymous DNVs among the 617 cases. Grey areas within graphs represents 95% confidence interval for expected values. (B) DenovolyzeR derived plots for DNVs in each gene in 617 AC cases. ARID1B, PURA, ADNP, and FOXP1 exhibit exome-wide significant enrichment for all DNVs in AC cases. ARID1B and ADNP exhibit significant enrichment of LoF DNVs. MAP2K1 exhibits significant enrichment of damaging-missense (D-mis) variants (MetaSVM= ‘D’ or MPC>2 damaging missense). ARID1B, ADNP, FOXP1, MAP2K1, and KDM5C exhibit significant enrichment of protein-altering variants. ARID1B, ADNP, FOXP1, MAP2K1, and DDX3X exhibit significant enrichment of protein-damaging variants. There is no significant enrichment of tolerated-missense (T-mis) DNVs or synonymous DNVs among the 617 cases. The grey areas within graphs represents 95% confidence interval centered around the observed = expected line.
Extended Data Figure 4.
Extended Data Figure 4.. Phenomic heat map of traits identified in AC patients harboring de novo variants (DNVs) in exome-wide significant AC risk genes.
Subject phenotypes were determined by text2HPO natural language processing of medical record data (https://github.com/GeneDx/txt2hpo).
Extended Data Figure 5.
Extended Data Figure 5.. Integrative genomic findings within meningeal cell dataset
(A) Enrichment of AC genes in meningeal gene modules. Numbers displayed exceed the Bonferroni-corrected statistical significance threshold tested by one sided Fisher’s exact test and are -log10(p-value). pAC: possible AC gene set; hcAC; high-confidence AC gene set; EWS exome-wide significant; Mod: module. (B) GOrilla and WikiPathways analyses of enriched arachnoid cell module 3. P-values determined by one sided Fisher’s exact test. Bonferroni-corrected significance threshold denoted by the vertical yellow line. Top terms displayed. (C) Enrichment of gene modules in specific meningeal cell types. P-values by one sided Fisher’s exact test. Modules in red have similar meningeal cell-type enrichment compared to AC risk gene meningeal cell-type enrichment. The red asterisk highlights significant enrichment (Bonferroni corrected) for cell types in the pAC gene set.
Figure 1.
Figure 1.. Arachnoid cysts (ACs) are associated with de novo variants (DNVs) in high brain-expressed (HBE) genes highly intolerant to loss-of-function (LoF) variants.
(A) Representative imaging of AC patients. T2-weighted brain magnetic resonance images of representative ACs within our cohort demonstrating varying degrees of mass effect, cortical hypoplasia, obstructive hydrocephalus, and calvarial remodeling. (B) AC risk genes with HBE highly intolerant to LoF. LoF variants comprise premature termination, frameshift or splice site variants. pLI is a gene-wide constraint metric that estimates the probability of being intolerant to LoF variation. Mouse brain expression is determined by bulk RNA-seq expression at embryonic day (E) 9.5. The top quartile of brain expression is represented by the vertical dashed line and top 10% of LoF intolerance is represented by the horizontal dashed line. Individual dots represent individual genes in the AC cohort harboring at least one DNV. The size of the dot correlates with the number of DNVs identified. The red color represents genes reaching exome-wide significance (EWS). (C) AC risk genes with higher numbers of DNVs are predominantly those with high pLI values. Genes visualized have ≥2 DNVs. Large, orange dots represent those surpassing EWS thresholds. Genes in red font indicate the high-confidence AC gene set. (D) DNVs in EWS AC genes cluster to mutational hotspots. Locations of identified protein-altering and protein-damaging DNVs in EWS AC genes are represented as red dots (locations reported above) in relation to critical functional domains of the gene as reported in the UniProt database (https://www.uniprot.org/: January 2022). “# of var” represents a running average of all reported variants at each position of the gene, including all pathogenic and likely-pathogenetic variants reported in the ClinVar database (https://www.ncbi.nlm.nih.gov/clinvar: January 2022). Calculation of the running average included reported variants at 10 amino acid residues preceding and following each position.
Figure 2.
Figure 2.. De novo variants in AC genes disrupt epigenomic regulation and impact midgestational neural precursors and arachnoid cells.
(A) EnrichR biological and cellular processes of high-confidence (hcAC) genes converge on pathways regulating chromatin modification. (B) hcAC genes with roles in chromatin modification and transcriptional regulation. Histone proteins are represented as blue circles. DNA is represented as a purple strand. High brain expression (HBE) genes boxed in red. Genes associated with autosomal dominant or X-linked OMIM disorders are boxed in blue. Boldface genes surpassed exome-wide significance thresholds in DenovolyzeR analysis. Me: methyl group; Acyl: acetyl group. (C) Enrichment of AC genes in gene modules of the midgestational human cortex compared to other disease genes. Height: human height gene set; pAC: probable AC gene set; hcAC: high-confidence AC gene set; Epilepsy: epilepsy gene set; CHD: congenital heart disease gene set; ASD: autism spectrum disorder gene set. (D) Temporal dynamics of modules enriched with AC genes. Peak expression of brown and royal blue modules is at post conception week (PCW) 12–16. Peak expression of the light cyan module is at ~10–12 months (M). Asterisks represent significant differences in expression. (E) Putative AC-related cell type clusters in the midgestational human cortex defined by scRNAseq. (F) Putative AC-related cell type clusters in the developing meninges defined by scRNAseq. (G) GOrilla biological and molecular functions of royal blue module converge on histone regulation. (H) Cell-type enrichment of AC and other disease genes in the midgestational human brain. (I) Cell-type enrichment of AC genes in the developing meninges. (J) GOrilla pathway analyses of enriched meningeal module 3 (arachnoid cells). For panels C, H&I, Numbers displayed exceed the Bonferroni-corrected statistical significance threshold tested by one sided Fisher’s exact test and are -log10(p-value). Cell types noted on the x-axis. Cell types in red represent significant enrichment within hcAC or pAC gene sets. For panels A, G&J P-values determined by one sided Fisher’s exact test. Bonferroni-corrected significance threshold denoted by the vertical line. Top terms displayed.
Figure 3.
Figure 3.. Unsupervised clustering of phenotype data identified clinical AC subtypes that correlate with genomic results.
(A) DisGeNET phenotypic overlap of AC patients. Visualization of overlapping individual genes in the probable AC gene set (pAC) and the top-three DisGeNET-curated term gene lists enriched for pAC genes. The table below quantifies overlap and enrichment (one-sided Fisher’s exact test). (B) Human Phenotype Ontology (HPO) clustering of AC cohort. Clustering of all patients with available phenotypic information reveals four major phenotypic clusters of AC patients. Phenotypic traits of patients were determined via text2hpo assessment of patient medical records. (C) HPO cluster enrichment. DisGeNET phenotype enrichment by cluster (top graph), relevant gene-set enrichment (middle graph) and GOrilla term enrichment (bottom graph) are represented. Pairwise statistical testing (chi-squared) is represented to the left of the bar graphs. Significant differences are denoted with an asterisk. Values shown are -log10(p-value) and significant is Bonferroni corrected. hcAC: high-confidence AC gene set; EWS: exome-wide significant (D) HPO cluster identity by Term Frequency – Inverse Document Frequency (TF-IDF). Labeled phenotypes are those that qualify as statistical outliers (See Methods). (E) EWS variant distribution in HPO clusters.

References

MAIN TEXT REFERENCES

    1. White T, Su S, Schmidt M, Kao CY & Sapiro G. The development of gyrification in childhood and adolescence. Brain Cogn 72, 36–45 (2010). - PMC - PubMed
    1. Juric-Sekhar G. & Hevner RF Malformations of Cerebral Cortex Development: Molecules and Mechanisms. Annu Rev Pathol 14, 293–318 (2019). - PMC - PubMed
    1. Siegenthaler JA, et al. Retinoic acid from the meninges regulates cortical neuron generation. Cell 139, 597–609 (2009). - PMC - PubMed
    1. Borrell V. & Marin O. Meninges control tangential migration of hem-derived Cajal-Retzius cells via CXCL12/CXCR4 signaling. Nature neuroscience 9, 1284–1293 (2006). - PubMed
    1. Al-Holou WN, et al. Prevalence and natural history of arachnoid cysts in adults. J Neurosurg 118, 222–231 (2013). - PubMed

METHODS REFERENCES

    1. Retterer K, et al. Clinical application of whole-exome sequencing across clinical indications. Genet Med 18, 696–704 (2016). - PubMed
    1. McKenna A, et al. The Genome Analysis Toolkit: a MapReduce framework for analyzing next-generation DNA sequencing data. Genome research 20, 1297–1303 (2010). - PMC - PubMed
    1. Karczewski KJ, et al. The mutational constraint spectrum quantified from variation in 141,456 humans. Nature 581, 434–443 (2020). - PMC - PubMed
    1. Taliun D, et al. Sequencing of 53,831 diverse genomes from the NHLBI TOPMed Program. Nature 590, 290–299 (2021). - PMC - PubMed
    1. Mills RE, et al. Natural genetic variation caused by small insertions and deletions in the human genome. Genome research 21, 830–839 (2011). - PMC - PubMed

Publication types

LinkOut - more resources