

Decision tree learning in Neo4j on homogeneous and unconnected graph nodes from biological and clinical datasets
- PMID: 36879243
- PMCID: PMC9988195
- DOI: 10.1186/s12911-023-02112-8
Decision tree learning in Neo4j on homogeneous and unconnected graph nodes from biological and clinical datasets
Abstract
Background: Graph databases enable efficient storage of heterogeneous, highly-interlinked data, such as clinical data. Subsequently, researchers can extract relevant features from these datasets and apply machine learning for diagnosis, biomarker discovery, or understanding pathogenesis.
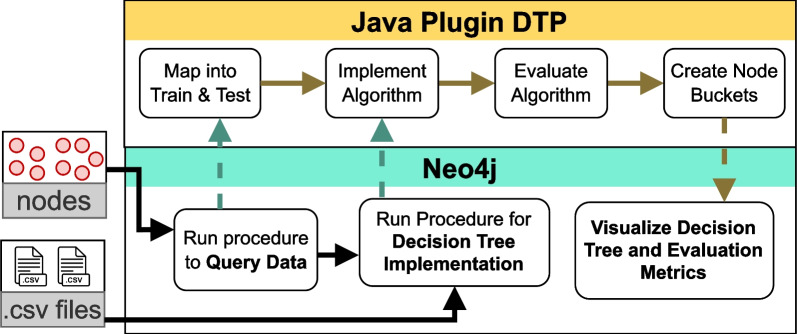
Methods: To facilitate machine learning and save time for extracting data from the graph database, we developed and optimized Decision Tree Plug-in (DTP) containing 24 procedures to generate and evaluate decision trees directly in the graph database Neo4j on homogeneous and unconnected nodes.
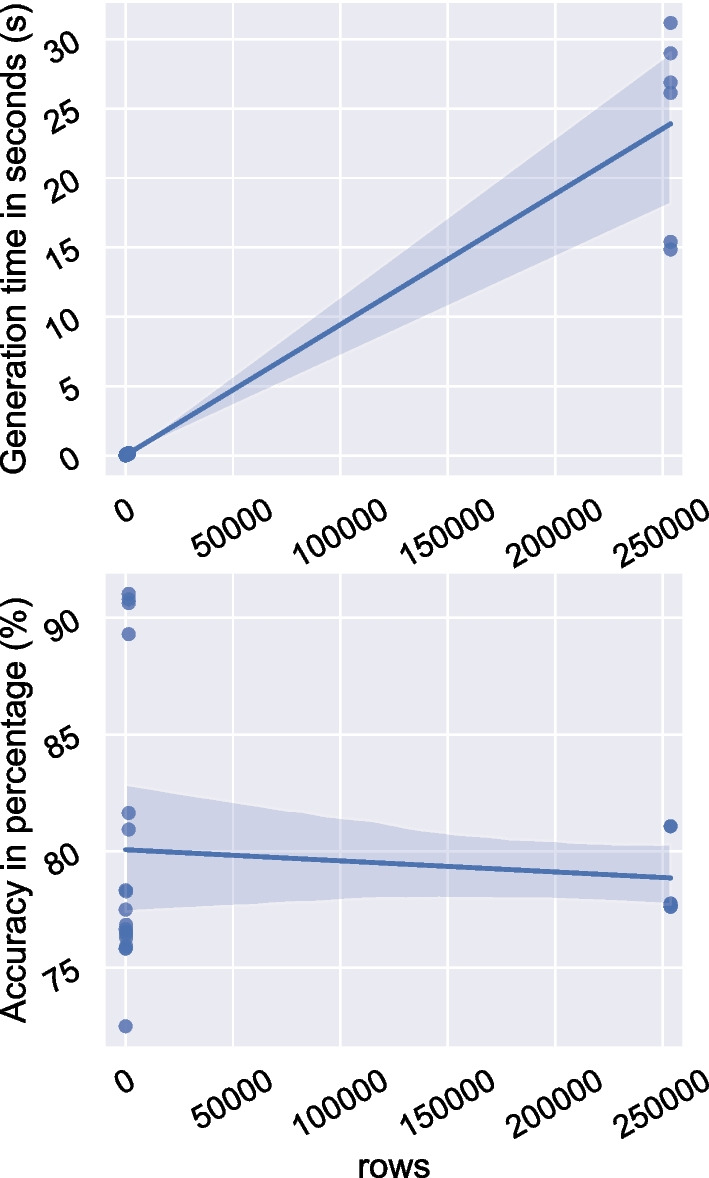
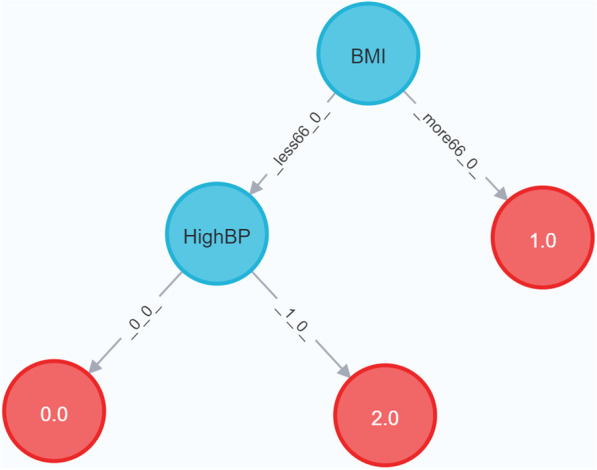
Results: Creation of the decision tree for three clinical datasets directly in the graph database from the nodes required between 0.059 and 0.099 s, while calculating the decision tree with the same algorithm in Java from CSV files took 0.085-0.112 s. Furthermore, our approach was faster than the standard decision tree implementations in R (0.62 s) and equal to Python (0.08 s), also using CSV files as input for small datasets. In addition, we have explored the strengths of DTP by evaluating a large dataset (approx. 250,000 instances) to predict patients with diabetes and compared the performance against algorithms generated by state-of-the-art packages in R and Python. By doing so, we have been able to show competitive results on the performance of Neo4j, in terms of quality of predictions as well as time efficiency. Furthermore, we could show that high body-mass index and high blood pressure are the main risk factors for diabetes.
Conclusion: Overall, our work shows that integrating machine learning into graph databases saves time for additional processes as well as external memory, and could be applied to a variety of use cases, including clinical applications. This provides user with the advantages of high scalability, visualization and complex querying.
Keywords: Cypher; Decision tree; Graph database; Java; Neo4j; Python; R.
© 2023. The Author(s).
Conflict of interest statement
The authors declare that they have no competing interests.
Figures


References
-
- Santos A, Colaço AR, Nielsen AB, Niu L, Geyer PE, Coscia F, Albrechtsen NJW, Mundt F, Jensen LJ, Mann M. Clinical knowledge graph integrates proteomics data into clinical decision-making. bioRxiv 2020; 10.1101/2020.05.09.084897.
-
- Aziz T, Haq E-U, Muhammad D. Performance based comparison between RDBMS and OODBMS. Int J Comput Appl. 2018;180(17):42–46. doi: 10.5120/ijca2018916410. - DOI
-
- Vicknair C, Macias M, Zhao Z, Nan X, Chen Y, Wilkins D. A comparison of a graph database and a relational database. ACM Press, 2010; 10.1145/1900008.1900067.
-
- Pokorn J. Graph databases: their power and limitations 2015.
Publication types
MeSH terms
LinkOut - more resources
Full Text Sources
