. 2023 Mar 6;21(1):78.
doi: 10.1186/s12951-023-01835-0.

Medicinal plant-derived mtDNA via nanovesicles induces the cGAS-STING pathway to remold tumor-associated macrophages for tumor regression

Affiliations

Medicinal plant-derived mtDNA via nanovesicles induces the cGAS-STING pathway to remold tumor-associated macrophages for tumor regression

Jinfeng Liu et al. J Nanobiotechnology. .

Abstract

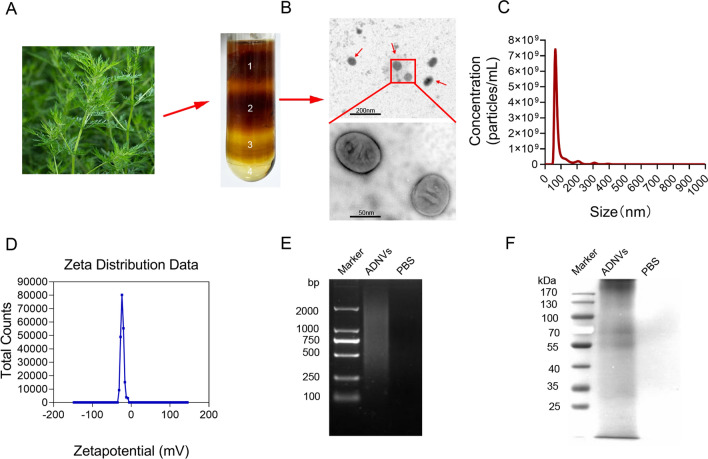
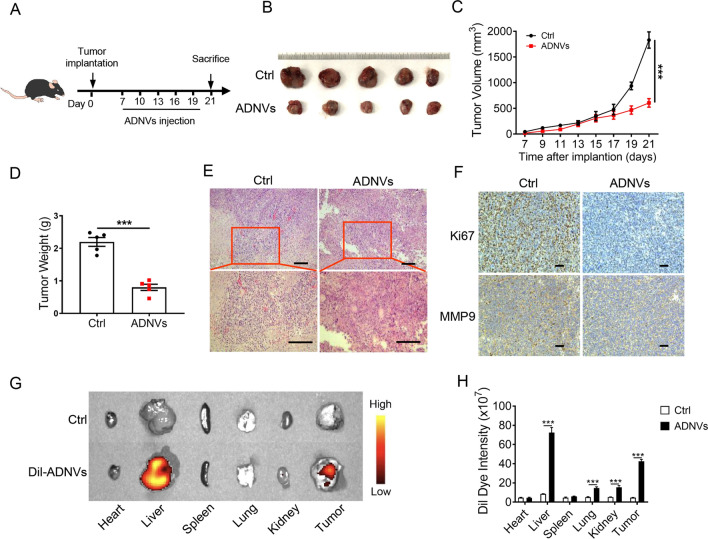
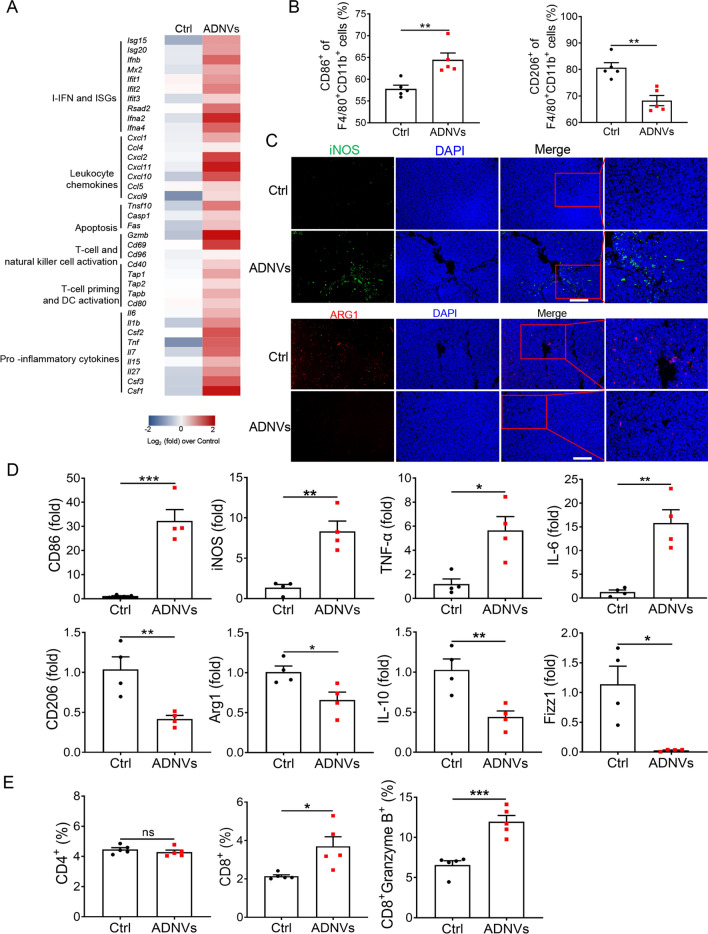
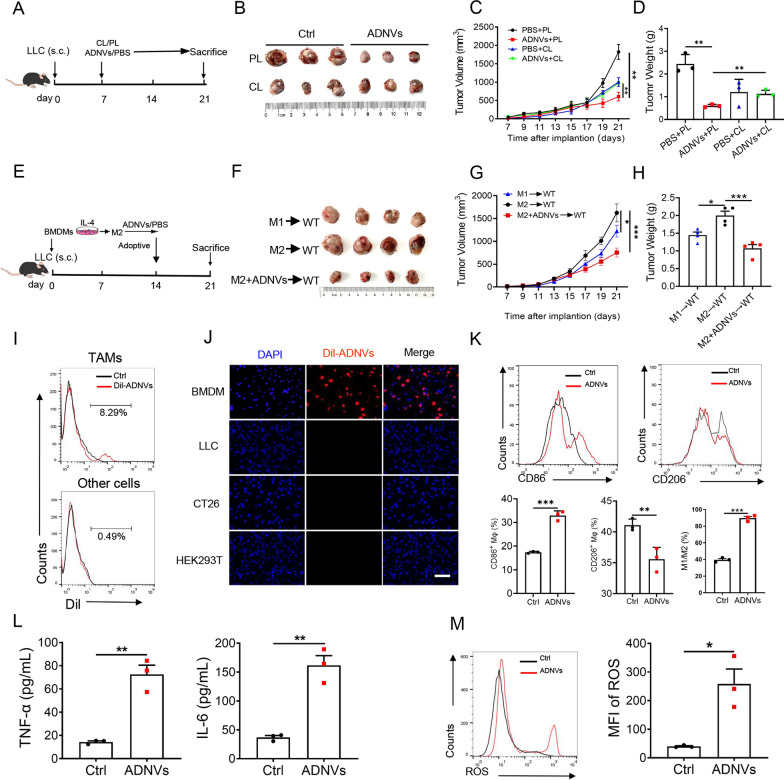
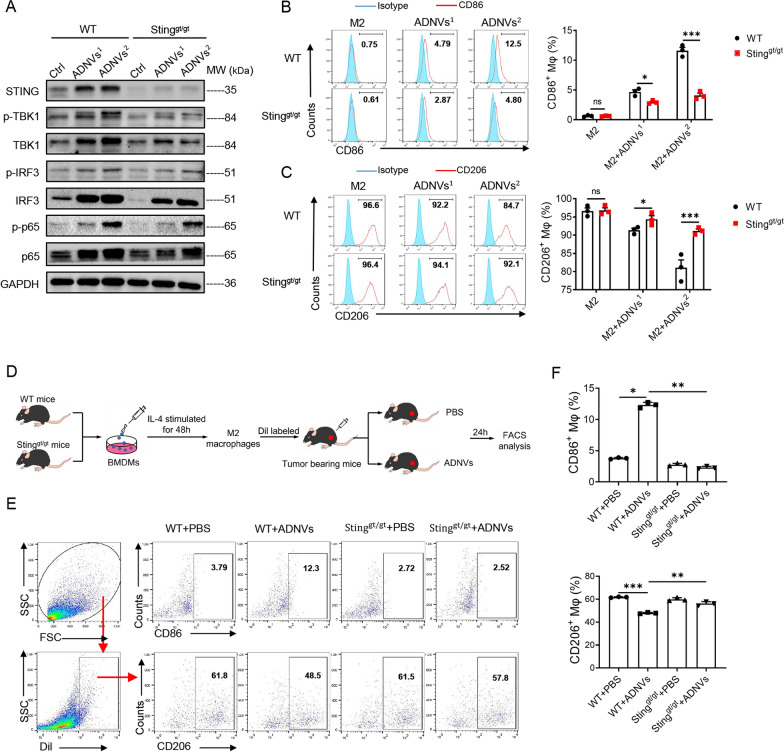
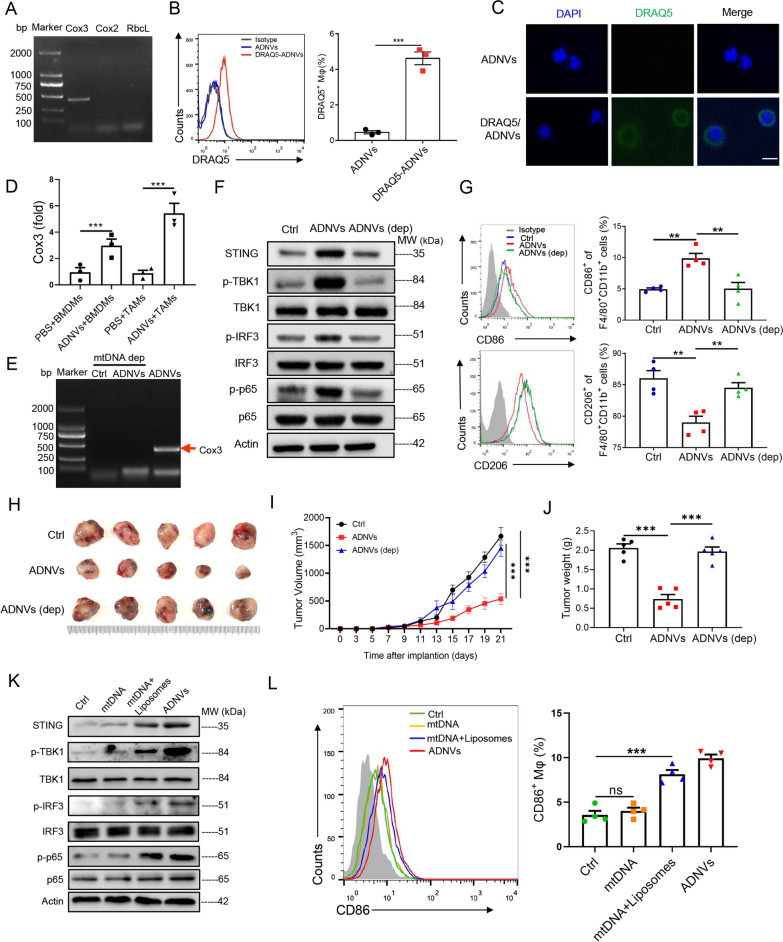
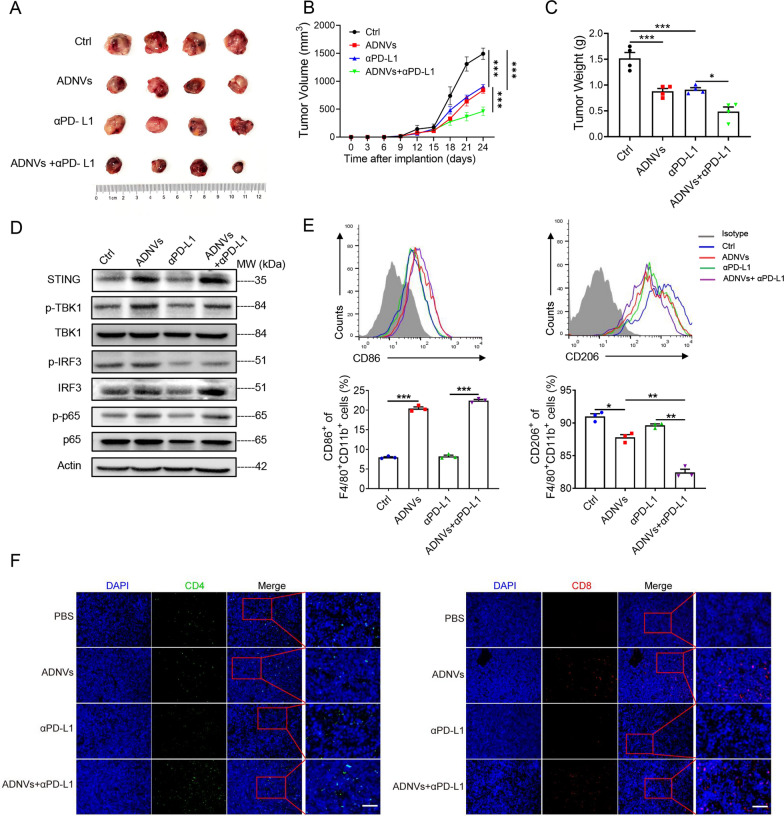
Plant-derived nanovesicles (PDNVs) have been proposed as a major mechanism for the inter-kingdom interaction and communication, but the effector components enclosed in the vesicles and the mechanisms involved are largely unknown. The plant Artemisia annua is known as an anti-malaria agent that also exhibits a wide range of biological activities including the immunoregulatory and anti-tumor properties with the mechanisms to be further addressed. Here, we isolated and purified the exosome-like particles from A. annua, which were characterized by nano-scaled and membrane-bound shape and hence termed artemisia-derived nanovesicles (ADNVs). Remarkably, the vesicles demonstrated to inhibit tumor growth and boost anti-tumor immunity in a mouse model of lung cancer, primarily through remolding the tumor microenvironment and reprogramming tumor-associated macrophages (TAMs). We identified plant-derived mitochondrial DNA (mtDNA), upon internalized into TAMs via the vesicles, as a major effector molecule to induce the cGAS-STING pathway driving the shift of pro-tumor macrophages to anti-tumor phenotype. Furthermore, our data showed that administration of ADNVs greatly improved the efficacy of PD-L1 inhibitor, a prototypic immune checkpoint inhibitor, in tumor-bearing mice. Together, the present study, for the first time, to our knowledge, unravels an inter-kingdom interaction wherein the medical plant-derived mtDNA, via the nanovesicles, induces the immunostimulatory signaling in mammalian immune cells for resetting anti-tumor immunity and promoting tumor eradication.

Keywords: Artemisia-derived nanovesicles; Tumor-associated macrophages; cGAS-STING; mtDNA.


Conflict of interest statement

The authors have no competing of interest to declare.

Figures

Fig. 1
Fig. 1
Purification and characterization of ADNVs. A ADNVs were isolated and purified by differential the centrifugation and sucrose gradient ultracentrifugation. B ADNVs harvested from the sucrose density gradient (30%) were characterized by TEM (Scale bar = 200/50 nm). C Particle size of the ADNVs was measured by NanoSight NS 300 system. D Surface charge was measured by a Zetasizer. E ADNVs-enclosed DNA was electrophoresis on a 1.2% agarose gel, and stained with EtBr. F Proteins of ADNVs were separated by 10% SDS-PAGE and stained with Coomassie blue. Shown are the representative results from at least three independent experiments
Fig. 2
Fig. 2
ADNVs inhibit lung cancer growth in mice. A The simplified experimental scheme. C57BL/6 mice (n = 5) were implanted with LLC cells for 7 d, and then treated with ADNVs (25 mg/kg, i.p.) once every 3 d for a successive 2 week. Mice were sacrificed and tumors were collected at day 21. B Gross photos of tumors at the end of experiments. C Tumor growth profiles in tumor-bearing mice treated PBS or ADNVs. ***p < 0.001 (Two-way ANOVA and Bonferroni post-tests). D Tumor weights in mice treated with either PBS or ADNVs. ***p < 0.001 (Student’s t-test). E H & E staining of tumor tissues (Scale bar = 100 μm). F Ki67 and MMP9 staining of tumor tissues (Scale bar = 100 μm). (G, H) ADNVs were stained with Dil and injected into tumor-bearing mice (25 mg/kg, i.p.). Biodistribution of ADNVs was determined by scanning mice (G), and the quantitative analysis (H). ***p < 0.001 (One-way ANOVA and Tukey’s significant difference post hoc test). The results are representative data from one of three independent experiments. Shown are representative images, and the data are presented as means ± SEM
Fig. 3
Fig. 3
ADNVs remold tumor microenvironment and reprogram TAM phenotypes. Mice were implanted with LLC and treated with ADNVs or vesicle as described in Fig. 2. Tumor tissues were collected at 21 d post inoculation. A Ranked analysis of differential gene expression. B Quantification of M1 (CD86+) and M2 (CD206+) populations by flow cytometry. **p < 0.01 (Student’s t-test). C Representative immunofluorescence staining for CD86 and CD206 at tumor sections (Scale bar = 100 μm). D qRT-PCR analysis of M1-marker genes (upper) and M2-related genes. *p < 0.05, **p < 0.01, ***p < 0.001 (Student’s t-test). E Quantification of CD4+, CD8+ and Granzyme B+ CD8+ cell populations in TME by flow cytometry. ns non-significant, *p < 0.05, ***p < 0.001 (Student’s t-test). The results are from one of three independent experiments. Shown are representative images, and the data are presented as means ± SEM
Fig. 4
Fig. 4
ADNVs are preferentially taken by TAMs and reprogram their phenotypes. A The simplified experimental scheme for B-D. C57BL/6 J mice were implanted with LLC cells for 7 d and then inoculated with clodronate liposomes (CL) or PBS-liposomes (PL) every 4 days to deplete TAMs. The mice were simultaneously administrated with ADNVs, and sacrificed at day 21 post implantation. B Gross photos of tumors at the end of experiments. C Tumor growth profiles. **p < 0.01 (Two-way ANOVA and Bonferroni post-tests). D Tumor weights at the end of the experiment. **p < 0.01 (One-way ANOVA and Tukey’s significant difference post hoc test). E Schematic outline of adoptive transfer of macrophages for F–H. M2 macrophages were prepared from BMDMs by stimulated with IL-4, and then treated with or without ADNVs (20 μg/mL). M1 macrophages, prepared by stimulation of IFN-ɣ, were used as a positive control. After that, the cells were adoptively transferred to tumor-bearing mice at day 14 post LLCs implantation. Mice were sacrificed at day 21. F Gross photos of tumors at the end of experiments. G Tumor growth profiles. *p < 0.05, ***p < 0.001 (Two-way ANOVA and Bonferroni post-tests). H Tumor weights at the end of the experiment. *p < 0.05, ***p < 0.001 (One-way ANOVA and Tukey’s significant difference post hoc test). I, J ADNVs were stained with Dil and injected into tumor-bearing mice (25 mg/kg, i.p.). Flow cytometry of Dilpos cells in macrophages and other cell populations in tumors (I). Immunofluorescence (IF) staining of BMDMs and other cell lines taking Dil-labelled ADNVs upon incubation. Scale bar = 200 μm. Nuclear: DAPI (J). (K-M) BMDMs were incubated with ADNVs or vehicles for 24 h. Quantification of M1 (CD86+) and M2 (CD206+) population by flow cytometry (K); ELISA assay of TNF-α and IL-6 levels (L); Flow cytometry of ROSpos macrophages and quantification of the mean fluorescence intensity (MFI) (M). *p < 0.05, **p < 0.01, ***p < 0.001 (Student’s t-test). The results are from one of two or three independent experiments. Shown are representative images, and the data are presented as means ± SEM
Fig. 5
Fig. 5
ADNVs promote the functional transition of TAMs through activation of the STING pathway. BMDMs from WT mice and STINGgt/gt mice were polarized into M2 type and then treated with two doses of ADNVs1 (20 μg/mL) or ADNVs2 (30 μg/mL) for 24 h. A Immunoblotting of STING and downstream signaling molecules in macrophages. B, C Flow cytometry analysis and quantification of M1 (CD86+) and M2 (CD206+) populations. ns: non-significant, *p < 0.05, ***p < 0.001 (Student’s t-test). D Diagram of workflow for the in vivo experiments. BMDMs from WT mice and STINGgt/gt mice were polarized into M2 type, labeled with Dil, and transferred into tumor-bearing mice. The animals were then treated with ADNVs for 24 h. E Flow cytometry and F quantification of the portion of M1 (CD86+) and M2 (CD206+) subsets respectively. *p < 0.05, **p < 0.01, ***p < 0.001 (One-way ANOVA and Tukey’s significant difference post hoc test). The results are from one of three independent experiments. Shown are representative images, and the data are presented as means ± SEM
Fig. 6
Fig. 6
Plant-derived mtDNA activates STING pathway to drive macrophage polarization. A PCR assay of the genes Cox3, Cox2 and RbcL in ADNVs. B, C ADNVs were stained by DRAQ5 and incubated with BMDMs for 6 h. Flow cytometry and quantification of the portion of DRAQ5+ cell population (***p < 0.001, Student’s t-test) B, and immunofluorescence staining showing mtDNA-taking of DRAQ5+ cells. Nuclei: DAPI; Scale bar = 50 μm (C). D qRT-PCR analysis of Cox3 gene expression in BMDMs treated with ADNVs or vehicle, or in TAMs isolated from mice that were administrated with ADNVs or PBS. ***p < 0.001 (One-way ANOVA and Tukey’s significant difference post hoc test). EG ADNVs were treated with or without EtBr (200 ng/mL) for 6 d to deplete mtDNA, and then applied to M2-polarized macrophages. PCR assay of Cox3 gene in ADNVs (E); Immunoblotting of STING and downstream signaling molecules (F); Flow cytometry and quantification of the percentages of M1 (CD86+) and M2 (CD206+) populations (G). **p < 0.01 (One-way ANOVA and Tukey’s significant difference post hoc test). HJ ADNVs were treated with or without EtBr to deplete mtDNA, and then injected into LLC-bearing mice (25 mg/kg, i.p.). H Gross photos of tumors at the end of experiments (21 day post LLCs inoculation. I Tumor growth profiles. ***p < 0.001 (Two-way ANOVA and Bonferroni post-tests). J Tumor weights evaluated at the end of the experiment. ***p < 0.001 (One-way ANOVA and Tukey’s significant difference post hoc test). K, L mtDNA was extracted from ADNVs, coated with or without liposomes and then applied to M2-polarized macrophages for 24 h. Immunoblotting of STING and downstream signaling molecules (K); Flow cytometry and quantification of the percentage of M1 (CD86+) populations (L). ns: non-significant, ***p < 0.001 (One-way ANOVA and Tukey’s significant difference post hoc test). The results are from one of two or three independent experiments. Representative images are shown and the data are presented as means ± SEM
Fig. 7
Fig. 7
ADNVs strengthen the immunotherapy efficacy of PD-L1 blockade in mice. C57BL/6 mice were implanted with LLC cells for 7 days, and then instilled with ADNVs (25 mg/kg), alone or with αPD-L1 antibody, every 3 days for 2 weeks. Tumors were collected at day 21 post-implantation. A Gross photos of tumors at the end of experiments. B Tumor growth profiles in mice. ***p < 0.001 (Two-way ANOVA and Bonferroni post-tests). C Tumor weights at the end of the experiment. *p < 0.05, ***p < 0.001 (One-way ANOVA and Tukey’s significant difference post hoc test). D Immunoblotting of STING and downstream signaling molecules in TAMs; E Flow cytometry and quantification of the portions of M1 (CD86+) and M2 (CD206+) population in TAMs. *p < 0.05, **p < 0.01, ***p < 0.001 (One-way ANOVA and Tukey’s significant difference post hoc test). F Immunofluorescence staining of CD4+ and CD8+ cells in tumors. Nuclei: DAPI; Scale bar = 50 μm. The results are from one of two independent experiments. Representative images are shown and the data are presented as means ± SEM

Similar articles

Cited by

References

    1. Cong M, Tan S, Li S, Gao L, Huang L, Zhang HG, Qiao H. Technology insight: Plant-derived vesicles-How far from the clinical biotherapeutics and therapeutic drug carriers? Adv Drug Deliv Rev. 2022;182:114108. doi: 10.1016/j.addr.2021.114108. - DOI - PubMed
    1. Pinedo M, de la Canal L, de Marcos LC. A call for Rigor and standardization in plant extracellular vesicle research. J Extracell Vesicles. 2021;10:e12048. doi: 10.1002/jev2.12048. - DOI - PMC - PubMed
    1. Dad HA, Gu TW, Zhu AQ, Huang LQ, Peng LH. Plant exosome-like nanovesicles: emerging therapeutics and drug delivery nanoplatforms. Mol Ther. 2021;29:13–31. doi: 10.1016/j.ymthe.2020.11.030. - DOI - PMC - PubMed
    1. Kameli N, Dragojlovic-Kerkache A, Savelkoul P, Stassen FR. Plant-derived extracellular vesicles: current findings, challenges, and future applications. Membranes (Basel) 2021;11:1. - PMC - PubMed
    1. Teng Y, Ren Y, Sayed M, Hu X, Lei C, Kumar A, Hutchins E, Mu J, Deng Z, Luo C, et al. Plant-derived exosomal MicroRNAs shape the gut microbiota. Cell Host Microbe. 2018;24:637–652 e638. doi: 10.1016/j.chom.2018.10.001. - DOI - PMC - PubMed