. 2023 Feb 13;26(3):106188.
doi: 10.1016/j.isci.2023.106188. eCollection 2023 Mar 17.

Spatiotemporal analysis of the future carbon footprint of solar electricity in the United States by a dynamic life cycle assessment

Affiliations

Spatiotemporal analysis of the future carbon footprint of solar electricity in the United States by a dynamic life cycle assessment

Jiaqi Lu et al. iScience. .

Abstract

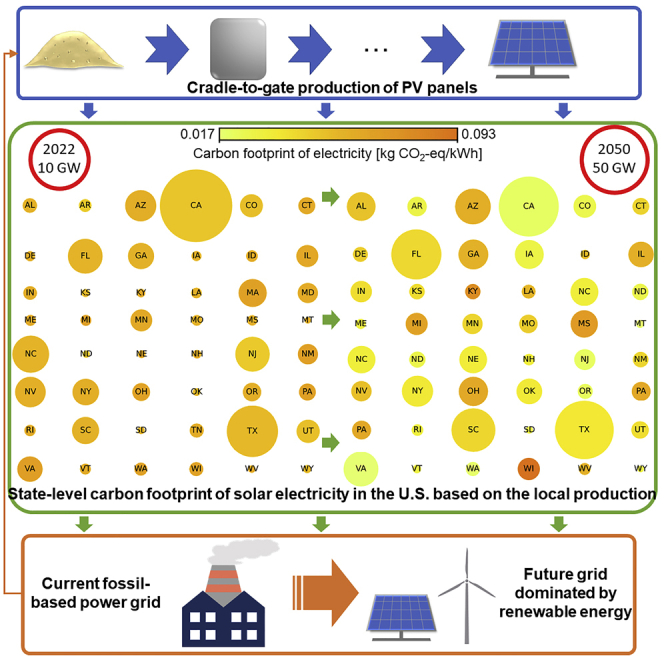
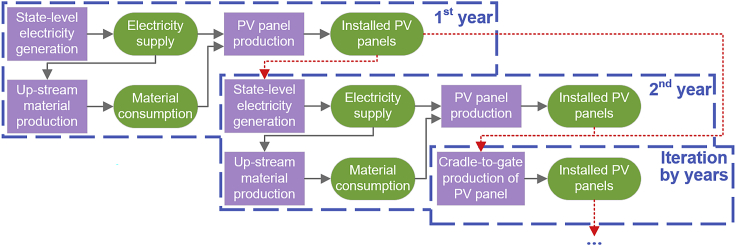
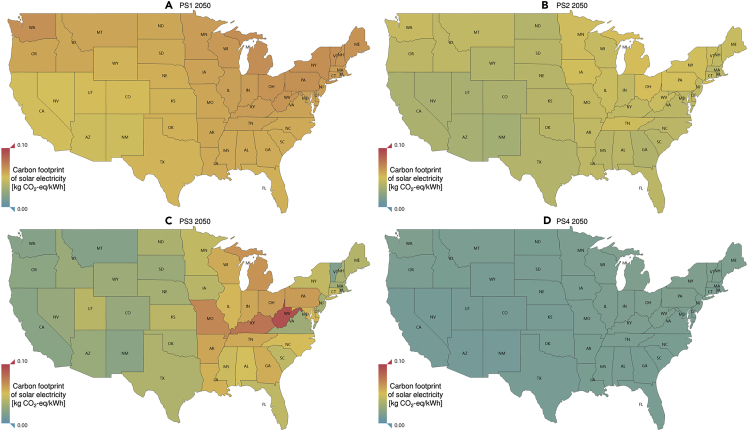
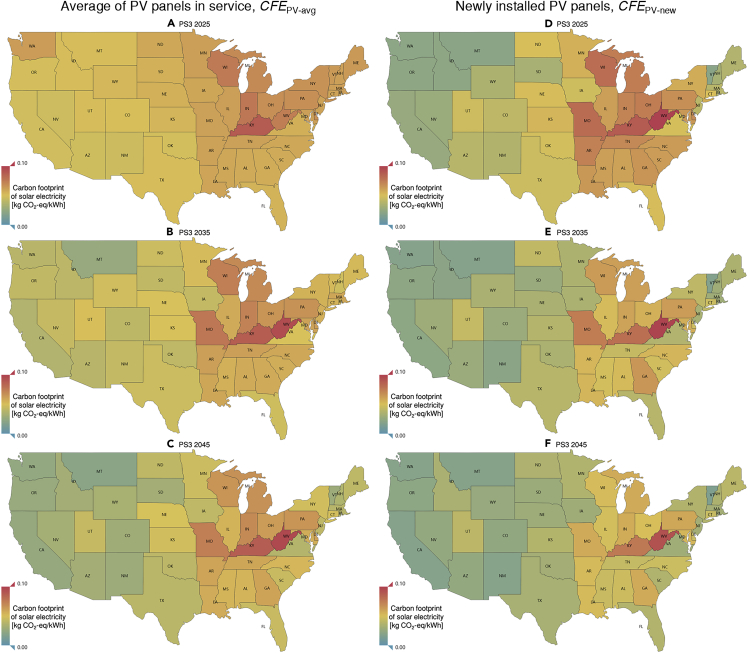
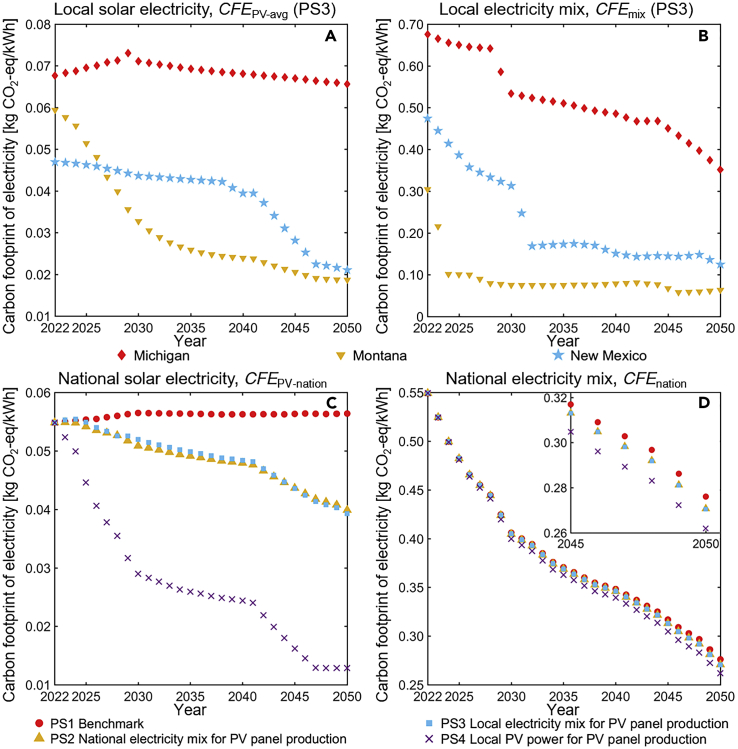
Solar photovoltaics (PVs) installation would increase 20-fold by 2050; however, considerable greenhouse gas (GHG) emissions are generated during the cradle-to-gate production, with spatiotemporal variances depending on the grid emission. Thus, a dynamic life cycle assessment (LCA) model was developed to assess the accumulated PV panels with a heterogeneous carbon footprint if manufactured and installed in the United States. The state-level carbon footprint of solar electricity (CFE PV-avg) from 2022 to 2050 was estimated using several cradle-to-gate production scenarios to account for emissions stemming from electricity generated from solar PVs. The CFE PV-avg (min 0.032, max 0.051, weighted avg. 0.040 kg CO2-eq/kWh) in 2050 will be significantly lower than that of the comparison benchmark (min 0.047, max 0.068, weighted avg. 0.056 kg CO2-eq/kWh). The proposed dynamic LCA framework is promising for planning solar PV supply chains and, ultimately, the supply chain of an entire carbon-neutral energy system to maximize the environmental benefits.

Keywords: energy sustainability; environmental assessment; global carbon cycle; risk assessment.


Conflict of interest statement

The authors declare no competing interests.

Figures

None
Graphical abstract
Figure 1
Figure 1
Schematic system boundary for modeling the carbon footprint of the solar electricity with spatiotemporal variations The cradle-to-gate production processes of photovoltaic (PV) panels in the same blue-dashed area represent the timescale in one year. The red dotted arrow indicates that the newly installed PV panels will continuously output electricity throughout the lifetime with the GHG emissions calculated in the production year.
Figure 2
Figure 2
The map projection for visualizing the state-level CFEPV-avg in 2050 varied by the four production scenarios (a-d, respectively) in Table 1 The missing states, namely Alaska and Hawaii, were not considered in this study. The background color of each state quantitatively represents the average carbon footprint of all PV panels in service with various production years. Similar results for CFEPV-new can be found in Table S1, CFEmix in Table S3.
Figure 3
Figure 3
The carbon footprint of solar electricity from PV panels in service compared with that of new ones The spatiotemporal comparison on the carbon footprint of solar electricity supplied by all PV panels in service (A–C) and newly installed ones (D and F) in 2025, 2035, and 2045, which is calculated based on PS3 for reflecting the efforts of different decarbonization pathways.
Figure 4
Figure 4
Analysis of the annual change of the carbon footprint (A) Carbon footprint of electricity from local solar PV generation for Michigan, Montana, and New Mexico; (B) Carbon footprint of electricity from local total generation portfolio for Michigan, Montana, and New Mexico; (C) Carbon footprint of electricity from national total solar PV generation, as predicted through 4 production scenarios; (D) Carbon footprint of electricity from total national generation portfolio, as predicted through 4 production scenarios. Similar results for California, Texas, and Florida can be found in Figure S1.
Figure 5
Figure 5
Energy community distribution across the U.S., based on estimation from Resources for the Future The energy community includes brownfields, high fossil fuel-employment areas, and coal communities.

References

    1. Rogelj J., Geden O., Cowie A., Reisinger A. Three ways to improve net-zero emissions targets. Nature. 2021;591:365–368. doi: 10.1038/d41586-021-00662-3. - DOI - PubMed
    1. The Intergovernmental Panel on Climate Change . Global Warming of 1.5°C: IPCC Special Report on Impacts of Global Warming of 1.5°C above Pre-industrial Levels in Context of Strengthening Response to Climate Change, Sustainable Development, and Efforts to Eradicate Poverty. Cambridge University Press; 2022. Mitigation pathways compatible with 1.5°C in the context of sustainable development; pp. 93–174. - DOI
    1. van Soest H.L., den Elzen M.G.J., van Vuuren D.P. Net-zero emission targets for major emitting countries consistent with the Paris Agreement. Nat. Commun. 2021;12:2140. doi: 10.1038/s41467-021-22294-x. - DOI - PMC - PubMed
    1. Liu Z., Deng Z., He G., Wang H., Zhang X., Lin J., Qi Y., Liang X. Challenges and opportunities for carbon neutrality in China. Nat. Rev. Earth Environ. 2021;3:141–155. doi: 10.1038/s43017-021-00244-x. - DOI
    1. Zhang S., An K., Li J., Weng Y., Zhang S., Wang S., Cai W., Wang C., Gong P. Incorporating health co-benefits into technology pathways to achieve China's 2060 carbon neutrality goal: a modelling study. Lancet Planet. Health. 2021;5:e808–e817. doi: 10.1016/S2542-5196(21)00252-7. - DOI - PubMed