. 2023 Feb 8;26(3):106157.
doi: 10.1016/j.isci.2023.106157. eCollection 2023 Mar 17.

The mechanism underlying toxicity of a venom peptide against insects reveals how ants are master at disrupting membranes

Affiliations

The mechanism underlying toxicity of a venom peptide against insects reveals how ants are master at disrupting membranes

Steven Ascoët et al. iScience. .

Abstract

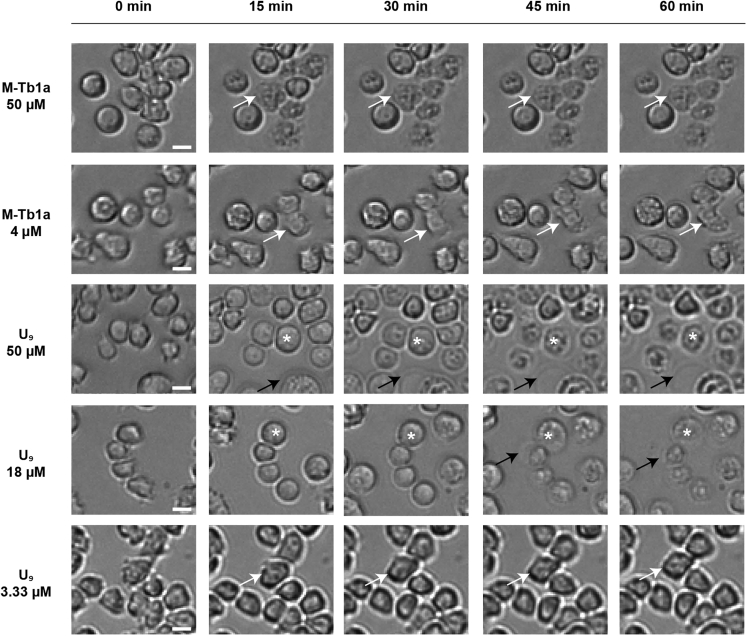
Hymenopterans represent one of the most abundant groups of venomous organisms but remain little explored due to the difficult access to their venom. The development of proteo-transcriptomic allowed us to explore diversity of their toxins offering interesting perspectives to identify new biological active peptides. This study focuses on U9 function, a linear, amphiphilic and polycationic peptide isolated from ant Tetramorium bicarinatum venom. It shares physicochemical properties with M-Tb1a, exhibiting cytotoxic effects through membrane permeabilization. In the present study, we conducted a comparative functional investigation of U9 and M-Tb1a and explored the mechanisms underlying their cytotoxicity against insect cells. After showing that both peptides induced the formation of pores in cell membrane, we demonstrated that U9 induced mitochondrial damage and, at high concentrations, localized into cells and induced caspase activation. This functional investigation highlighted an original mechanism of U9 questioning on potential valorization and endogen activity in T. bicarinatum venom.

Keywords: Biochemistry; Entomology; Toxicology.


Conflict of interest statement

The authors declare no competing interests.

Figures

None
Graphical abstract
Figure 1
Figure 1
Paralytic activity of M-Tb1a and U9 against Lucilia caesar The curve was obtained from the injection of M-Tb1a and U9 into blowflies (L. caesar). Percentage was determined 1h after injection. Values are represented as mean ± SEM of three independent experiments.
Figure 2
Figure 2
Cytotoxic activities of M-Tb1a and U9 against Drosophila S2 cells The results were obtained from CCK-8 and LDH assays. (A) Log(LC50) of M-Tb1a are 0.71 ± 0.02 (5.16 μM) and 0.58 ± 0.03 (3.8 μM) for CCK-8 and LDH assays respectively. (B) Log(LC50) of U9 are 0.5 ± 0.01 (3.15 μM) and 1.25 ± 0.04 (17.97 μM) for CCK-8 and LDH assays respectively. The data were normalized from the control according to the manufacturer’s recommendations. Values are represented as mean ± SEM (n = 1–8).
Figure 3
Figure 3
Evolution of morphotypes of S2 cells exposed to M-Tb1a or U9 peptides Evolution of treated S2 cells morphology for 1 h after exposure to graded concentrations of M-Tb1a and U9 (white arrows indicate cells with morphological changes; black arrows show membrane blebs; asterisks indicate cell swelling). Scale bar: 10 μm. See also Video S1.
Figure 4
Figure 4
Permeabilization effects of M-Tb1a and U9 peptides on S2 cells Cell permeabilization was monitored by the entry of 7-AAD dye and binding to the nucleus. (A) Cell morphotypes and 7-AAD uptake during exposure to U9 at 50 μM for 1h. (B and C) Relative fluorescence intensity during 1h exposure with either peptide at high concentration (50 μM), LC50 (4 or 18 μM), and sublytic concentration (3.33 μM). Values are represented with mean ± SEM Statistical analysis with Mann-Whitney (NS: p > 0.05, ∗: p < 0.05, ∗∗: p < 0.01) test (n = 3–5). Scale bar: 10 μm.
Figure 5
Figure 5
U9 and M-Tb1a induced membrane pore formations Pore formations observed by SEM after exposure to peptides during different exposure times: untreated; M-Tb1a at 4 μM; U9 at 18 μM and 3.33 μM. Red arrows indicate pores. Red boxes indicate vesicle-like elements on the cell surface. Scale bar: 2 μm.
Figure 6
Figure 6
Mitochondrial damage induced by U9 TEM analysis of mitochondrial morphotypes of untreated or treated S2 cells for different exposure times (30 min to 2h): M-Tb1a at 4 μM; U9 at 18 μM or at 3.33 μM. M: Mitochondria; DM: damaged mitochondria; ES: extracellular space; N: nucleus; ER: ER Black arrows: membrane rupture. Scale bar: 200 nm.
Figure 7
Figure 7
Dcp1/DrICE caspase activation and U9-induced caspase-independent cytotoxic effect on S2 cells (A) Fluorescence of S2 cells after caspase activation induced by 24h exposure to M-Tb1a or U9 at high (50 μM), LC50 (4 or 18 μM) and sublytic (3.33 μM) concentration. Scale bar: 10 μm. (B) Mean fluorescence intensity after exposure to peptide at different concentrations ranging from 50 μM to 1 μM, or CHX at 10 μM for 24h. Values are represented by a box and whiskers including replicates. Statistical analysis with Kruskal-Wallis test in comparison with Untreated (∗: p < 0.05, ∗∗∗: p < 0.01; ∗∗∗∗: p < 0.0001) or CHX (N.S: p > 0.05, ###: p < 0.001) conditions (n = 7–12). (C and D) Cytotoxic activity of U9 and M-Tb1a peptides with or without the 100 μM caspase inhibitor zVAD measured by CCK-8 (C) and LDH (D) assays. Data were normalized to control according to the manufacturer’s recommendations and represented as mean ± SEM Statistical analysis with Kruskal-Wallis (N.S: p > 0.05, ∗∗∗∗: p < 0.0001) or t-student (N.S: p > 0.05, #: p < 0.01, ##: p < 0.001) tests (n = 9–12).
Figure 8
Figure 8
Localization of U9 peptide at the membrane after exposure to non-permeabilized S2 cells Indirect immunocytochemistry visualization by binding anti-U9 antibody the membrane of non-permeabilized cells: DAPI and FITC show the nucleus and cytoskeleton of S2 cells, respectively. TexasRed shows the non-specific binding sites of the anti-U9 primary antibody for untreated cells and the localization of U9 for cells treated with the peptide at 18 μM and 3.33 μM for various exposure times (30 min to 2h). White arrows indicate U9 peptide localization; asterisks indicate actin vesicles-like. Scale bar: 2 μm.
Figure 9
Figure 9
U9 peptide entry into the permeabilized S2 cells Indirect immunocytochemistry visualization by binding anti-U9 antibody in permeabilized cells: DAPI and FITC show the nucleus and cytoskeleton of S2 cells, respectively. TexasRed shows the non-specific binding sites of anti-U9 primary antibody for untreated cells and the localization of U9 for cells treated with the 18 μM peptide for various exposure times (30 min to 2h). Asterisks show actin vesicles-like. Scale bar: 2 μm.
Figure 10
Figure 10
Solution structures of the U9 and M-Tb1a peptides For each peptide, the superimposed 15 lowest-energy structures are represented in cartoon. Amino acids are labeled in blue.
Figure 11
Figure 11
Presumable pathway of M-Tb1a and U9 cytotoxicity (A) potential mechanism of M-Tb1a against S2 cells via pore formation leading to a complete membrane disruption. (B) potential mechanism of U9 against S2 cells including a necrosis part and an apoptosis-like part framed in blue and orange respectively. The green elements are based on experimental data from this study whereas the red elements are based on theoretical data from the literature. Created with BioRender.com.

References

    1. Bordon K.d.C.F., Cologna C.T., Fornari-Baldo E.C., Pinheiro-Júnior E.L., Cerni F.A., Amorim F.G., Anjolette F.A.P., Cordeiro F.A., Wiezel G.A., Cardoso I.A., et al. From animal poisons and venoms to medicines: achievements, challenges and perspectives in drug discovery. Front. Pharmacol. 2020;11:1132. doi: 10.3389/fphar.2020.01132. - DOI - PMC - PubMed
    1. Herzig V., Cristofori-Armstrong B., Israel M.R., Nixon S.A., Vetter I., King G.F. Animal toxins — nature’s evolutionary-refined toolkit for basic research and drug discovery. Biochem. Pharmacol. 2020;181 doi: 10.1016/j.bcp.2020.114096. - DOI - PMC - PubMed
    1. Pennington M.W., Czerwinski A., Norton R.S. Peptide therapeutics from venom: current status and potential. Bioorg. Med. Chem. 2018;26:2738–2758. doi: 10.1016/j.bmc.2017.09.029. - DOI - PubMed
    1. Smallwood T.B., Clark R.J. Advances in venom peptide drug discovery: where are we at and where are we heading? Expet Opin. Drug Discov. 2021;16:1163–1173. doi: 10.1080/17460441.2021.1922386. - DOI - PubMed
    1. Yacoub T., Rima M., Karam M., Sabatier J.M., Fajloun Z. Antimicrobials from venomous animals: an overview. Molecules. 2020;25:2402. doi: 10.3390/molecules25102402. - DOI - PMC - PubMed

LinkOut - more resources