. 2023 Feb 11:28:366-384.
doi: 10.1016/j.omtm.2023.02.004. eCollection 2023 Mar 9.

A lentiviral vector B cell gene therapy platform for the delivery of the anti-HIV-1 eCD4-Ig-knob-in-hole-reversed immunoadhesin

Affiliations

A lentiviral vector B cell gene therapy platform for the delivery of the anti-HIV-1 eCD4-Ig-knob-in-hole-reversed immunoadhesin

Eirini Vamva et al. Mol Ther Methods Clin Dev. .

Abstract

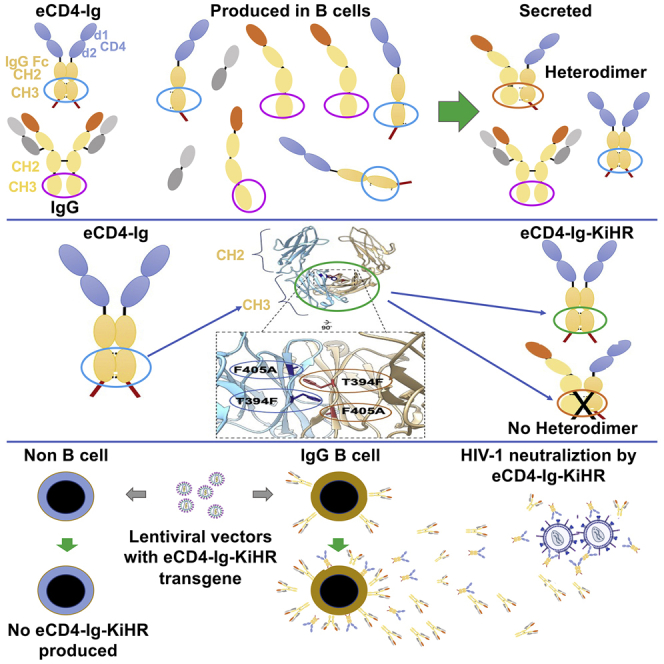
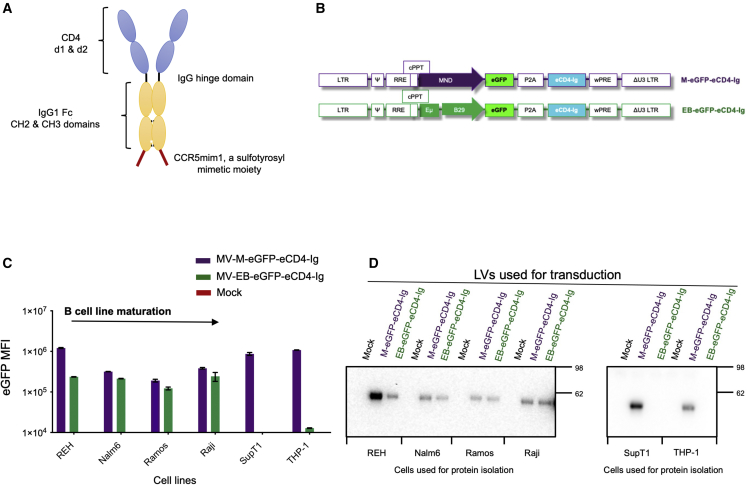
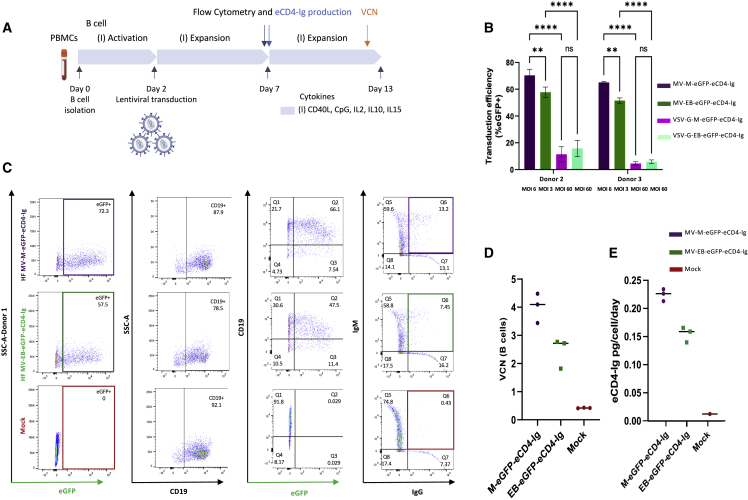
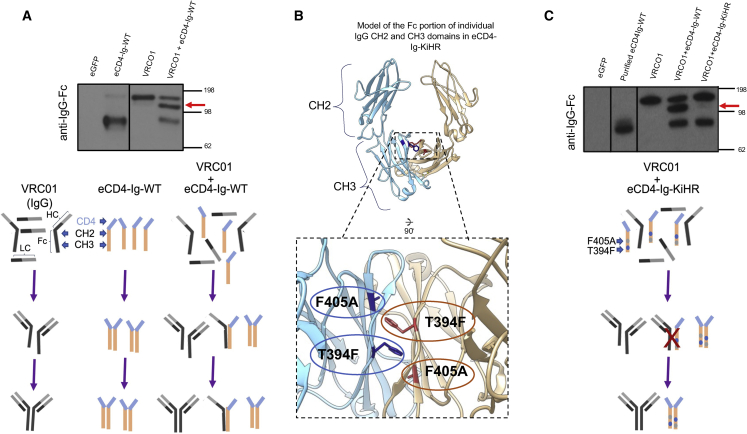
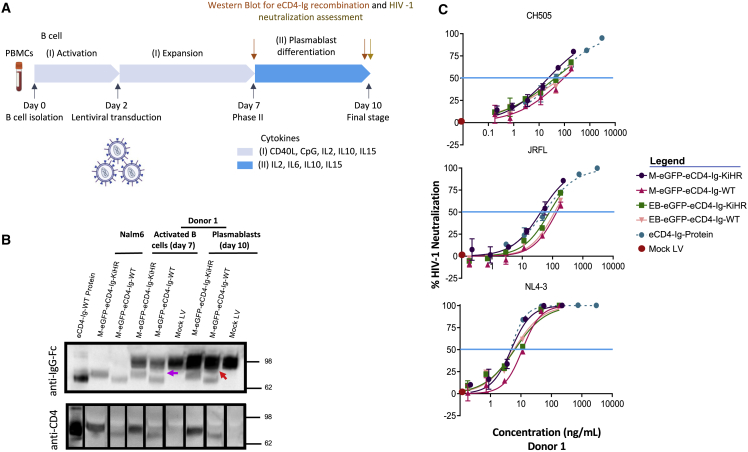
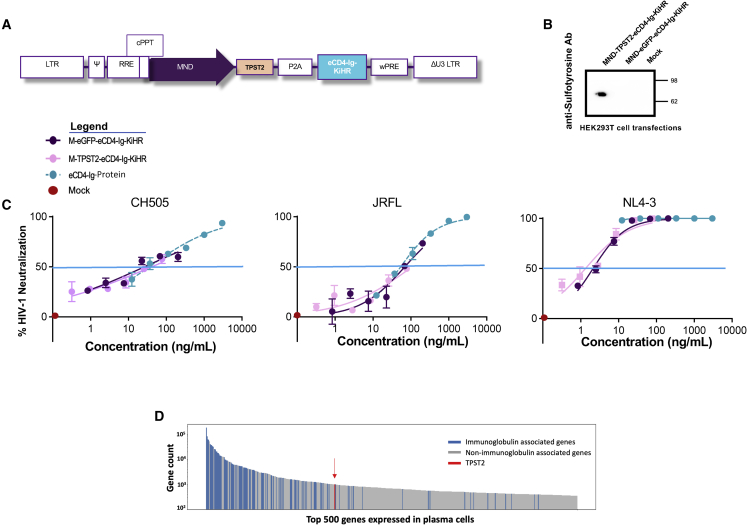
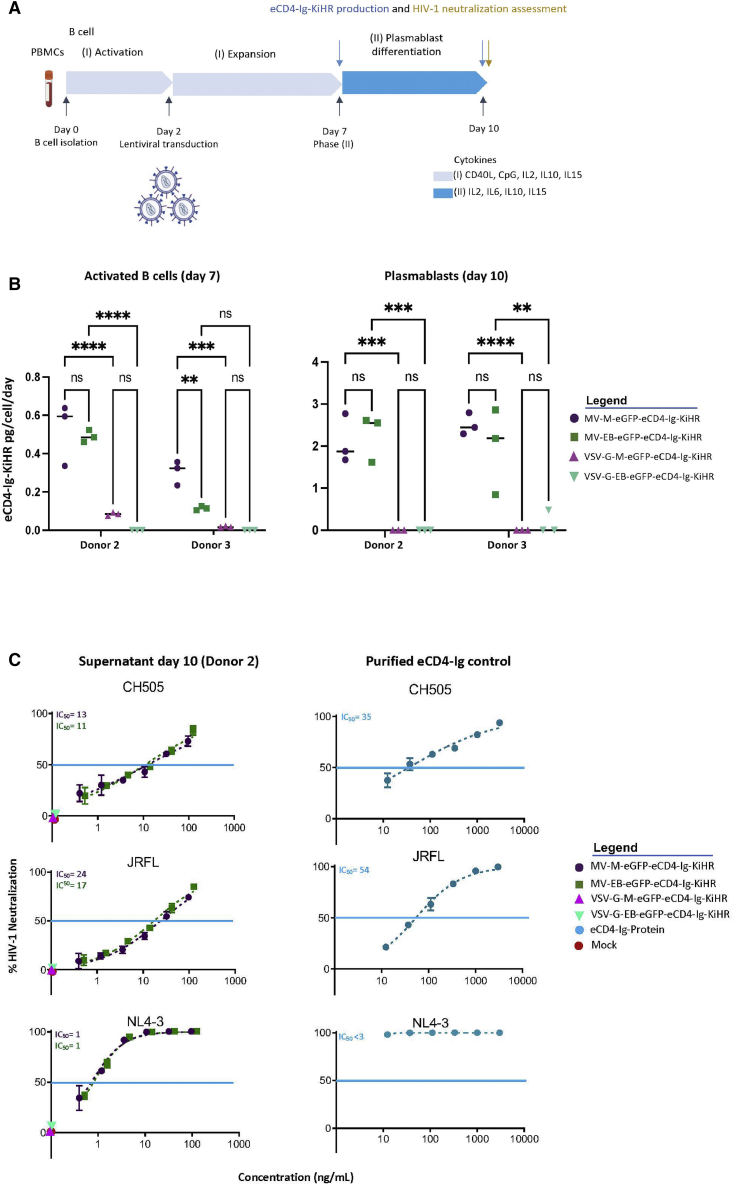
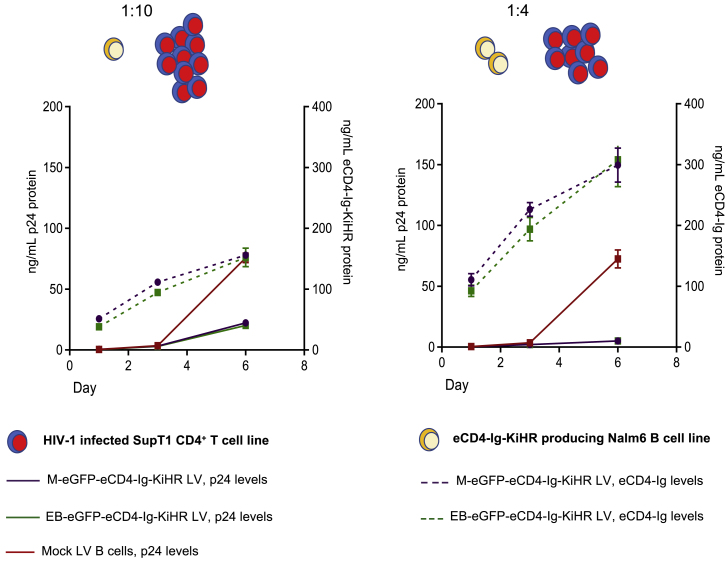
Barriers to effective gene therapy for many diseases include the number of modified target cells required to achieve therapeutic outcomes and host immune responses to expressed therapeutic proteins. As long-lived cells specialized for protein secretion, antibody-secreting B cells are an attractive target for foreign protein expression in blood and tissue. To neutralize HIV-1, we developed a lentiviral vector (LV) gene therapy platform for delivery of the anti-HIV-1 immunoadhesin, eCD4-Ig, to B cells. The EμB29 enhancer/promoter in the LV limited gene expression in non-B cell lineages. By engineering a knob-in-hole-reversed (KiHR) modification in the CH3-Fc eCD4-Ig domain, we reduced interactions between eCD4-Ig and endogenous B cell immunoglobulin G proteins, which improved HIV-1 neutralization potency. Unlike previous approaches in non-lymphoid cells, eCD4-Ig-KiHR produced in B cells promoted HIV-1 neutralizing protection without requiring exogenous TPST2, a tyrosine sulfation enzyme required for eCD4-Ig-KiHR function. This finding indicated that B cell machinery is well suited to produce therapeutic proteins. Lastly, to overcome the inefficient transduction efficiency associated with VSV-G LV delivery to primary B cells, an optimized measles pseudotyped LV packaging methodology achieved up to 75% transduction efficiency. Overall, our findings support the utility of B cell gene therapy platforms for therapeutic protein delivery.

Keywords: B cell gene delivery; HIV-1 neutralization; Measles envelope pseudotype; eCD4-Ig; hematopoietic; immunoadhesin; leniviral transgene regulation; lentiviral; protein engineering.


Conflict of interest statement

The authors declare no competing interests.

Figures

None
Graphical abstract
Figure 1
Figure 1
The B cell EμB29 promoter confers B cell lineage eCD4-Ig expression (A) Schematic of the eCD4-Ig protein structure. (B) Schematics of lentiviral vectors (LVs) with constitutive MND (M-eGFP-eCD4-Ig) promoter or EμB29 B cell lineage (EB-eGFP-eCD4-Ig) enhancer/promoter regulating eGFP and eCD4-Ig expression. The schematic defines the cis-acting elements and open reading frames (ORFs) in the following order: the 5′ long terminal repeats (LTRs), the packaging psi element (Ψ), the Rev response element (RRE), the central polypurine tract (cPPT), each respective promoter, the eGFP and eCD4-Ig ORFs separated by a P2A self-cleaving peptide, the woodchuck hepatitis virus post-transcriptional regulatory element (WPRE), and the 3′ LTR containing a deletion in the U3 region (ΔU3 LTR). (C) Mean fluorescence intensity (MFI) of eGFP expression from human B, T (SupT1 CD4+ T), and myeloid (THP-1) cell lines transduced with M-eGFP-eCD4-Ig (purple) or EB-eGFP-eCD4-Ig (green). Flow cytometry was performed 7 days post LV transduction. B cell lines assessed were of different maturation stages. (D) Assessment of eCD4-Ig production in culture supernatants from B cell, T cell, and myeloid cell lines 7 days post mock, M-eGFP-eCD4-Ig, or EB-eGFP-eCD4-Ig LV transduction. eCD4-Ig was detected using SDS-PAGE and anti-IgG western blot analysis. Bar graphs are mean ± SD of triplicates of representative experiments.
Figure 2
Figure 2
Optimization of measles pseudotyped lentiviral vector transduction of primary human B cells (A) Schematic of the workflow and timeline of the B cell studies performed. Primary B cells were isolated from PBMCs of donors 2 and 3. See materials and methods for culture conditions, assays, flow cytometry, and vector copy number per cell (VCN) information. (B) Comparison of B cell transduction efficiencies of MV-M-eGFP-eCD4-Ig, MV-EB-eGFP-eCD4-Ig, VSV-G-M-eGFP-eCD4-Ig, and VSV-G-EB-eGFP-eCD4-Ig LVs. LV transduction efficiency was assessed by flow cytometry for eGFP 5 days post transduction (n = 3, mean and SD are shown; ns, not significant; ∗∗p < 0.01, ∗∗∗∗p < 0.0001). Donors 2 and 3 are shown. (C) Representative flow-cytometric analysis of B cells transduced with MV-M-eGFP-eCD4-Ig, MV-EB-eGFP-eCD4-Ig, and mock (no LV). B cells were assessed by flow cytometry for eGFP, CD19, IgM, and IgG expression 5 days post LV transduction. Donor 1 is shown. (D) Genomic DNA was extracted 11 days post LV transduction from both B cell donor cells to assess the VCN. (E) Supernatants from LV transduced primary B cells were harvested 5 days post LV transduction (expansion period day 7) and assessed for eCD4-Ig production. eCD4-Ig production was normalized to the total number of live cells per day post transduction. Data presented are mean ± SD of triplicates, with the ranges shown.
Figure 3
Figure 3
Knob-in-hole-reversed eCD4-Ig variant diminishes cellular eCD4-Ig recombination with co-expressed anti-HIV VRCO1 IgG1 bNAb (A) A non-reducing anti-IgG western blot from supernatants obtained from transiently transfected HEK293T cells with eCD4-Ig (WT), the anti-HIV bNAb VRCO1 IgG, or co-transfection of both plasmids. The red arrow identifies the VRCO1 and eCD4-Ig heterodimer band. A pictorial representation of the gel findings is shown: HC, IgG heavy chain; LC, IgG light chain; Fc domain showing CH2 and CH3 domain. Figures are not to relative scale. (B) A ribbon structural model showing the individual monomers (blue and tan) of the Fc portion of CH2 and CH3 domains of eCD4-Ig (see also Figure 1A), in which the CH3 dimerization interface was engineered to construct the eCD4-Ig knob-in-hole-reversed (KiHR). Shown are the KiHR mutations F405A and T394F in the CH3 dimerization interface (red and blue colored residues) which are predicted to sterically clash with CH3 domains of non-KiHR CH3 antibody domains. See materials and methods for additional information. (C) A non-reducing anti-IgG western blot analysis of HEK293T cell supernatants from cells transiently transfected with the plasmids eCD4-Ig or VRCO1, or co-transfected with the VRCO1 and eCD4-Ig-WT or VRCO1 and eCD4-Ig-KiHR plasmid combinations. The red arrow identifies the VRCO1 and eCD4-Ig-WT heterodimer band in the western blot lane. Note the presence of independent VRCO1 IgG and eCD4-Ig-KiHR bands in the co-expressed VRCO1 and eCD4-Ig-KiHR lanes and the lack of a heterodimer band. An illustration below the gel figure is a pictorial representation of the gel findings for eCD4-Ig-KiHR and VCR01 IgG lane.
Figure 4
Figure 4
Assessment of eCD4-Ig and eCD4-Ig KiHR expression in primary B cells, and the capacity of B cell secreted eCD4-Ig and eCD4-Ig KiHR to neutralize HIV-1 (A) Schematic of the workflow of B cell studies performed. See materials and methods for culture condition information. B cells were from donor 1. (B) Non-reducing western blot analysis for detection of IgG and CD4 from supernatants of Nalm6 cells, activated B cells, and differentiated plasmablasts transduced with the LVs listed (see legend). Supernatants were harvested 3 days post transduction from Nalm6 cells, for expanded B cells on day 7 and plasmablasts on day10. Twenty microliters of supernatants from cell culture was loaded for analysis, recombinant eCD4-Ig was used as a positive control, and supernatants from mock LV transduced activated B cells and differentiated plasmablasts were used as negative controls. Red arrow identifies heterodimer association. (C) HIV-1 neutralizing capacity of day-10 B cell plasmablast supernatants from B cells transduced with listed LVs or no LV (mock). Cell supernatants were evaluated for HIV-1 neutralizing potency against the HIV-1 isolates NL4-3, JRFL, and CH505, as described in materials and methods. Purified recombinant eCD4-Ig was used as a positive control, and supernatant from mock LV transduced B cells was used as a negative control. Blue horizontal line marksIC50, and graph points show range and average of duplicates. The lack of sample assay range is due to lack of variance between individual assays. IC50s were calculated from six dilution points of each supernatant. Paired one-sided Welch’s t test was used for analysis; IC50 HIV-1 neutralization assessment of n = 6 eCD4-Ig-WT and n = 6 eCD4-Ig-KiHR repeats, with three repeats for each LV promoter, p < 0.022.
Figure 5
Figure 5
Ectopically expressed TPST2 in primary B cells does not improve eCD4-Ig-KiHR HIV-1 neutralization functionality (A) TPST2-P2A-eCD4-Ig LV schematic with the constitutive (MND-M) promoter. The LV elements are as described in Figure 1B. (B) Representative anti-sulfotyrosine non-reducing western blot analysis from supernatants of HEK293T cells transfected with the pM-TPST2-eCD4-Ig-KiHR or pM-rGFP-eCD4-Ig-KiHR LV plasmids. Supernatants were harvested 4 days post transfection and evaluated to verify the presence of eCD4-Ig-KiHR using an anti-CD4 ELISA assay as described in materials and methods. Next, supernatants containing equal amounts of eCD4-Ig-KiHR (20 mg) were analyzed by SDS-PAGE and western blot analysis using anti-sulfotyrosine antibody to detect sulfonylation of eCD4-Ig-KiHR. (C) Stable LV transduction of primary B cells with M-TPST2-eCD4-Ig-KiHR LV did not enhance the HIV-1 neutralization functionality of eCD4-Ig-KiHR. B cell cultures were established as described in Figure 4A, and on day 10 culture supernatants were collected and evaluated for eCD4-Ig-KiHR amounts using anti-gp140 ELISA. HIV-1 neutralization assays were performed as described in Figure 4C and materials and methods, using equal amounts of eCD4-Ig-KiHR-containing supernatants to evaluate the effect of ectopically expressed TPST2 on eCD4-Ig-KiHR HIV-1 neutralization functionality. Purified eCD4-Ig was used as a positive control, and supernatant from mock untransduced B cells was used as a negative control. Blue horizontal line marks IC50, and graph points show range and average of duplicates. Note overlapping IC50S intersect (blue line)for all HIV-1 isolates and all are within the assay variance. IC50s were calculated from six dilution points of each supernatant. (D) TPST2 is highly expressed in B cells. RNA sequencing was performed on CD138+ cells enriched from human plasma cell cultures. Raw counts were averaged for the top 500 expressed genes (n = 4 donors), and the results are plotted. Red arrow identifies TPST2 gene location.
Figure 6
Figure 6
MV LV B cell transduction of activated B cells results in eCD4-Ig production in activated B cells and plasmablasts and increasing production of eCD4-Ig in plasmablasts (A) Schematic of the workflow of B cell studies performed. Supernatants were collected and assessed for eCD4-Ig-KiHR production on days 7 and 10 and for HIV-1 neutralization capacity on day 10. See materials and methods for culture condition information. B cells from donors 2 and 3. (B) eCD4-Ig-KiHR production from the listed (see legend) stably LV transduced B cells were normalized to the total number of live cells per day for each collection time. Data presented in dot plots are mean ± SD of triplicates. ns, not significant; ∗∗p < 0.01, ∗∗∗p < 0.01, ∗∗∗∗p < 0.0001. (C) eCD4-Ig-KiHR-containing supernatants from MV, but not VSV-G, pseudotyped LV transduced and differentiated plasmablasts can efficiently neutralize HIV-1 isolates. Supernatants were evaluated for eCD4-Ig-KiHR neutralization capacity from B cells. The neutralization assay, and HIV-1s used for evaluation, are described in Figure 4C. Paired one-sided Welch’s t test on IC50 HIV-1 neutralization assessment of n = 6 eCD4-Ig-WT and n = 6 eCD4-Ig-KiHR repeats, three repeats for each LV promoter, p < 0.022. Blue horizontal line marks IC50, and graph points show range and average of duplicates. For some samples, the lack of range is due to lack of variance between individual assays. IC50s were calculated from six dilution points of each supernatant of interest.
Figure 7
Figure 7
Nalm6 B cell line expression of eCD4-Ig-KiHR prevents NL4-3 HIV-1 spread in SupT1 CD4+ T cells in a cell co-culture model of HIV-1 infection Nalm6 B cells were transduced with either M-eGFP-eCD4-Ig-KiHR or EB-eGFP-eCD4-Ig-KiHR LVs and later mixed at a 1:10 or a 1:4 ratio of Nalm6 eCD4-Ig-expressing cells to NL4-3 HIV-1-infected SupT1 CD4+ T cells. At the time of addition to Nalm6 B cells for co-culturing, SupT1 CD4+ T cells were ∼10% NL4-3 HIV-1 positive by p24 flow cytometry. Mock LV transduced Nalm6 cells (red lines) were used as controls. Cultures evaluated for HIV-1 p24 protein production (black solid lines, left axis) and eCD4-Ig production (dotted lines, right axis) on days 1, 3, and 6 post culture establishment. Dot plots indicate average protein production from four repeats, and error bars show SD. p < 0.001 for both co-culture ratios and for M and EB eCD4-Ig regulated LVs.

References

    1. HIV.gov/hiv-basics/overview/data-and-trends/global-statistics (2021). HIV global statistics.
    1. Kiem H.P., Jerome K.R., Deeks S.G., McCune J.M. Hematopoietic-stem-cell-based gene therapy for HIV disease. Cell Stem Cell. 2012;10:137–147. - PMC - PubMed
    1. Stan R., Zaia J.A. Practical considerations in gene therapy for HIV cure. Current HIV/AIDS reports. 2014;11:11–19. - PMC - PubMed
    1. Swan C.H., Buhler B., Steinberger P., Tschan M.P., Barbas C.F., 3rd, Torbett B.E. T-cell protection and enrichment through lentiviral CCR5 intrabody gene delivery. Gene Ther. 2006;13:1480–1492. - PubMed
    1. Yuan J., Wang J., Crain K., Fearns C., Kim K.A., Hua K.L., Gregory P.D., Holmes M.C., Torbett B.E. Zinc-finger nuclease editing of human cxcr4 promotes HIV-1 CD4(+) T cell resistance and enrichment. Mol. Ther. 2012;20:849–859. - PMC - PubMed