. 2023 Feb 28:18:1063-1083.
doi: 10.2147/IJN.S398446. eCollection 2023.

Long Non-Coding RNAs Within Macrophage-Derived Exosomes Promote BMSC Osteogenesis in a Bone Fracture Rat Model

Affiliations

Long Non-Coding RNAs Within Macrophage-Derived Exosomes Promote BMSC Osteogenesis in a Bone Fracture Rat Model

Dong Wang et al. Int J Nanomedicine. .

Abstract

Purpose: To investigate the effect of macrophage exosomal long non-coding (lnc)RNAs on bone mesenchymal stem cell (BMSC) osteogenesis and the associated mechanism.

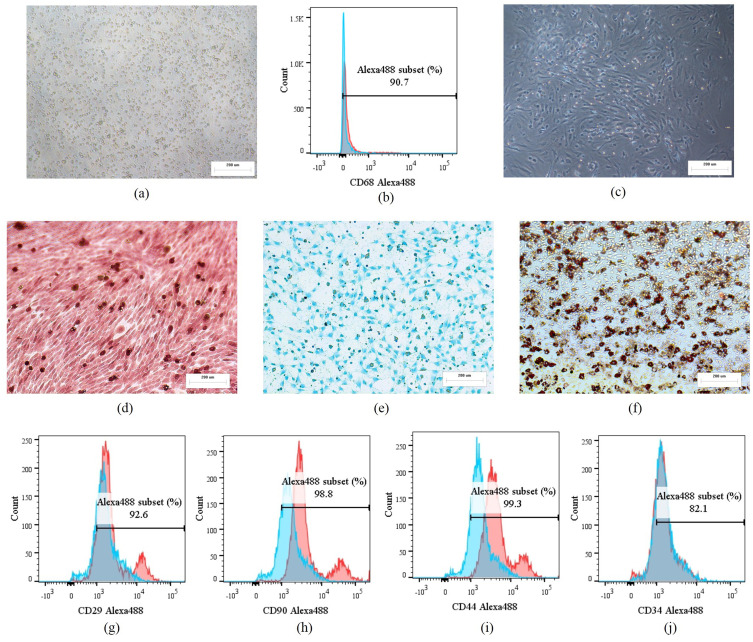
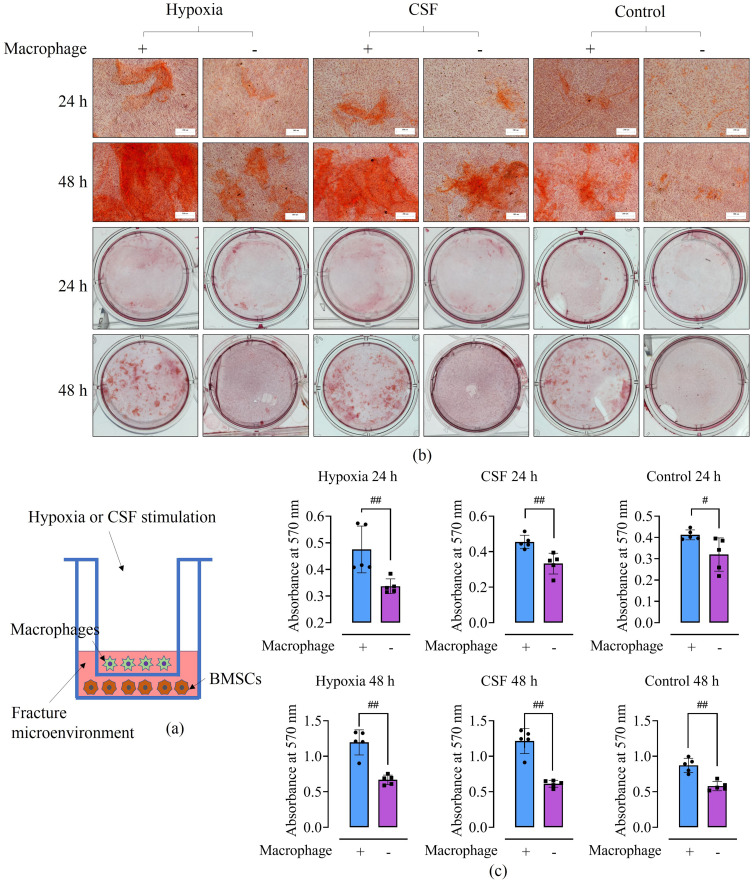
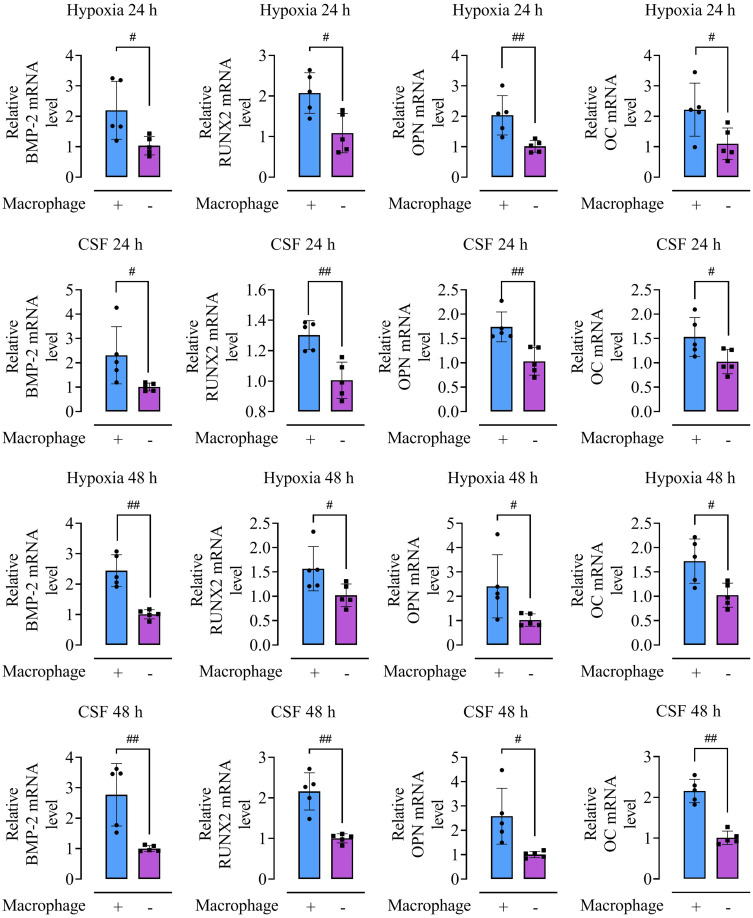
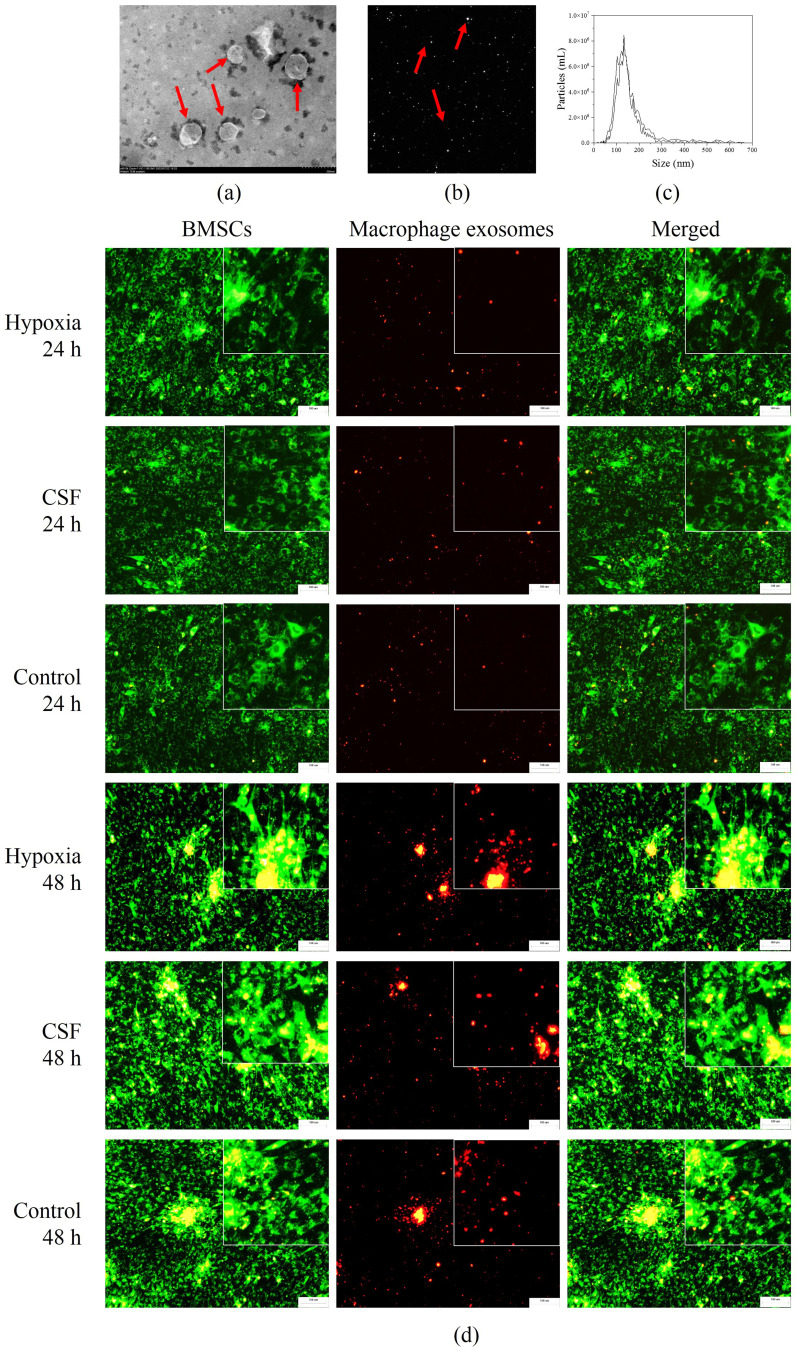
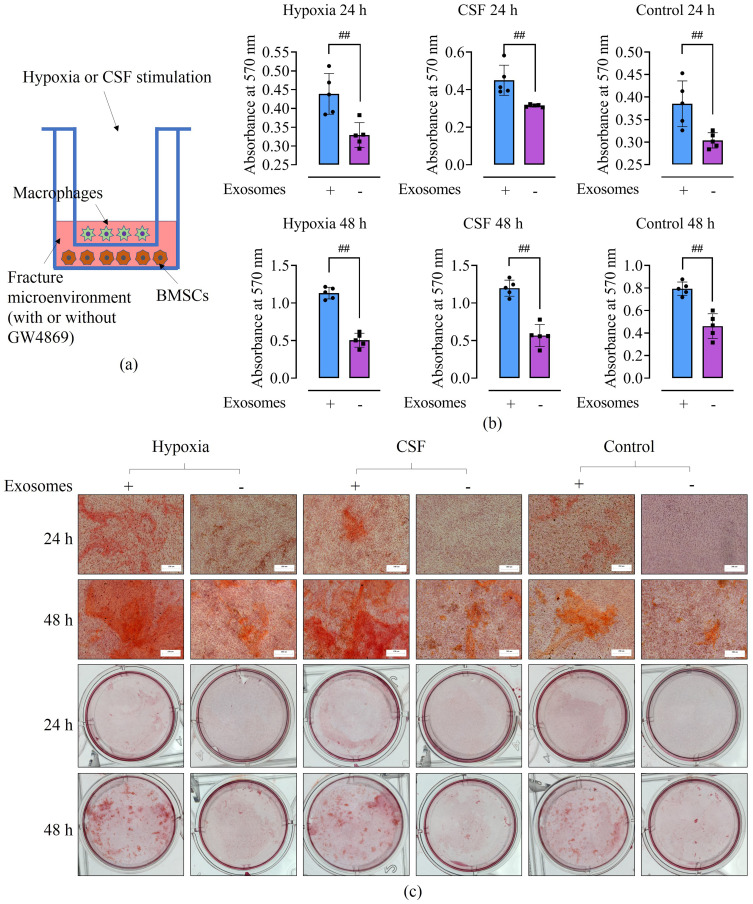
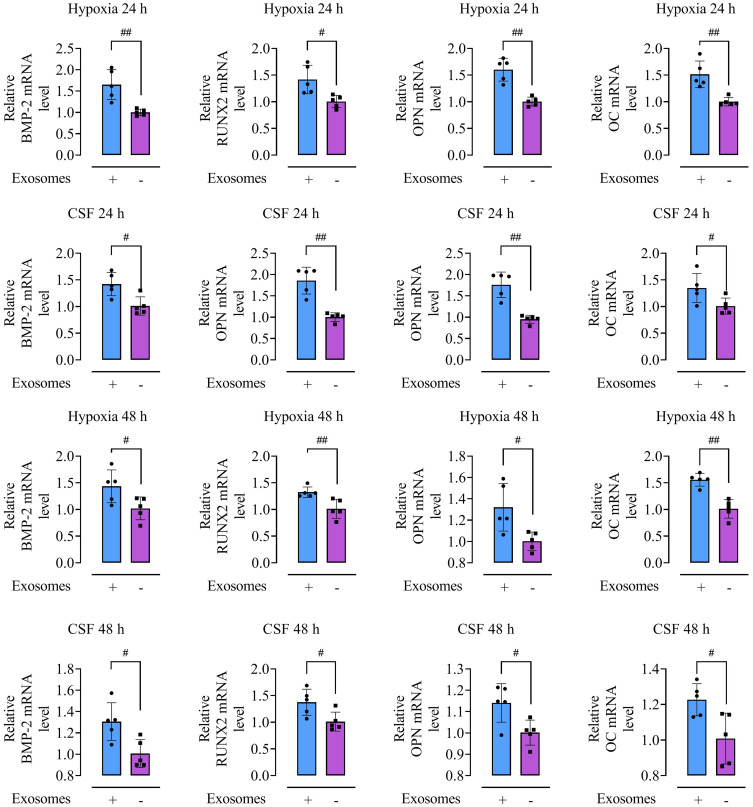
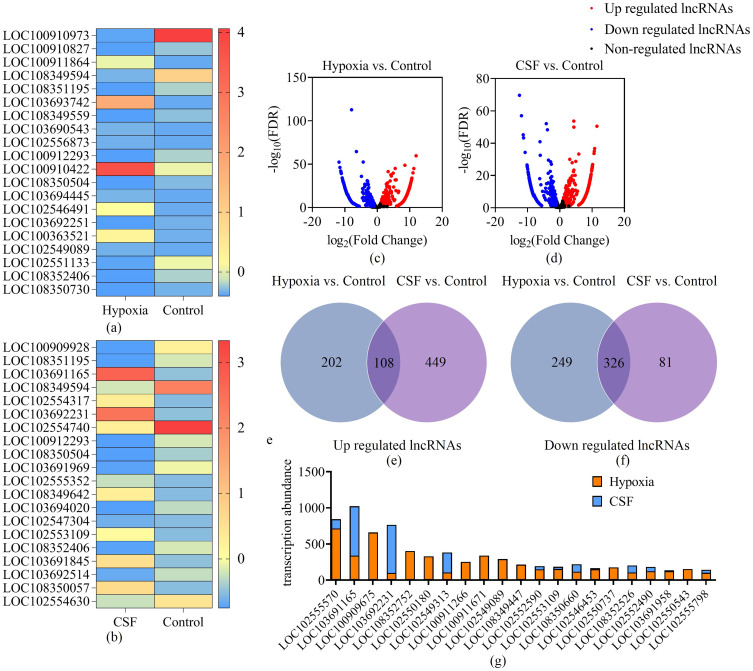
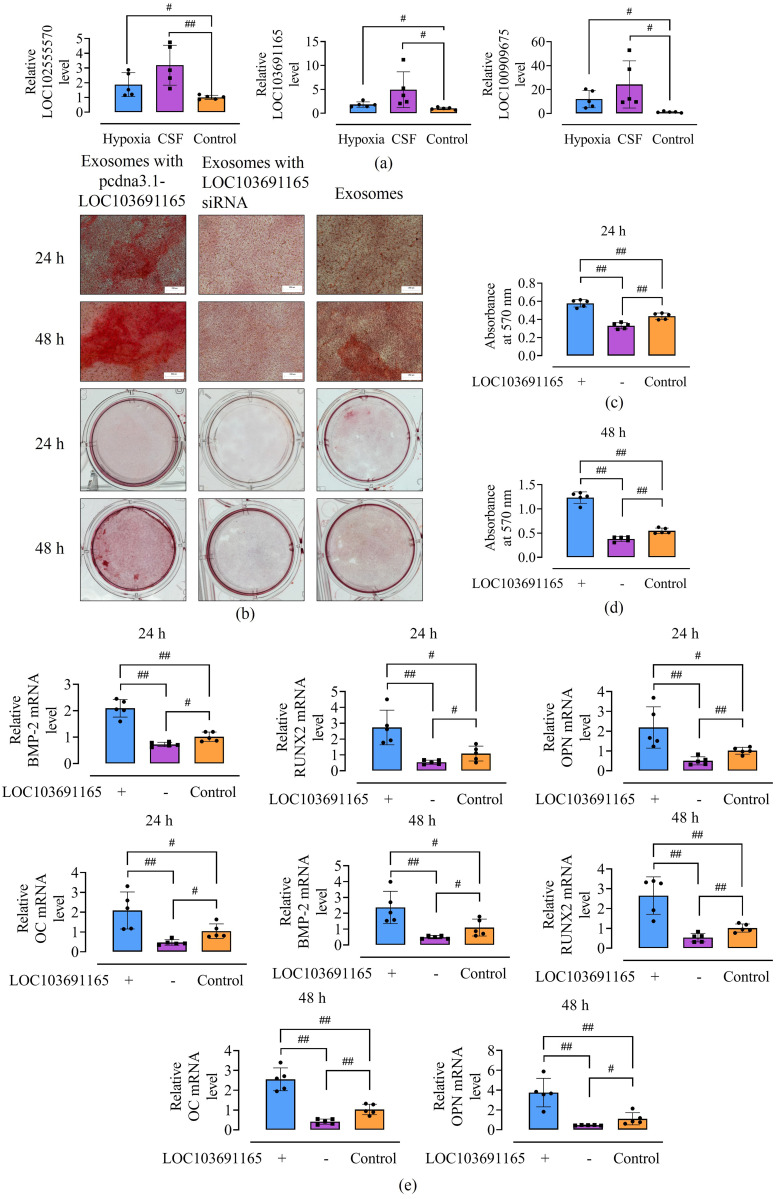
Methods: Rat BMSCs and spleen macrophages were co-cultured with serum derived from the fracture microenvironment of rat tibia. BMSC osteogenesis was evaluated using Alizarin red staining and the expression of BMP-2, RUNX2, OPN, and OC mRNA. BMSC osteogenesis was evaluated after co-culture with macrophages stimulated using hypoxic conditions or colony-stimulating factor (CSF). The uptake of macrophage-derived exosomes by BMSCs was evaluated using the exosome uptake assay. High-throughput sequencing and bioinformatics analyses were performed to identify key lncRNAs in the macrophage exosomes. The effect of lncRNA expression levels on BMSC osteogenesis was also assessed using a lncRNA overexpression plasmid and siRNA technology. M1 and M2 macrophages were distinguished using flow cytometry and the key exosomal lncRNA was detected by in situ hybridization.

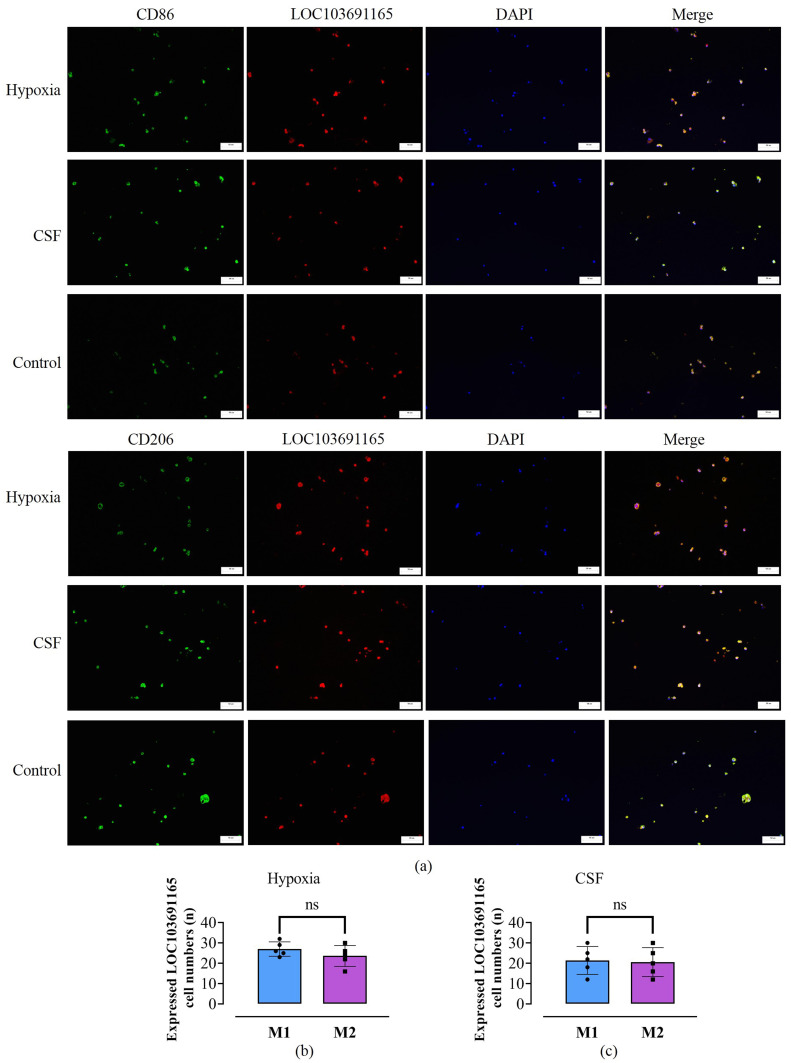
Results: In the fracture microenvironment, macrophages (stimulated using either hypoxia or CSF) significantly increased the osteogenic ability of BMSCs. We showed that BMSCs assimilated macrophage-derived vesicles and that the inhibition of exosomal secretion significantly attenuated the macrophage-mediated induction of BMSC osteogenesis. The hypoxia condition led to the up-regulation of 310 lncRNAs and the down-regulation of 575 lncRNAs in macrophage exosomes, while CSF stimulation caused the up-regulation of 557 lncRNAs and the down-regulation of 407 lncRNAs. In total, 108 lncRNAs were co-up-regulated and 326 lncRNAs were co-down-regulated under both conditions. We eventually identified LOC103691165 as a key lncRNA that promoted BMSC osteogenesis and was expressed at similar levels in both M1 and M2 macrophages.

Conclusion: In the fracture microenvironment, M1 and M2 macrophages promoted BMSC osteogenesis by secreting exosomes containing LOC103691165.

Keywords: BMSCs osteogenesis; LOC103691165; bone fracture microenvironment; lncRNAs; macrophage exosomes.


Conflict of interest statement

The authors declare no potential conflicts of interest with respect to the research, authorship, and/or publication of this article.

Figures

Figure 1
Figure 1
The characteristics of macrophages and BMSCs. (a) Primary macrophages observed under the microscope; cells were spherical and uniform in size. (b) Flow cytometry results of CD68 expression on the cell surface. The expression of CD68 on 10,000 cells was recorded. 90.7% of the cells expressed CD68. (c) The fifth generation of cultured BMSCs was observed under the microscope; the cells were long, fusiform, and translucent. (df) Alizarin red, Alcian blue, and Oil red O staining showed that the cells had osteogenic, chondrogenic, and adipogenic differentiation ability. (gj). The expression of CD29, CD90, CD44, and CD34 on 10,000 cells was recorded; red indicates cell marker expression and blue indicates the isotype control. Microscopy: 100× magnification and 200 μm scale.
Figure 2
Figure 2
The effect of macrophages on BMSC osteogenesis in the bone fracture microenvironment. (a) The experimental design; this figure was created using BioRender. (b) Images showing BMSCs stained with Alizarin red viewed under the microscope or with the naked eye. Macrophages increased the area of BMSCs stained with Alizarin red, regardless of whether they were subjected to hypoxia, CSF stimulation, or BFM alone. (c) The bar graph shows the absorbance of BMSCs stained with Alizarin red at 570 nm. ##p < 0.01, #p < 0.05. Each experiment was repeated five times. Microscopy: 100× magnification and 200 μm scale.
Figure 3
Figure 3
The effect of macrophages on the expression of osteogenesis-related genes in BMSCs. The bar graphs shows that macrophages increased BMP-2, RUNX2, OPN, and OC mRNA levels in BMSCs at 24 and 48 h after being activated using hypoxia or CSF. ##p < 0.01, #p < 0.05. Each experiment was repeated five times.
Figure 4
Figure 4
The characteristics of macrophage exosomes and their assimilation by BMSCs. (a) The morphology of exosomes was observed under the transmission electron microscope. Exosomes were spherical and uniform in size (red arrows). (b) Exosome imaging using the NTA machine. The white dots in the image are exosomes (red arrows). (c) The size of exosomes was evaluated using NTA. The curve shows that the exosomes were 100–200 nm in diameter. (d) Fluorescence images from the exosome uptake experiment. BMSCs were labeled with green fluorescence and macrophages were labeled with red fluorescence. Transwell plates were used to create a cell co-culture system. The results showed that BMSCs acquired macrophage fluorescence signals (macrophage exosomes are shown in the images). Microscopy: 100× magnification and 100 μm scale.
Figure 5
Figure 5
The effect of exosomes on BMSC osteogenesis in the bone fracture microenvironment. (a) The experimental design; this figure was created using BioRender. (b) The absorbance value of BMSCs at 570 nm after Alizarin red staining. The bar graphs show that in the cell co-culture model, inhibiting the secretion of exosomes by macrophages reduced the OD value of BMSCs after Alizarin red staining. ##p < 0.01. (c) Alizarin red staining of BMSCs, viewed under the microscope and with the naked eye. In the cell co-culture model, inhibition of exosome secretion by macrophages reduced the area of BMSCs stained with Alizarin red, irrespective of whether the macrophages were stimulated using hypoxia, CSF, or BFM alone. Each experiment was repeated five times. Microscopy: 100× magnification and 200 μm scale.
Figure 6
Figure 6
The effect of macrophage-derived exosomes on the expression of osteogenesis-related genes in BMSCs. The bar graphs show the effect of normal or inhibited macrophage exosome secretion on the levels of osteogenesis-related mRNAs in BMSCs in the cell co-culture model. Inhibition of macrophage exosomal secretion significantly down-regulated the expression of BMP-2, RUNX2, OPN, and OC in BMSCs in the cell co-culture model at 24 and 48 h; the macrophages were pre-stimulated using hypoxia or CSF. ##p < 0.01, #p < 0.05. Each experiment was repeated five times.
Figure 7
Figure 7
The differential expression of lncRNAs in macrophage exosomes. (a and b) The top 20 differentially expressed lncRNAs induced my macrophages that were stimulated using hypoxia, CSF, or BFM alone. (c and d) Volcano plots showing lncRNA expression in macrophage exosomes after hypoxia or CSF stimulation in the fracture microenvironment. Red plots represent up-regulation, blue plots represent down-regulation, and black plots represent unchanged expression. Hypoxia stimulation up-regulated 310 lncRNAs, down-regulated 575 lncRNAs, and did not affect the expression of 210 lncRNAs. CSF stimulation up-regulated 557 lncRNAs, down-regulated 407 lncRNAs, and did not affect the expression of 88 lncRNAs. (e and f) Venn diagram of exosomal lncRNAs co-regulated by hypoxia and CSF stimulation of macrophages in the fracture microenvironment. (g) The top three co-regulated lncRNAs with a transcriptional abundance ≥ 100 were LOC102555570, LOC103691165, and LOC100909675.
Figure 8
Figure 8
The effect of exosomal lncRNA LOC103691165 on BMSC osteogenesis in the bone fracture microenvironment. (a) qRT-PCR was used to examine the expression of LOC102555570, LOC103691165, and LOC100909675. The bar graph shows the increased expression of the above lncRNAs in the exosomes secreted by macrophages after being stimulated using hypoxia or CSF. ##p < 0.01, #p < 0.05. (b). Alizarin red staining of BMSCs, viewed under the microscope or with the naked eye. After receiving exosomes carrying the LOC103691165 overexpression plasmid, the Alizarin-red-stained area of BMSCs was enlarged. By contrast, the area of BMSCs stained with Alizarin red was reduced after treatment with exosomes carrying LOC103691165-targeting siRNA. (c and d) The absorbance value of BMSCs at 570 nm after Alizarin red staining. The bar graphs show the differences between each group. ##p < 0.01, #p < 0.05. (e) The effect of LOC103691165 on the expression of osteogenesis-related genes in BMSCs. The bar graphs show that the exosomes overexpressing LOC103691165 promoted the expression of BMP-2, RUNX2, OPN, and OC in BMSCs, while exosomes carrying the LOC103691165-targeting siRNA reduced the expression of the above genes in BMSCs. ##p < 0.01, #p < 0.05. Each experiment was repeated five times. Microscopy: 100× magnification and 200 μm scale.
Figure 9
Figure 9
The source of macrophage-derived exosomal lncRNA LOC103691165 in the bone fracture microenvironment. (a) Immunofluorescence image of LOC103691165 expression obtained using in situ hybridization. CD86 was used to label M1 macrophages, and CD206 was used to label M2 macrophages (green fluorescence). The LOC103691165 probe was labeled using red fluorescence. The images show that both M1 and M2 macrophages expressed LOC103691165. (b and c) The number of cells expressing LOC103691165. Five fields of view (at 200× magnification) were randomly selected to calculate the number of cells. The bar graph shows no significant difference between the numbers of M1 and M2 macrophages expressing LOC103691165. Ns, not significant (p > 0.05). Microscopy: 200× magnification and 50 μm scale. The experiment was repeated five times.

References

    1. Wildemann B, Ignatius A, Leung F, et al. Non-union bone fractures. Nat Rev Dis Primers. 2021;7(1):57. doi:10.1038/s41572-021-00289-8 - DOI - PubMed
    1. Toosi S, Behravan N, Behravan J. Nonunion fractures, mesenchymal stem cells and bone tissue engineering. J Biomed Mater Res A. 2018;106(9):2552–2562. doi:10.1002/jbm.a.36433 - DOI - PubMed
    1. Nicholson JA, Makaram N, Simpson A, Keating JF. Fracture nonunion in long bones: a literature review of risk factors and surgical management. Injury. 2021;52(Suppl 2):S3–S11. doi:10.1016/j.injury.2020.11.029 - DOI - PubMed
    1. Ho-Shui-Ling A, Bolander J, Rustom LE, et al. Bone regeneration strategies: engineered scaffolds, bioactive molecules and stem cells current stage and future perspectives. Biomaterials. 2018;180:143–162. doi:10.1016/j.biomaterials.2018.07.017 - DOI - PMC - PubMed
    1. Nauth A, Lee M, Gardner MJ, et al. Principles of nonunion management: state of the art. J Orthop Trauma. 2018;32(Suppl 1):S52–S57. doi:10.1097/BOT.0000000000001122 - DOI - PubMed

Substances