. 2023 Apr 25;14(2):e0355722.
doi: 10.1128/mbio.03557-22. Epub 2023 Mar 7.

Improved Bacterial Single-Cell RNA-Seq through Automated MATQ-Seq and Cas9-Based Removal of rRNA Reads

Affiliations

Improved Bacterial Single-Cell RNA-Seq through Automated MATQ-Seq and Cas9-Based Removal of rRNA Reads

Christina Homberger et al. mBio. .

Abstract

Bulk RNA sequencing technologies have provided invaluable insights into host and bacterial gene expression and associated regulatory networks. Nevertheless, the majority of these approaches report average expression across cell populations, hiding the true underlying expression patterns that are often heterogeneous in nature. Due to technical advances, single-cell transcriptomics in bacteria has recently become reality, allowing exploration of these heterogeneous populations, which are often the result of environmental changes and stressors. In this work, we have improved our previously published bacterial single-cell RNA sequencing (scRNA-seq) protocol that is based on multiple annealing and deoxycytidine (dC) tailing-based quantitative scRNA-seq (MATQ-seq), achieving a higher throughput through the integration of automation. We also selected a more efficient reverse transcriptase, which led to reduced cell loss and higher workflow robustness. Moreover, we successfully implemented a Cas9-based rRNA depletion protocol into the MATQ-seq workflow. Applying our improved protocol on a large set of single Salmonella cells sampled over different growth conditions revealed improved gene coverage and a higher gene detection limit compared to our original protocol and allowed us to detect the expression of small regulatory RNAs, such as GcvB or CsrB at a single-cell level. In addition, we confirmed previously described phenotypic heterogeneity in Salmonella in regard to expression of pathogenicity-associated genes. Overall, the low percentage of cell loss and high gene detection limit makes the improved MATQ-seq protocol particularly well suited for studies with limited input material, such as analysis of small bacterial populations in host niches or intracellular bacteria. IMPORTANCE Gene expression heterogeneity among isogenic bacteria is linked to clinically relevant scenarios, like biofilm formation and antibiotic tolerance. The recent development of bacterial single-cell RNA sequencing (scRNA-seq) enables the study of cell-to-cell variability in bacterial populations and the mechanisms underlying these phenomena. Here, we report a scRNA-seq workflow based on MATQ-seq with increased robustness, reduced cell loss, and improved transcript capture rate and gene coverage. Use of a more efficient reverse transcriptase and the integration of an rRNA depletion step, which can be adapted to other bacterial single-cell workflows, was instrumental for these improvements. Applying the protocol to the foodborne pathogen Salmonella, we confirmed transcriptional heterogeneity across and within different growth phases and demonstrated that our workflow captures small regulatory RNAs at a single-cell level. Due to low cell loss and high transcript capture rates, this protocol is uniquely suited for experimental settings in which the starting material is limited, such as infected tissues.

Keywords: Cas9; DASH; MATQ-seq; Salmonella enterica; gene expression heterogeneity; rRNA depletion; single-cell RNA-seq.


Conflict of interest statement

The authors declare no conflict of interest.

Figures
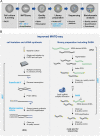
FIG 1
FIG 1
Improved MATQ-seq workflow for bacterial single-cell RNA-seq. (A) Overview of bacterial scRNA-seq pipeline including major steps from cell culture to bioinformatic analysis. Changes from the previous MATQ-seq protocol are highlighted in blue. (B) Detailed workflow of the MATQ-seq protocol separated into two main steps: cell isolation and cDNA synthesis (left) and library preparation including DASH for rRNA depletion (right). Major improvements are highlighted in blue, including the use of SuperScript IV (SS IV) for reverse transcription, reaction optimization, and integration of DASH into the library preparation. All pipetting steps were automated using the I.DOT dispensing robot, with the exception of all cleanup and quality control steps.
FIG 2
FIG 2
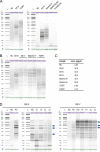
Selection of alternative reverse transcriptase. Shown are Bioanalyzer profiles of cDNA processed by MATQ-seq using different reverse transcriptases. (A) Comparison of five different reverse transcriptases with SS III. Sample input was 50 ng of total RNA for all conditions. (B) Further validation of the three RTs SS IV, Maxima H Minus (Maxima H-), and TGIRT after initial selection and subsequent buffer optimization compared to panel A. All assays were performed with a spike-in of 50 pg of total RNA. (C) cDNA concentrations of samples in panel B measured with a Qubit fluorometer. (D) Comparison of cDNA profiles obtained with SS III (left) and SS IV (right). Each profile represents the cDNA prepared from either a single cell (sc) or 10-sorted or 100-sorted cells. Sorted cell conditions served as a control to evaluate cDNA integrity obtained from a single cell. The positive control was performed with a spike-in of 50 pg of total RNA. Characteristic bands are indicated with blue arrows. L, ladder; NC, negative control; PC, positive control.
FIG 3
FIG 3
Experimental design and RNA class distribution. (A) Growth curve of Salmonella in LB medium, with colored arrows indicating the four sampling points for scRNA-seq experiments. Data are displayed as means ± standard deviation (SD) of three independent experiments. (B) Representation of RNA class distribution comparing both protocols under different growth conditions. See Table S1A for detailed information on the prevalence of each RNA class. EEP, early exponential phase; MEP, mid-exponential phase; LEP, late exponential phase; ESP, early stationary phase; LSP, late-stationary phase.
FIG 4
FIG 4
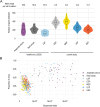
Gene detection limit and robustness of improved MATQ-seq workflow. (A) Overlaid violin and boxplots showing the median, quartiles, and distribution for the numbers of detected genes per condition. Mean numbers of reads per single cell are indicated at the top. (B) Proportion of genes with no assigned reads (zeros) per single cell compared to the number of sequenced reads, with each color-coded dot representing a single cell.
FIG 5
FIG 5
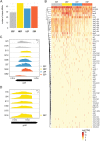
Small regulatory RNA regulation at a single-cell level. (A) Representation of unique sRNAs identified under each growth condition. (B) Heat map showing prevalence and distribution of the most abundant sRNAs under different growth conditions. (C) Coverage plot and read densities of sRNA CsrB in eight selected single cells (indicated by sample number). (D) Coverage plot and read densities of sRNA GcvB in MEP in six selected single cells (indicated by sample number).
FIG 6
FIG 6
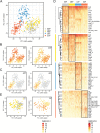
Cluster identification and analysis of highly variable genes detected at a single-cell level. (A) Principal component analysis (PCA) of all analyzed cells across the four growth conditions. (B) Overlay of the expression of genes contributing to the separation of the three main clusters in panel A. (C) Expression of Salmonella pathogenicity genes sipB and sipC within ESP. (D) Heat map of the gene expression level of the top 1% of highly variable genes detected for each growth condition. (E) (Left) PCA analysis of cells from EEP and MEP. (Right) Overlay of expression of the flagellar gene fliC on the PCA blot shown on the left.

References

    1. Westermann AJ, Vogel J. 2021. Cross-species RNA-seq for deciphering host-microbe interactions. Nat Rev Genet 22:361–378. doi:10.1038/s41576-021-00326-y. - DOI - PubMed
    1. Ackermann M. 2015. A functional perspective on phenotypic heterogeneity in microorganisms. Nat Rev Microbiol 13:497–508. doi:10.1038/nrmicro3491. - DOI - PubMed
    1. Grimbergen AJ, Siebring J, Solopova A, Kuipers OP. 2015. Microbial bet-hedging: the power of being different. Curr Opin Microbiol 25:67–72. doi:10.1016/j.mib.2015.04.008. - DOI - PubMed
    1. Morawska LP, Hernandez-Valdes JA, Kuipers OP. 2022. Diversity of bet-hedging strategies in microbial communities—recent cases and insights. WIREs Mech Dis 14:e1544. doi:10.1002/wsbm.1544. - DOI - PMC - PubMed
    1. Rumbaugh KP, Sauer K. 2020. Biofilm dispersion. Nat Rev Microbiol 18:571–586. doi:10.1038/s41579-020-0385-0. - DOI - PMC - PubMed

Publication types

MeSH terms