. 2023 Apr;64(4):202-233.
doi: 10.1002/em.22534. Epub 2023 Mar 7.

Evaluation of the herbicide glyphosate, (aminomethyl)phosphonic acid, and glyphosate-based formulations for genotoxic activity using in vitro assays

Affiliations

Evaluation of the herbicide glyphosate, (aminomethyl)phosphonic acid, and glyphosate-based formulations for genotoxic activity using in vitro assays

Stephanie L Smith-Roe et al. Environ Mol Mutagen. 2023 Apr.

Abstract

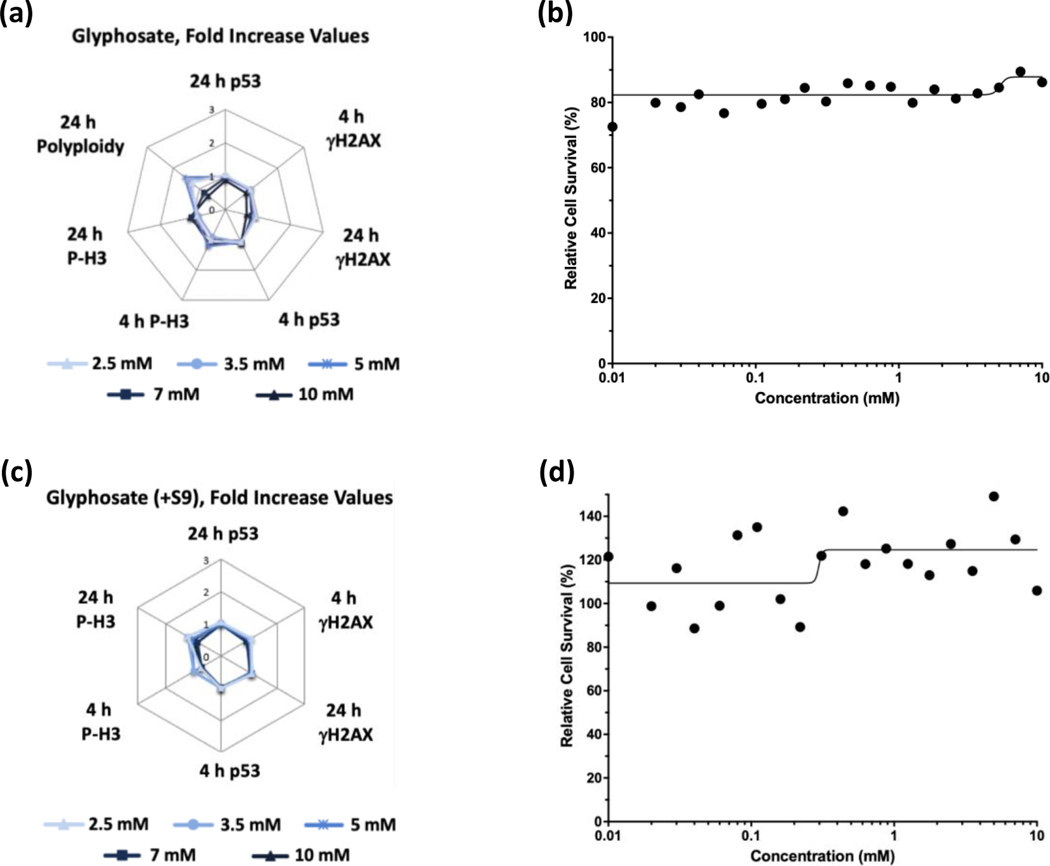
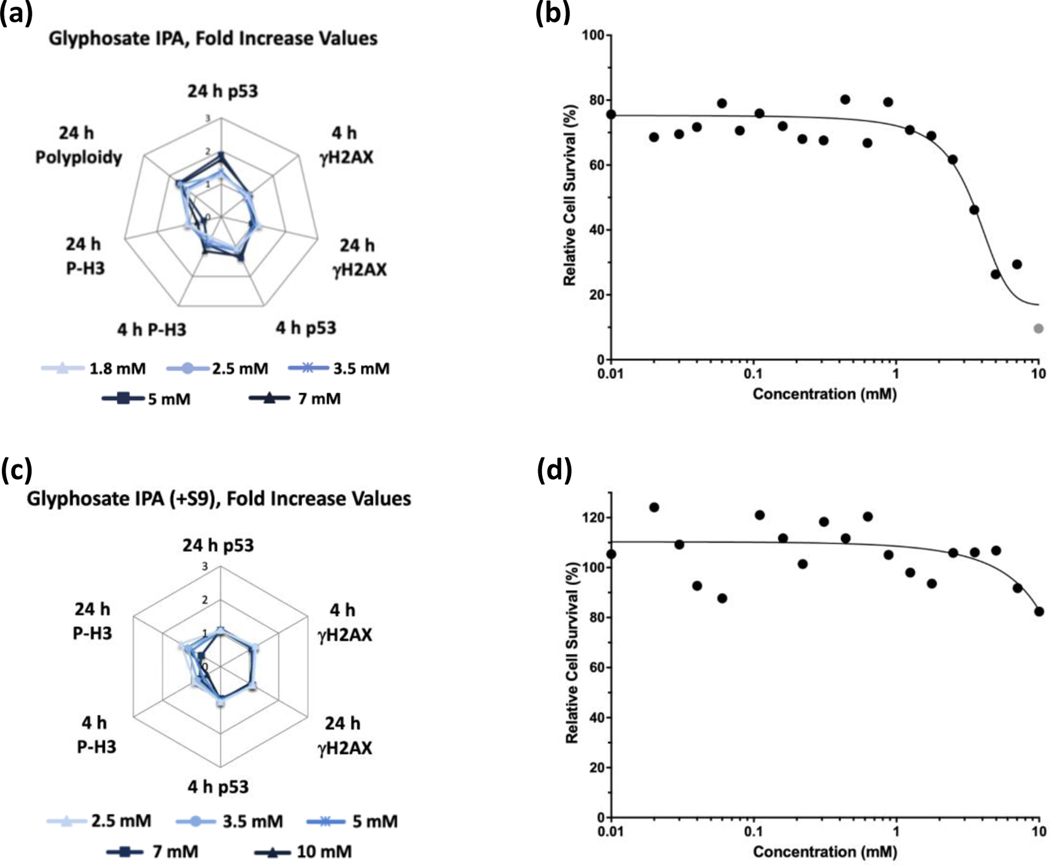
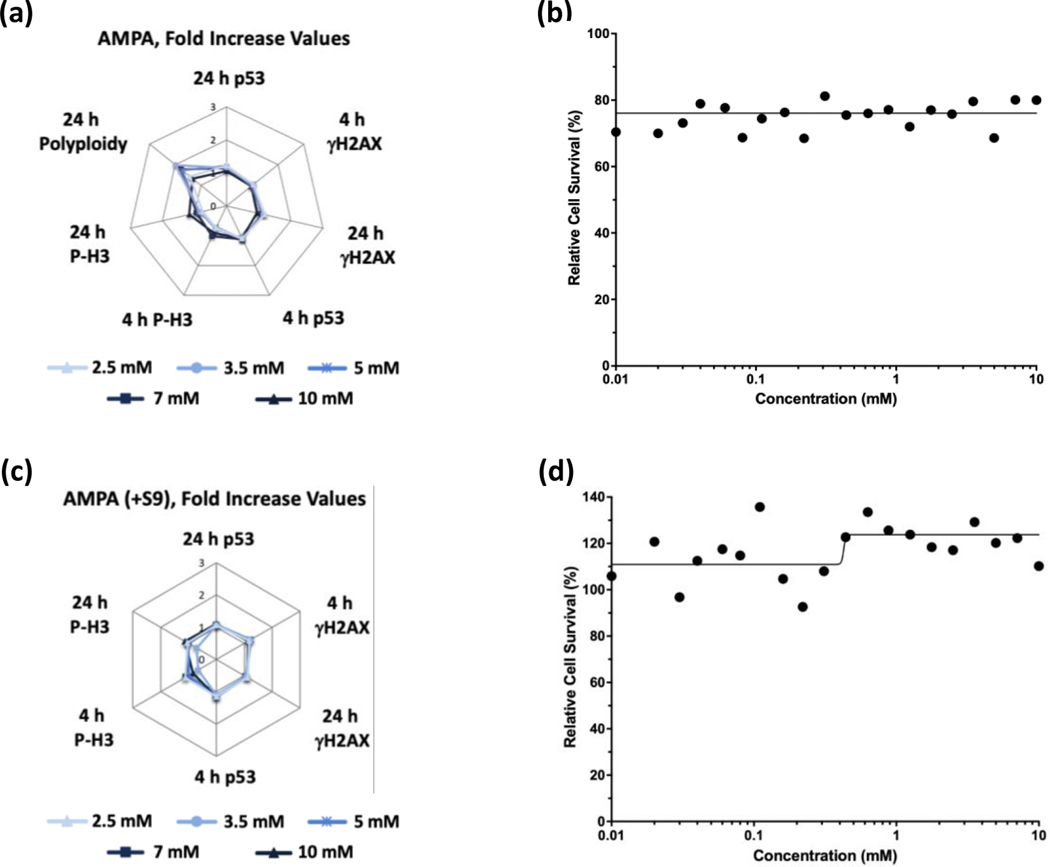
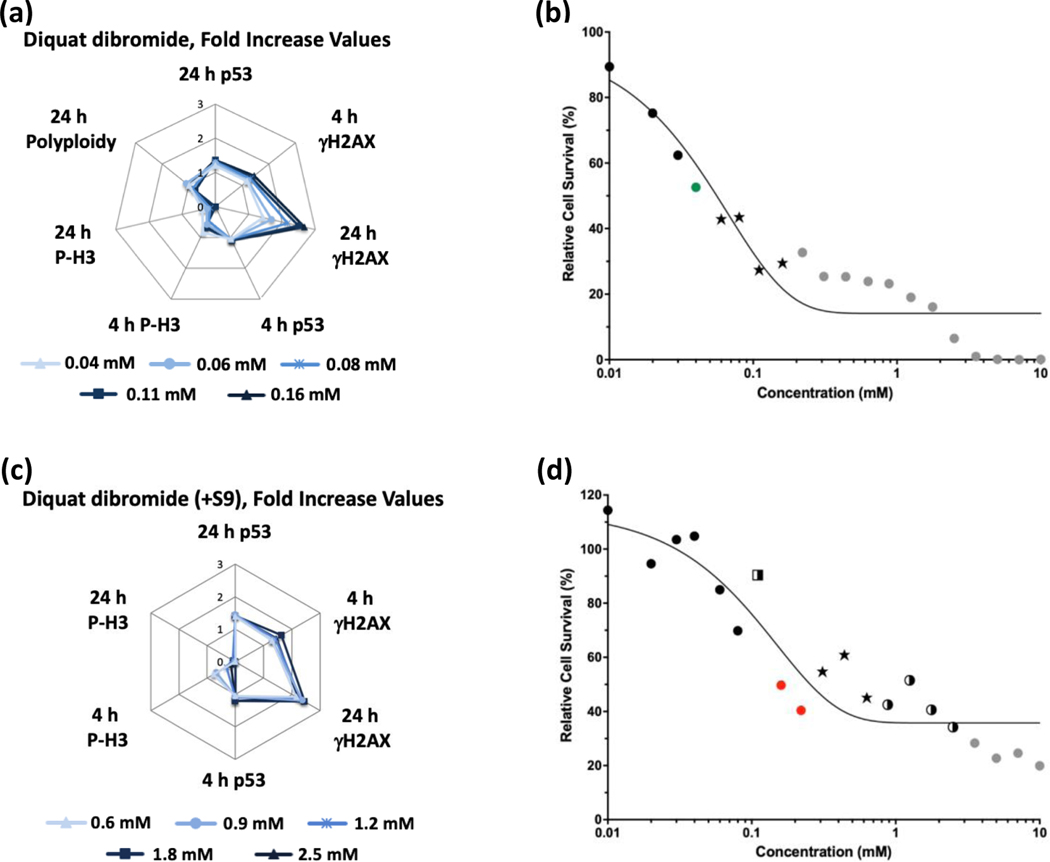
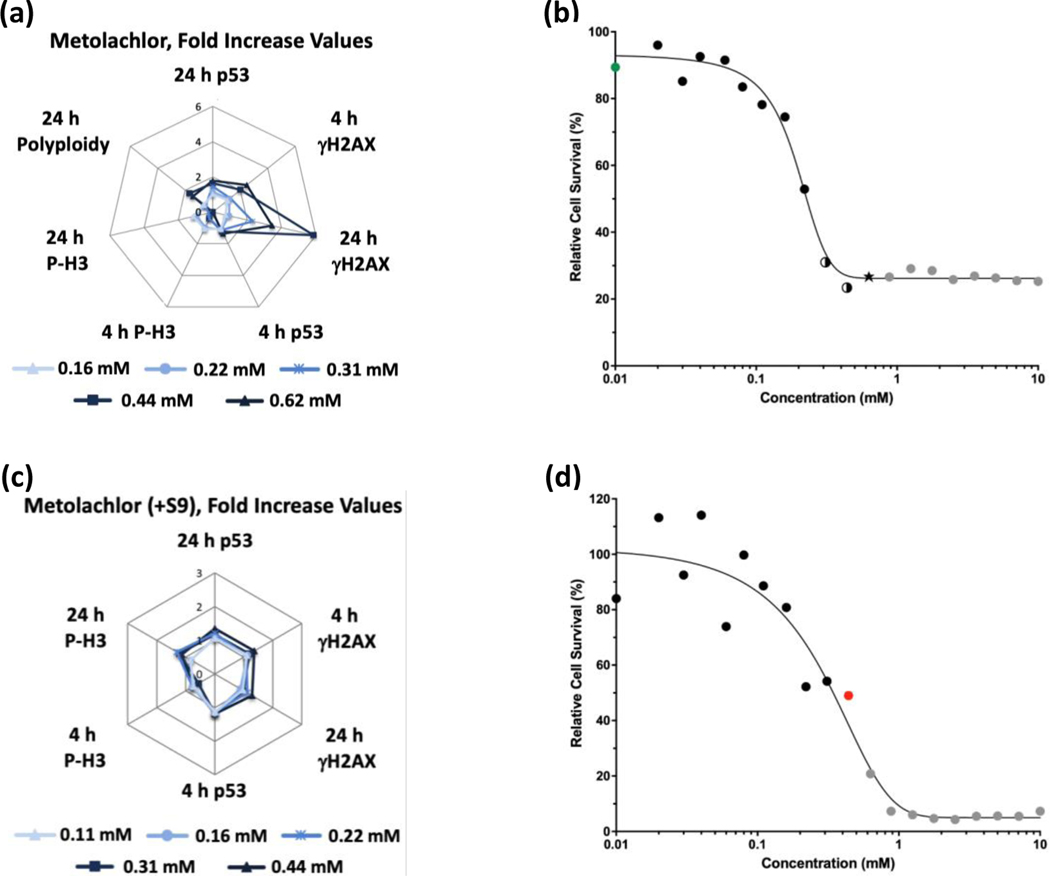
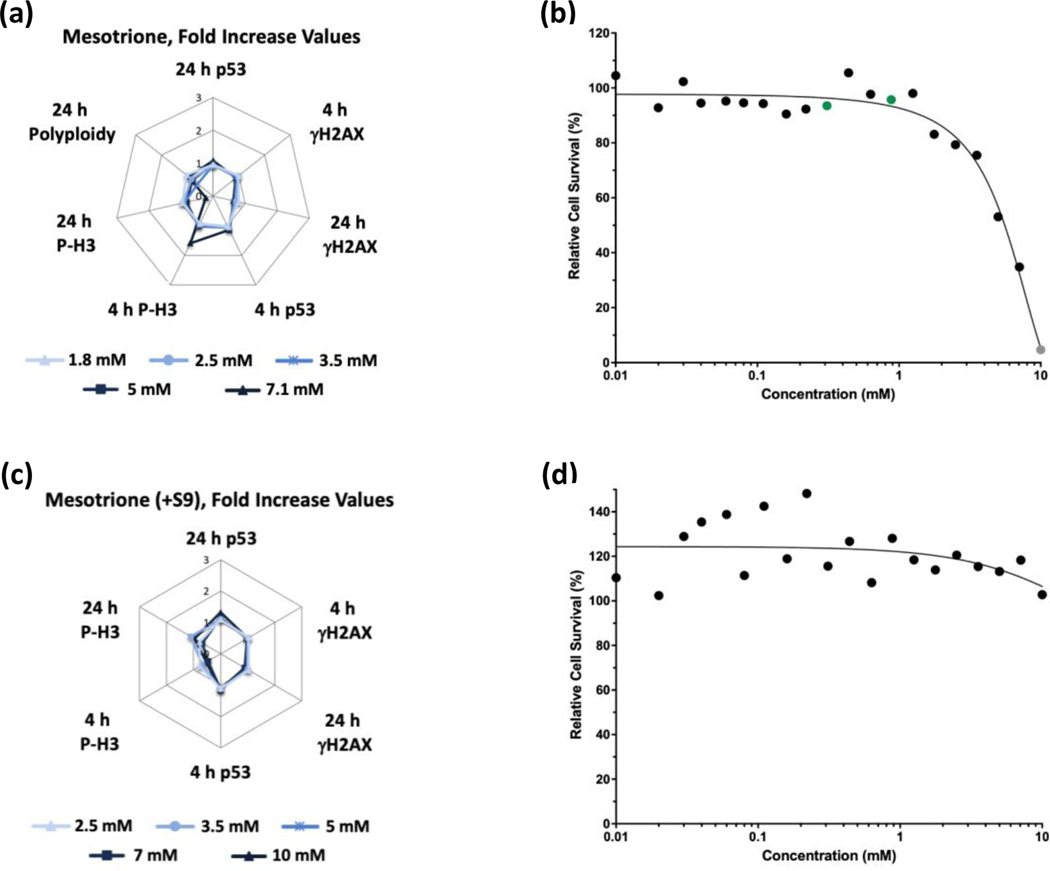
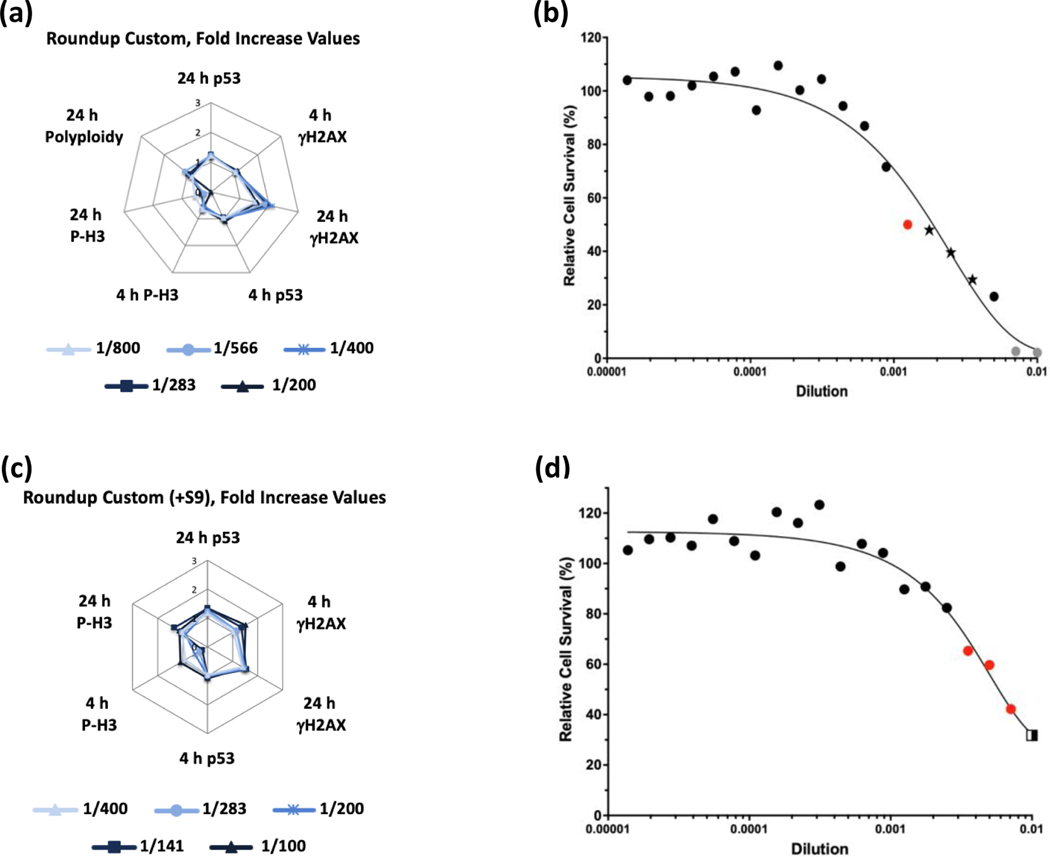
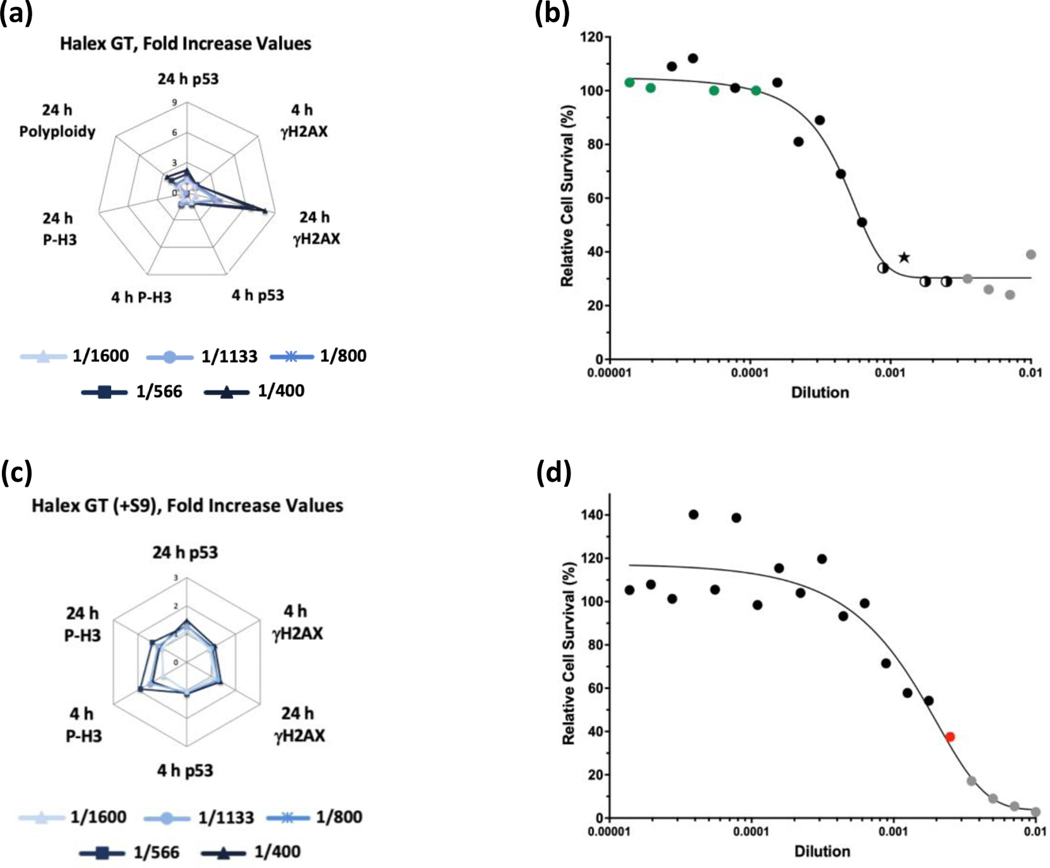
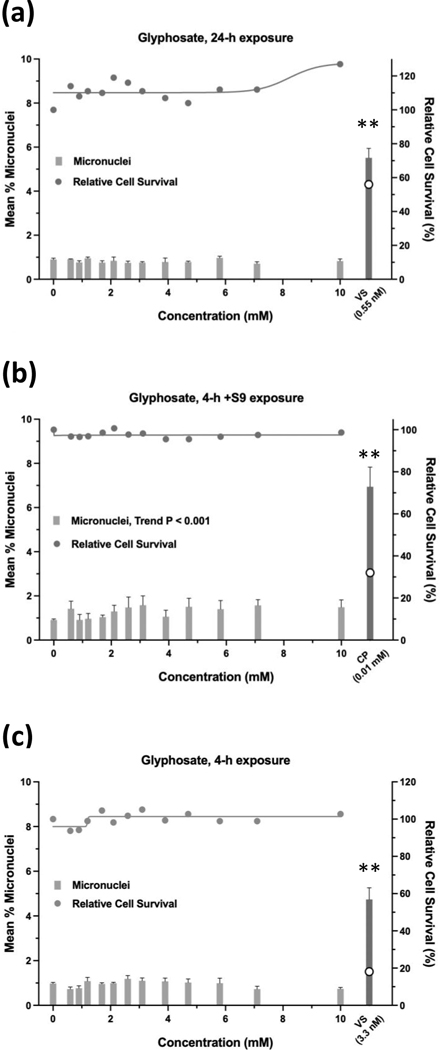
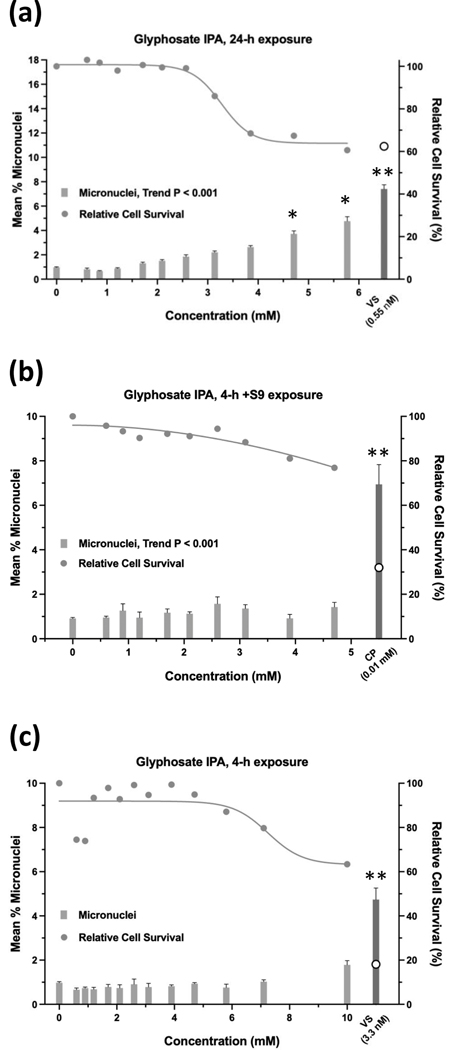
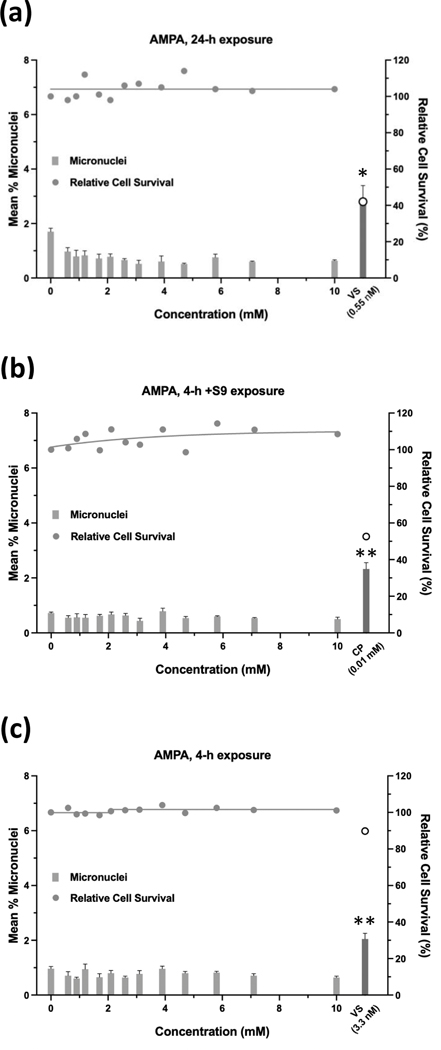
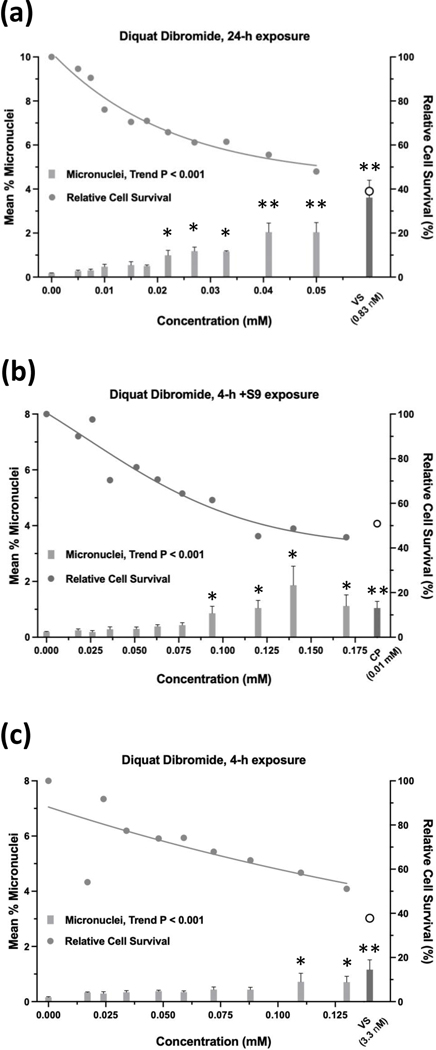
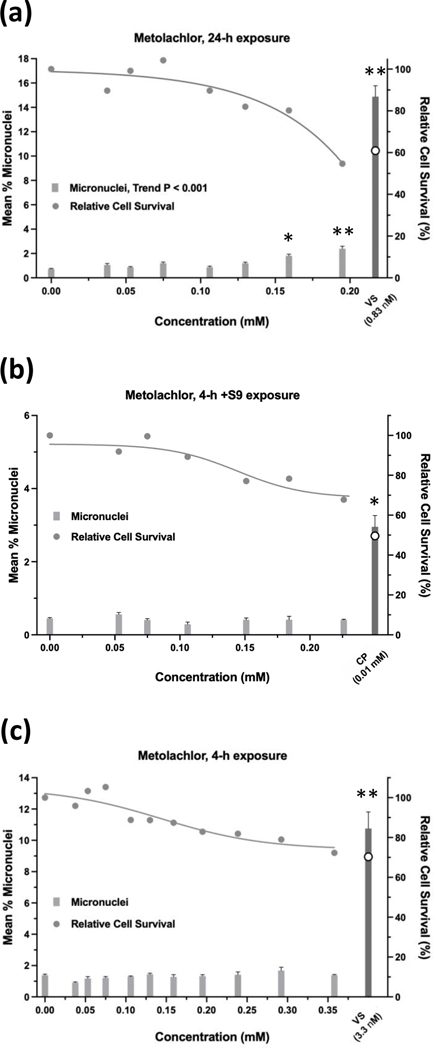
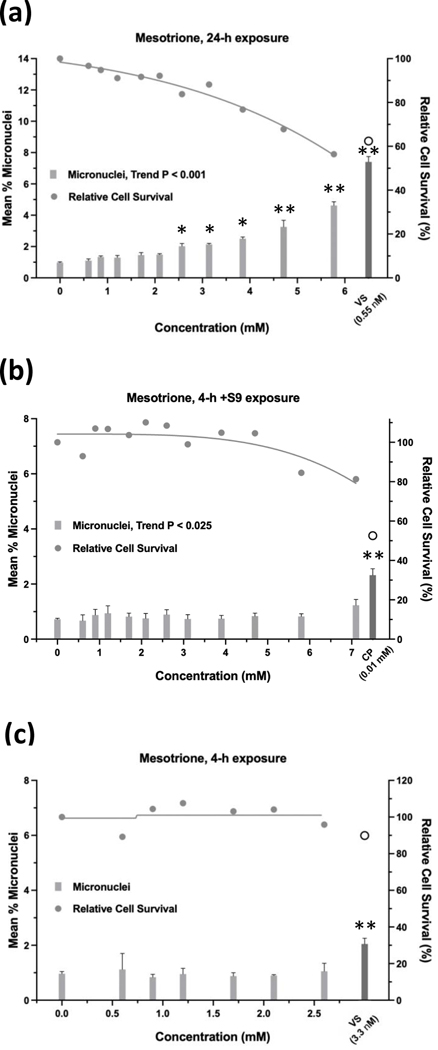
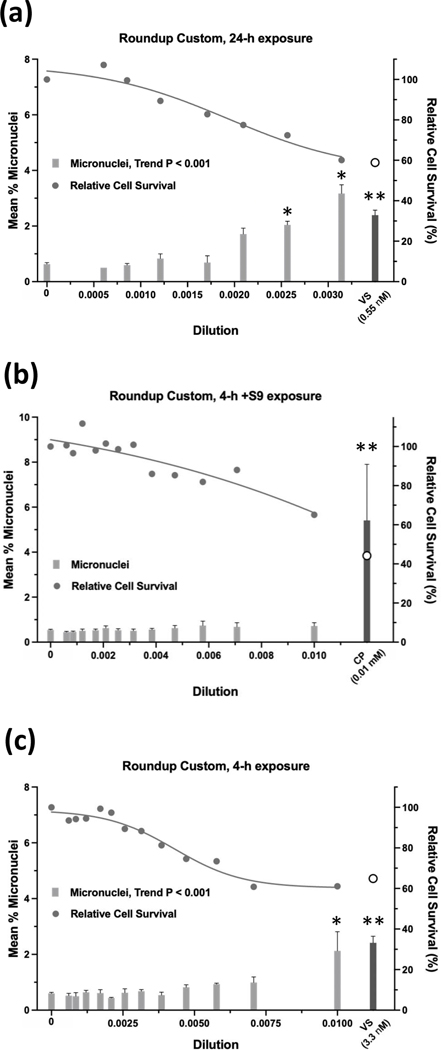
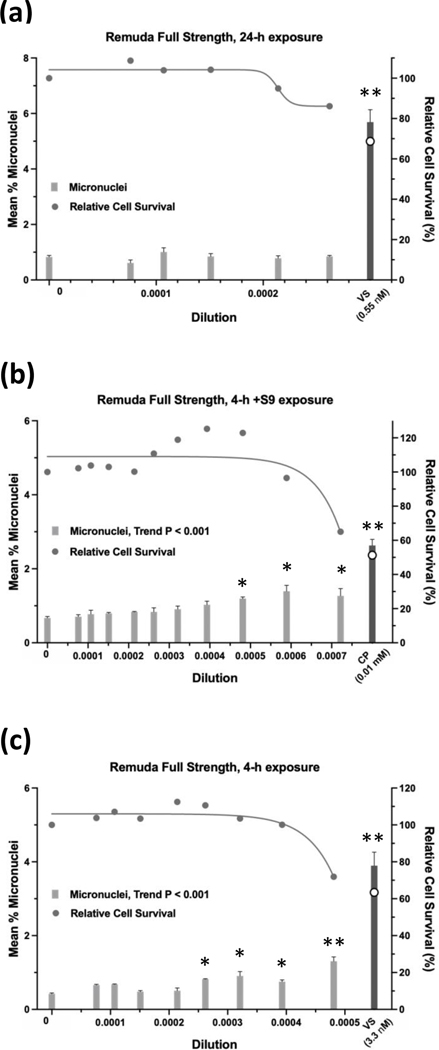
Glyphosate, the most heavily used herbicide world-wide, is applied to plants in complex formulations that promote absorption. The National Toxicology Program reported in 1992 that glyphosate, administered to rats and mice at doses up to 50,000 ppm in feed for 13 weeks, showed little evidence of toxicity, and no induction of micronuclei was observed in the mice in this study. Subsequently, mechanistic studies of glyphosate and glyphosate-based formulations (GBFs) that have focused on DNA damage and oxidative stress suggest that glyphosate may have genotoxic potential. However, few of these studies directly compared glyphosate to GBFs, or effects among GBFs. To address these data gaps, we tested glyphosate, glyphosate isopropylamine (IPA), and (aminomethyl)phosphonic acid (AMPA, a microbial metabolite of glyphosate), 9 high-use agricultural GBFs, 4 residential-use GBFs, and additional herbicides (metolachlor, mesotrione, and diquat dibromide) present in some of the GBFs in bacterial mutagenicity tests, and in human TK6 cells using a micronucleus assay and a multiplexed DNA damage assay. Our results showed no genotoxicity or notable cytotoxicity for glyphosate or AMPA at concentrations up to 10 mM, while all GBFs and herbicides other than glyphosate were cytotoxic, and some showed genotoxic activity. An in vitro to in vivo extrapolation of results for glyphosate suggests that it is of low toxicological concern for humans. In conclusion, these results demonstrate a lack of genotoxicity for glyphosate, consistent with observations in the NTP in vivo study, and suggest that toxicity associated with GBFs may be related to other components of these formulations.

Keywords: bacterial mutagenicity assay; diquat dibromide; mesotrione; metolachlor; micronucleus.


Conflict of interest statement

DECLARATION OF CONFLICTS OF INTEREST

The authors declare that they have nothing to disclose.

Figures

FIGURE 1.
FIGURE 1.
MultiFlow DNA Damage assay results for glyphosate in the absence (a, b) or presence of S9 (c, d) are shown in radar charts, accompanied by relative cell survival curves. Each radar chart shows the fold increase over the vehicle control for each biomarker and time point for the five highest consecutive concentrations before meeting cytotoxicity exclusion criteria.
FIGURE 2.
FIGURE 2.
MultiFlow DNA Damage assay results for glyphosate IPA in the absence (a, b) or presence of S9 (c, d) are shown in radar charts, accompanied by relative cell survival curves. Each radar chart shows the fold increase over the vehicle control for each biomarker and time point for the five highest consecutive concentrations before meeting cytotoxicity exclusion criteria. Gray circle = concentration that was excluded from analysis due to cytotoxicity (b).
FIGURE 3.
FIGURE 3.
MultiFlow DNA Damage assay results for AMPA in the absence (a, b) or presence of S9 (c, d) are shown in radar charts, accompanied by relative cell survival curves. Each radar chart shows the fold increase over the vehicle control for each biomarker and time point for the five highest consecutive concentrations before meeting cytotoxicity exclusion criteria.
FIGURE 4.
FIGURE 4.
MultiFlow DNA Damage assay results for diquat dibromide in the absence (a, b) or presence of S9 (c, d) are shown in radar charts, accompanied by relative cell survival curves. Each radar chart shows the fold increase over the vehicle control for each biomarker and time point for the five highest consecutive concentrations before meeting cytotoxicity exclusion criteria. Concentrations flagged for genotoxic characteristics: green circles = random forest algorithm, stars = random forest, neural network, and logistic regression algorithms; gray circles = concentrations that were excluded from analysis due to cytotoxicity (b). Concentrations flagged for genotoxic activity: red circles = neural network algorithm, two-tone squares = random forest and neural network algorithms, two-tone circles = neural network and logistic regression algorithms, stars = random forest, neural network, and logistic regression algorithms; gray circles = concentrations that were excluded from analysis due to cytotoxicity (d).
FIGURE 5.
FIGURE 5.
MultiFlow DNA Damage assay results for metolachlor in the absence (a, b) or presence of S9 (c, d) are shown in radar charts, accompanied by relative cell survival curves. Each radar chart shows the fold increase over the vehicle control for each biomarker and time point for the five highest consecutive concentrations before meeting cytotoxicity exclusion criteria. Concentrations flagged for genotoxic activity: green circles = random forest algorithm, stars = random forest, neural network, and logistic regression algorithms, two-tone circles = neural network and logistic regression algorithms; gray circles indicate concentrations that were excluded from analysis due to cytotoxicity (b). Concentrations flagged for genotoxic activity: red circle = neural network algorithm; gray circles = concentrations that were excluded from analysis due to cytotoxicity (d).
FIGURE 6.
FIGURE 6.
MultiFlow DNA Damage assay results for mesotrione in the absence (a, b) or presence of S9 (c, d) are shown in radar charts, accompanied by relative cell survival curves. Each radar chart shows the fold increase over the vehicle control for each biomarker and time point for the five highest consecutive concentrations before meeting cytotoxicity exclusion criteria. Concentrations flagged for genotoxic activity: green circles = random forest algorithm; gray circle = concentrations that were excluded from analysis due to cytotoxicity (b).
FIGURE 7.
FIGURE 7.
MultiFlow DNA Damage assay results for Roundup Custom in the absence (a, b) or presence of S9 (c, d) are shown in radar charts, accompanied by relative cell survival curves. Each radar chart shows the fold increase over the vehicle control for each biomarker and time point for the five highest consecutive concentrations before meeting cytotoxicity exclusion criteria. Concentrations flagged for genotoxic activity: red circle = neural network algorithm, stars = random forest, neural network, and logistic regression algorithms; gray circles = concentrations that were excluded from analysis due to cytotoxicity (b). Concentrations flagged for genotoxic activity: red circles = neural network algorithm, two-tone square = random forest and neural network algorithms (d).
FIGURE 8.
FIGURE 8.
MultiFlow DNA Damage assay results for Halex GT in the absence (a, b) or presence of S9 (c, d) are shown in radar charts, accompanied by relative cell survival curves. Each radar chart shows the fold increase over the vehicle control for each biomarker and time point for the five highest consecutive concentrations before meeting cytotoxicity exclusion criteria. Concentrations flagged for genotoxic activity: green circles = random forest algorithm, two-tone circles = neural network and logistic regression algorithms, star = random forest, neural network, and logistic regression algorithms; gray circles = concentrations that were excluded from analysis due to cytotoxicity (b). Concentrations flagged for genotoxic activity: red circle = neural network algorithm; gray circles = concentrations that were excluded from analysis due to cytotoxicity (d).
FIGURE 9.
FIGURE 9.
Micronucleus assay results for glyphosate after 24 h of exposure (a), 4 h of exposure +S9 (b), or 4 h of exposure without S9 (c). VS = vinblastine sulfate, CP = cyclophosphamide; open circle indicates % relative cell survival for positive controls. Error bars indicate standard error of the mean. **P < 0.001.
FIGURE 10.
FIGURE 10.
Micronucleus assay results for glyphosate IPA after 24 h of exposure (a), 4 h of exposure +S9 (b), or 4 h of exposure without S9; an outlier for %MN was omitted from the 0.6 mM concentration, statistical results were the same ± the outlier (c). VS = vinblastine sulfate, CP = cyclophosphamide; open circle indicates % relative cell survival for positive controls. Error bars indicate standard error of the mean. *P < 0.025, **P < 0.001.
FIGURE 11.
FIGURE 11.
Micronucleus assay results for AMPA after 24 h of exposure (a), 4 h of exposure +S9 (b), or 4 h of exposure without S9 (c). VS = vinblastine sulfate, CP = cyclophosphamide; open circle indicates % relative cell survival for positive controls. Error bars indicate standard error of the mean. *P < 0.025, **P < 0.001.
FIGURE 12.
FIGURE 12.
Micronucleus assay results for diquat dibromide after 24 h of exposure (a), 4 h of exposure +S9 (b), or 4 h of exposure without S9 (c). VS = vinblastine sulfate, CP = cyclophosphamide; open circle indicates % relative cell survival for positive controls. Error bars indicate standard error of the mean. *P < 0.025, **P < 0.001.
FIGURE 13.
FIGURE 13.
Micronucleus assay results for metolachlor after 24 h of exposure (a), 4 h of exposure +S9 (b), or 4 h of exposure without S9 (c). VS = vinblastine sulfate, CP = cyclophosphamide; open circle indicates % relative cell survival for positive controls. Error bars indicate standard error of the mean. *P < 0.025, **P < 0.001.
FIGURE 14.
FIGURE 14.
Micronucleus assay results for mesotrione after 24 h of exposure (a), 4 h of exposure +S9 (b), or 4 h of exposure without S9 (c). VS = vinblastine sulfate, CP = cyclophosphamide; open circle indicates % relative cell survival for positive controls. Error bars indicate standard error of the mean. *P < 0.025, **P < 0.001.
FIGURE 15.
FIGURE 15.
Micronucleus assay results for Roundup Custom after 24 h of exposure (a), 4 h of exposure +S9 (b), or 4 h of exposure without S9 (c). VS = vinblastine sulfate, CP = cyclophosphamide; open circle indicates % relative cell survival for positive controls. Error bars indicate standard error of the mean. *P < 0.025, **P < 0.001.
FIGURE 16.
FIGURE 16.
Micronucleus assay results for Remuda Full Strength after 24 h of exposure (a), 4 h of exposure +S9 (b), or 4 h of exposure without S9 (c). VS = vinblastine sulfate, CP = cyclophosphamide; open circle indicates % relative cell survival for positive controls. Error bars indicate standard error of the mean. *P < 0.025, **P < 0.001.

References

    1. Anadón A, Martínez-Larrañaga MR, Martínez MA, Castellano VJ, Martínez M, Martin MT et al. (2009) Toxicokinetics of glyphosate and its metabolite aminomethyl phosphonic acid in rats. Toxicol Lett, 190(1), 91–95. - PubMed
    1. ATSDR (Agency for Toxic Substances and Disease Registry). (2020) Toxicological profile for glyphosate. https://www.atsdr.cdc.gov/toxprofiles/tp214.pdf [accessed 10 March 2022]. - PubMed
    1. Benbrook CM (2016) Trends in glyphosate herbicide use in the United States and globally. Environ Sci Eur, 28(1), 3. - PMC - PubMed
    1. Benigni R, Bignami M, Carere A, Conti G, Conti L, Crebelli R. et al. (1979) Mutational studies with diquat and paraquat in vitro. Mutat Res, 68(3), 183–193. - PubMed
    1. Bentley R. (1990) The shikimate pathway--a metabolic tree with many branches. Crit Rev Biochem Mol Biol, 25(5), 307–384. - PubMed

Publication types

Substances