

Exploration of utility of combined optical photothermal infrared and Raman imaging for investigating the chemical composition of microcalcifications in breast cancer
- PMID: 36880909
- PMCID: PMC10065137
- DOI: 10.1039/d2ay01197b
Exploration of utility of combined optical photothermal infrared and Raman imaging for investigating the chemical composition of microcalcifications in breast cancer
Abstract
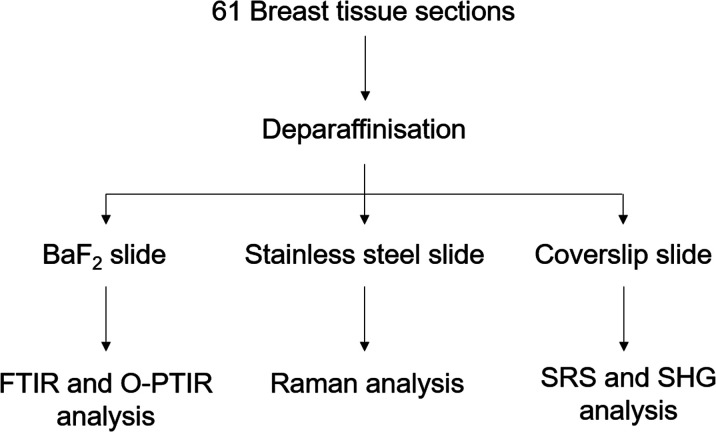
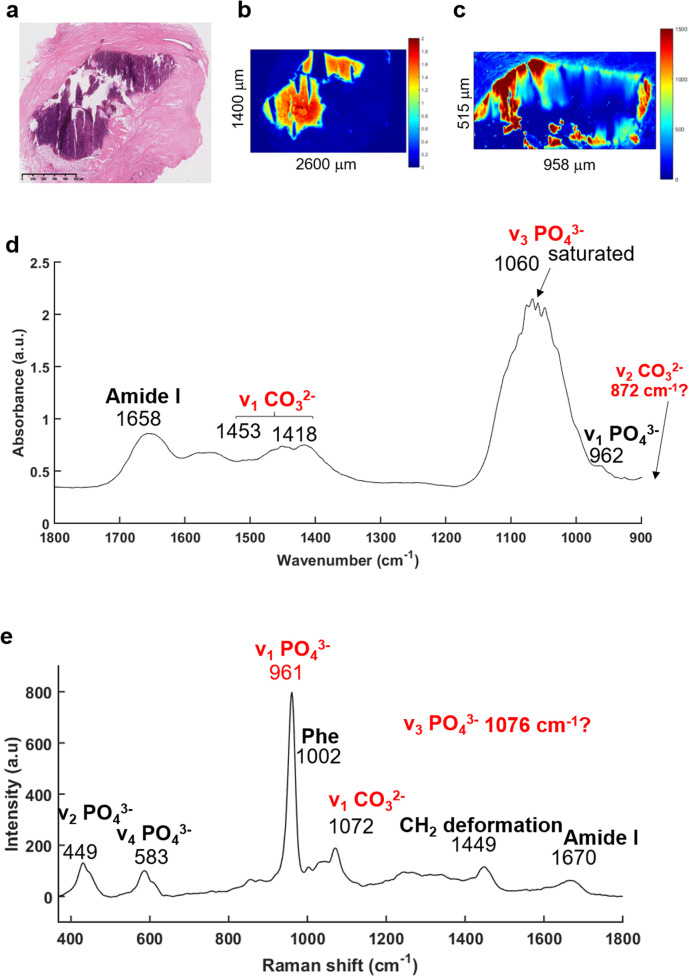
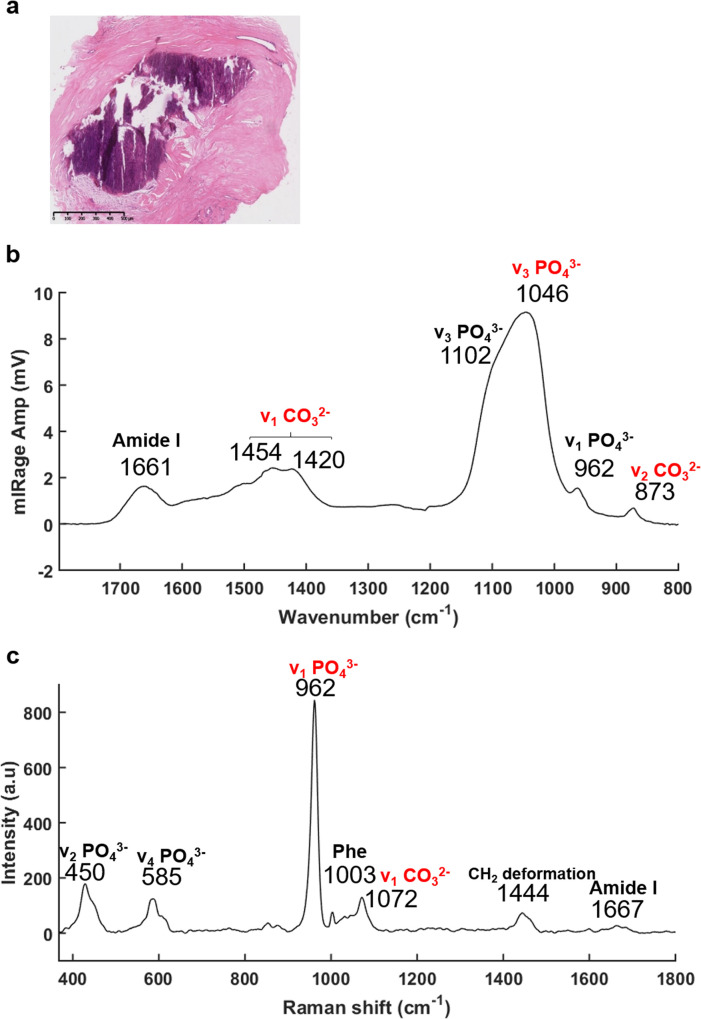
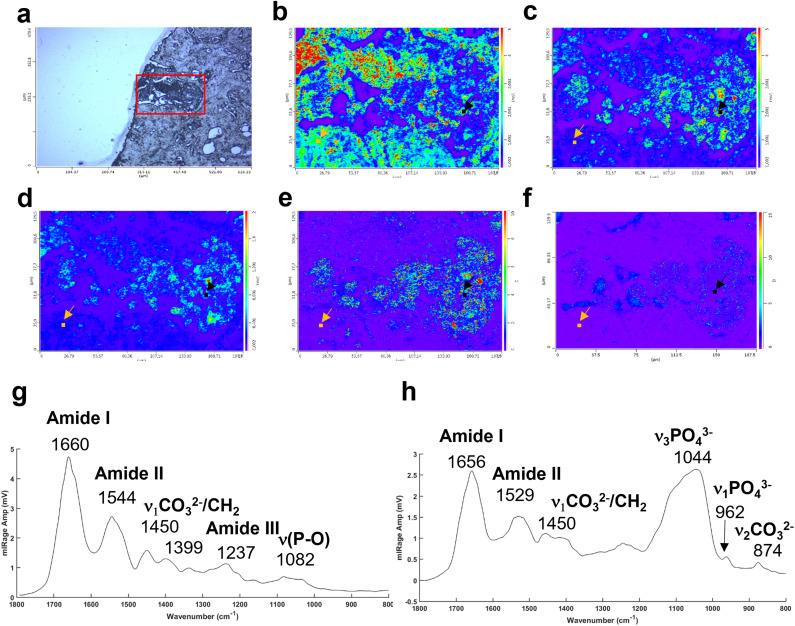
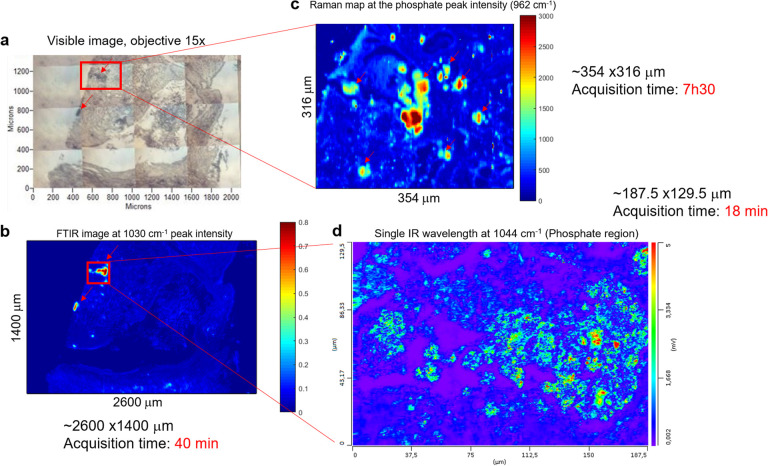
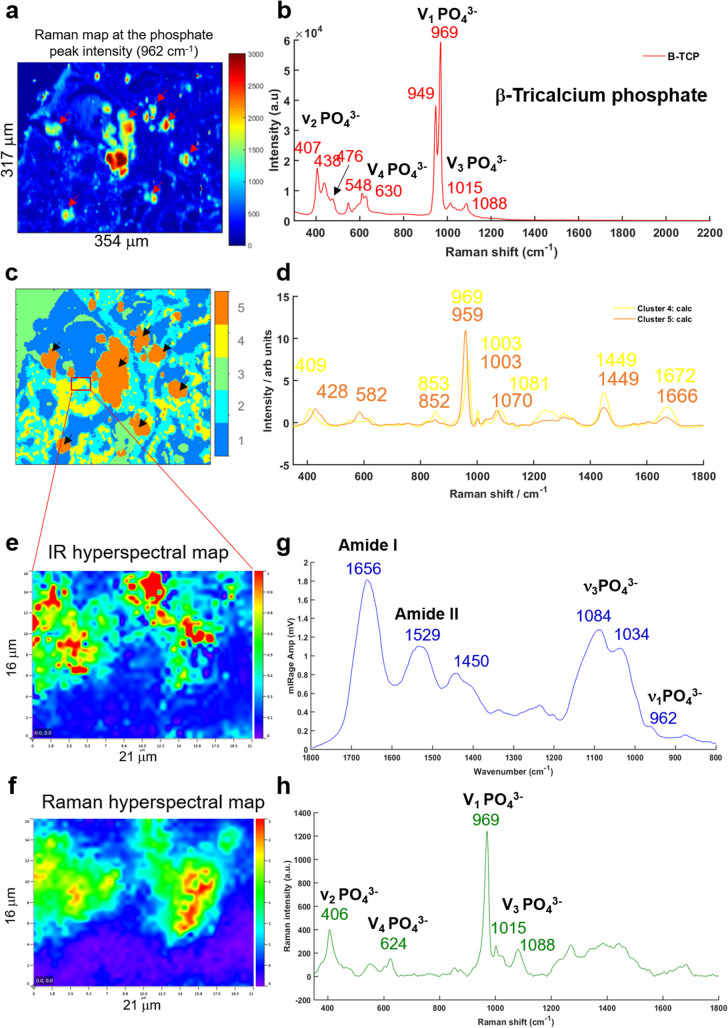
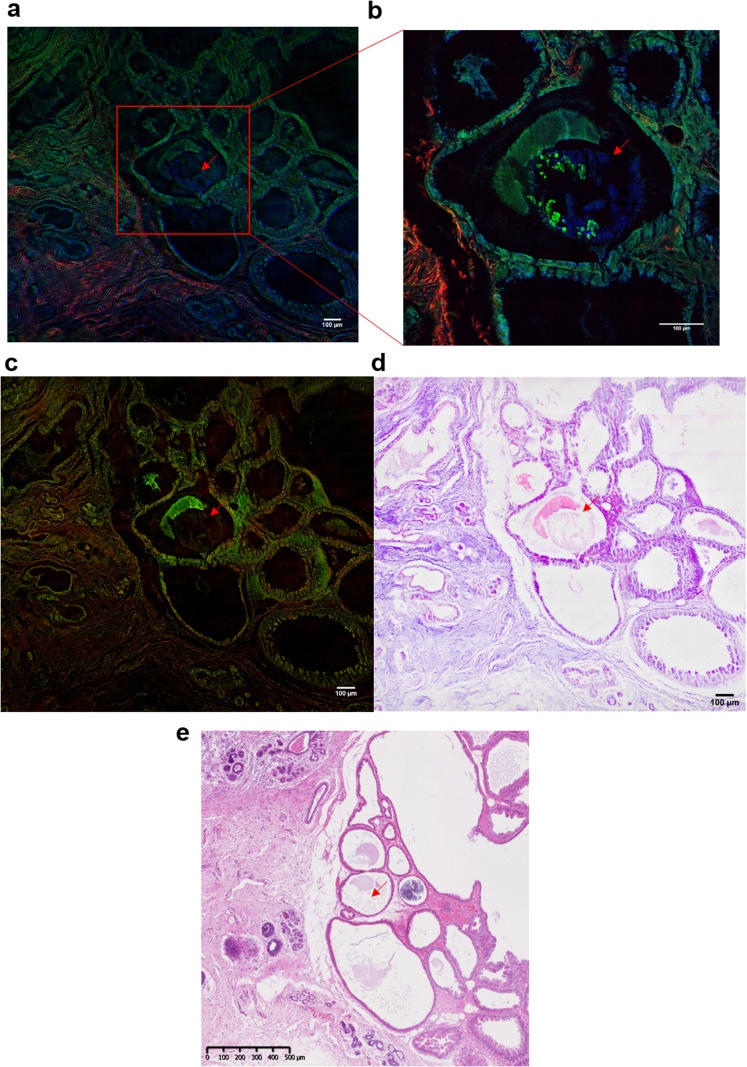
Microcalcifications play an important role in cancer detection. They are evaluated by their radiological and histological characteristics but it is challenging to find a link between their morphology, their composition and the nature of a specific type of breast lesion. Whilst there are some mammographic features that are either typically benign or typically malignant often the appearances are indeterminate. Here, we explore a large range of vibrational spectroscopic and multiphoton imaging techniques in order to gain more information about the composition of the microcalcifications. For the first time, we validated the presence of carbonate ions in the microcalcifications by O-PTIR and Raman spectroscopy at the same time, the same location and the same high resolution (0.5 μm). Furthermore, the use of multiphoton imaging allowed us to create stimulated Raman histology (SRH) images which mimic histological images with all chemical information. In conclusion, we established a protocol for efficiently analysing the microcalcifications by iteratively refining the area of interest.
Conflict of interest statement
“There are no conflicts to declare”.
Figures
Similar articles
-
Raman Spectroscopy Reveals That Biochemical Composition of Breast Microcalcifications Correlates with Histopathologic Features.Cancer Res. 2020 Apr 15;80(8):1762-1772. doi: 10.1158/0008-5472.CAN-19-3204. Epub 2020 Feb 24. Cancer Res. 2020. PMID: 32094303
-
Quantitative chemical imaging of breast calcifications in association with neoplastic processes.Theranostics. 2020 Apr 27;10(13):5865-5878. doi: 10.7150/thno.43325. eCollection 2020. Theranostics. 2020. PMID: 32483424 Free PMC article.
-
The significance of mammographic calcifications in early breast cancer detection.Radiol Med. 1986 Jan-Feb;72(1-2):7-12. Radiol Med. 1986. PMID: 3008222
-
[Digital magnification mammography. A new technique for improved visualization of microcalcifications in breast cancer diagnosis].Radiologe. 1993 May;33(5):260-6. Radiologe. 1993. PMID: 8516436 Review. German.
-
Microcalcifications in breast cancer: From pathophysiology to diagnosis and prognosis.Biochim Biophys Acta Rev Cancer. 2018 Apr;1869(2):310-320. doi: 10.1016/j.bbcan.2018.04.006. Epub 2018 Apr 21. Biochim Biophys Acta Rev Cancer. 2018. PMID: 29684522 Review.
Cited by
-
A tutorial on optical photothermal infrared (O-PTIR) microscopy.APL Photonics. 2024 Sep 1;9(9):091101. doi: 10.1063/5.0219983. Epub 2024 Sep 13. APL Photonics. 2024. PMID: 39290719 Free PMC article.
-
Artificial Intelligence-Assisted Stimulated Raman Histology: New Frontiers in Vibrational Tissue Imaging.Cancers (Basel). 2024 Nov 22;16(23):3917. doi: 10.3390/cancers16233917. Cancers (Basel). 2024. PMID: 39682107 Free PMC article. Review.
-
Oleic acid differentially affects lipid droplet storage of de novo synthesized lipids in hepatocytes and adipocytes.Chem Commun (Camb). 2024 Mar 14;60(23):3138-3141. doi: 10.1039/d3cc04829b. Chem Commun (Camb). 2024. PMID: 38329230 Free PMC article.
-
An optical photothermal infrared investigation of lymph nodal metastases of oral squamous cell carcinoma.Sci Rep. 2024 Jul 11;14(1):16050. doi: 10.1038/s41598-024-66977-z. Sci Rep. 2024. PMID: 38992088 Free PMC article.
-
Assessment of submicron bone tissue composition in plastic-embedded samples using optical photothermal infrared (O-PTIR) spectral imaging and machine learning.J Struct Biol X. 2024 Oct 9;10:100111. doi: 10.1016/j.yjsbx.2024.100111. eCollection 2024 Dec. J Struct Biol X. 2024. PMID: 39507318 Free PMC article.
References
-
- Johnson J. M. Dalton R. R. Wester S. M. Landercasper J. Lambert P. J. JAMA Surg. 1999;134:712–716. - PubMed
Publication types
MeSH terms
Grants and funding
LinkOut - more resources
Full Text Sources
Medical