

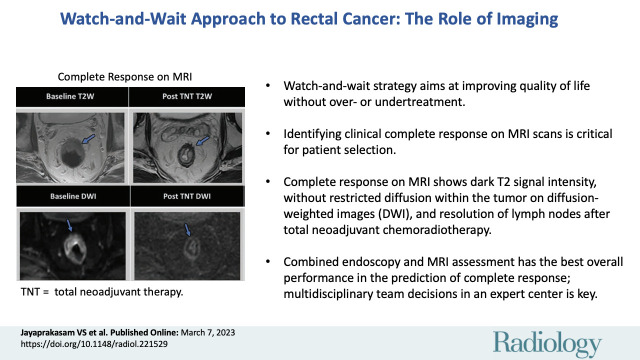
Watch-and-Wait Approach to Rectal Cancer: The Role of Imaging
- PMID: 36880951
- PMCID: PMC10068893
- DOI: 10.1148/radiol.221529
Watch-and-Wait Approach to Rectal Cancer: The Role of Imaging
Abstract
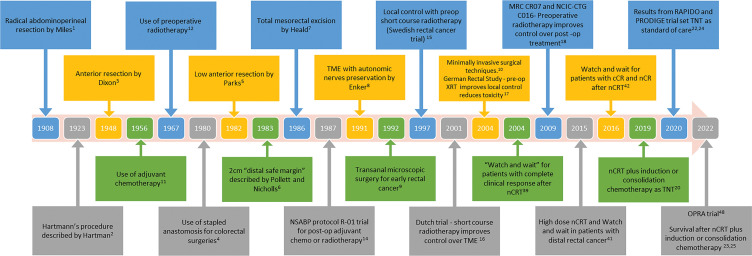
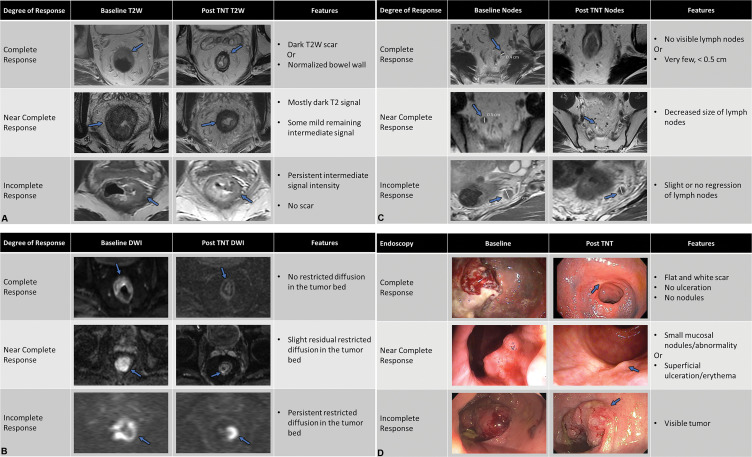
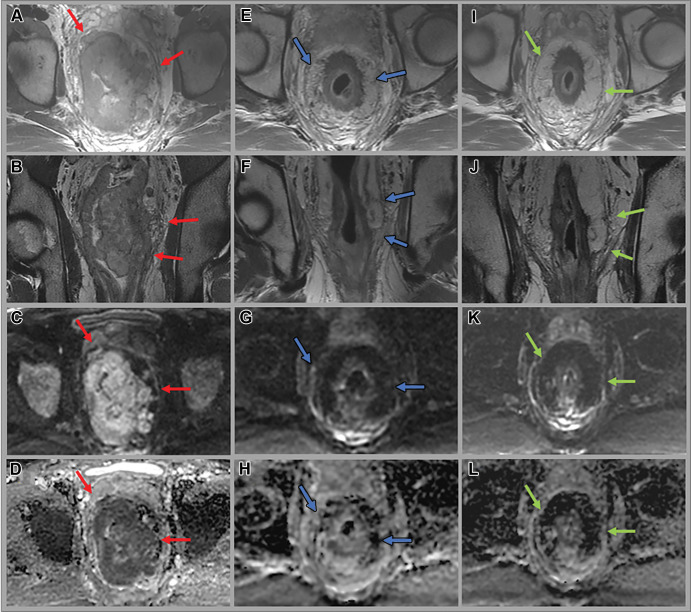
The diagnosis and treatment of rectal cancer have evolved dramatically over the past several decades. At the same time, its incidence has increased in younger populations. This review will inform the reader of advances in both diagnosis and treatment. These advances have led to the watch-and-wait approach, otherwise known as nonsurgical management. This review briefly outlines changes in medical and surgical treatment, advances in MRI technology and interpretation, and landmark studies or trials that have led to this exciting juncture. Herein, the authors delve into current state-of-the-art methods to assess response to treatment with MRI and endoscopy. Currently, these methods for avoiding surgery can be used to detect a complete clinical response in as many as 50% of patients with rectal cancer. Finally, the limitations of imaging and endoscopy and future challenges will be discussed.
© RSNA, 2023.
Conflict of interest statement
Figures
References
-
- Miles WE . A method of performing abdomino-perineal excision for carcinoma of the rectum and of the terminal portion of the pelvic colon (1908) . CA Cancer J Clin 1971. ; 21 ( 6 ): 361 – 364 . - PubMed
-
- Galler AS , Petrelli NJ , Shakamuri SP . Rectal cancer surgery: a brief history . Surg Oncol 2011. ; 20 ( 4 ): 223 – 230 . - PubMed
-
- Heald RJ . Towards fewer colostomies--the impact of circular stapling devices on the surgery of rectal cancer in a district hospital . Br J Surg 1980. ; 67 ( 3 ): 198 – 200 . - PubMed
-
- Parks AG , Percy JP . Resection and sutured colo-anal anastomosis for rectal carcinoma . Br J Surg 1982. ; 69 ( 6 ): 301 – 304 . - PubMed
Publication types
MeSH terms
Grants and funding
LinkOut - more resources
Full Text Sources
Miscellaneous
