. 2023 Jun;16(6):800-816.
doi: 10.1016/j.jcmg.2022.11.018. Epub 2023 Feb 8.

Deep-Learning for Epicardial Adipose Tissue Assessment With Computed Tomography: Implications for Cardiovascular Risk Prediction

Affiliations

Deep-Learning for Epicardial Adipose Tissue Assessment With Computed Tomography: Implications for Cardiovascular Risk Prediction

Henry W West et al. JACC Cardiovasc Imaging. 2023 Jun.

Abstract

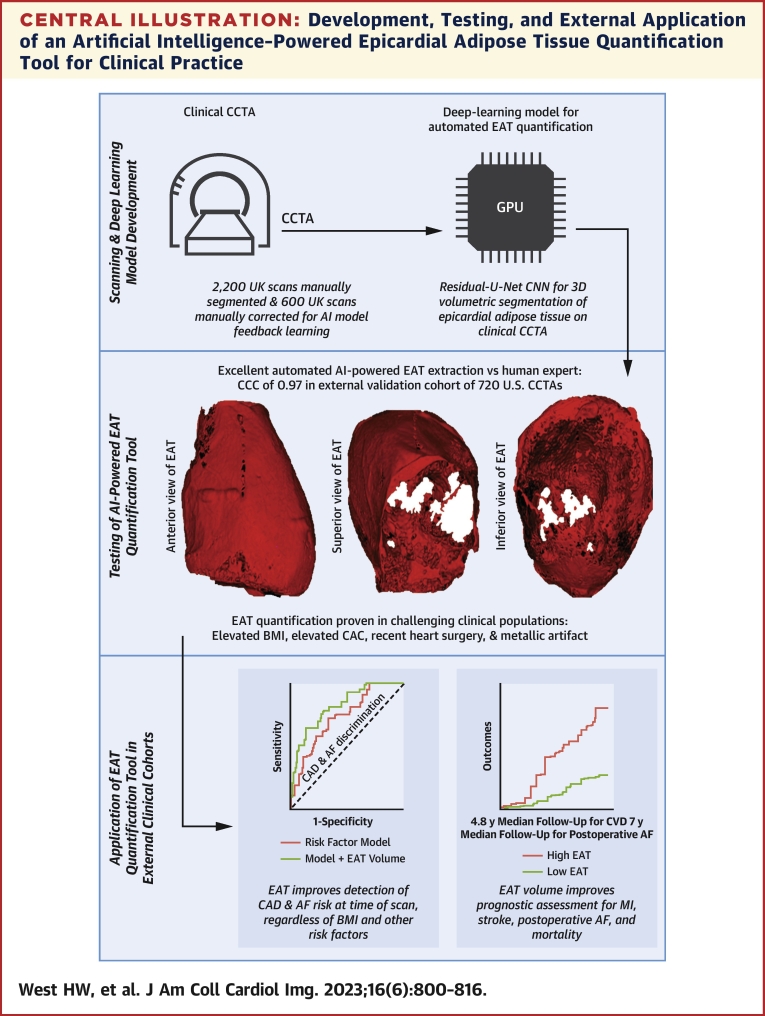
Background: Epicardial adipose tissue (EAT) volume is a marker of visceral obesity that can be measured in coronary computed tomography angiograms (CCTA). The clinical value of integrating this measurement in routine CCTA interpretation has not been documented.

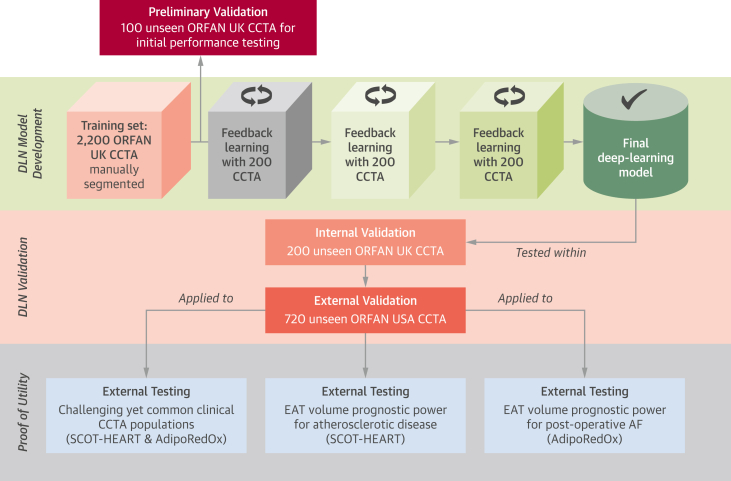
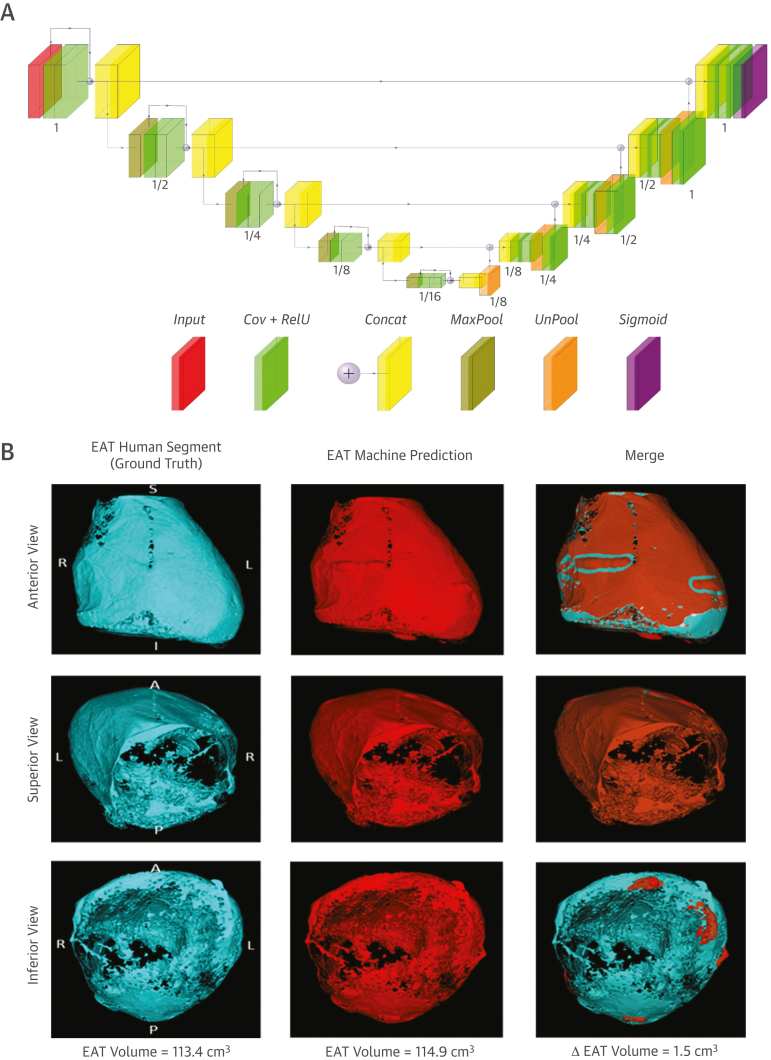
Objectives: This study sought to develop a deep-learning network for automated quantification of EAT volume from CCTA, test it in patients who are technically challenging, and validate its prognostic value in routine clinical care.

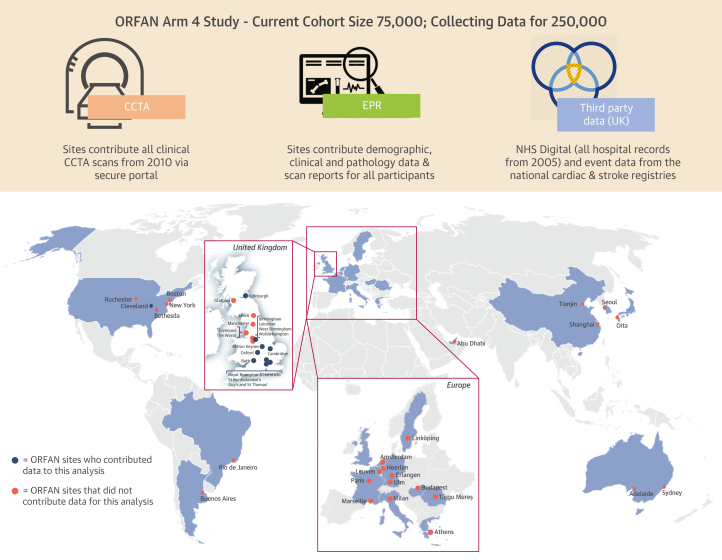
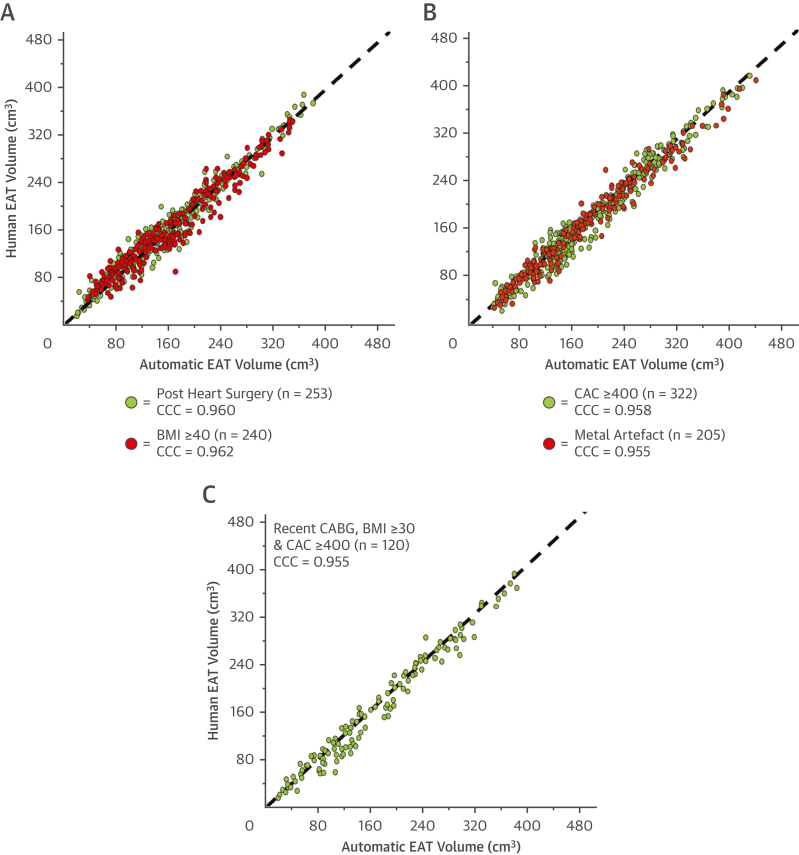
Methods: The deep-learning network was trained and validated to autosegment EAT volume in 3,720 CCTA scans from the ORFAN (Oxford Risk Factors and Noninvasive Imaging Study) cohort. The model was tested in patients with challenging anatomy and scan artifacts and applied to a longitudinal cohort of 253 patients post-cardiac surgery and 1,558 patients from the SCOT-HEART (Scottish Computed Tomography of the Heart) Trial, to investigate its prognostic value.

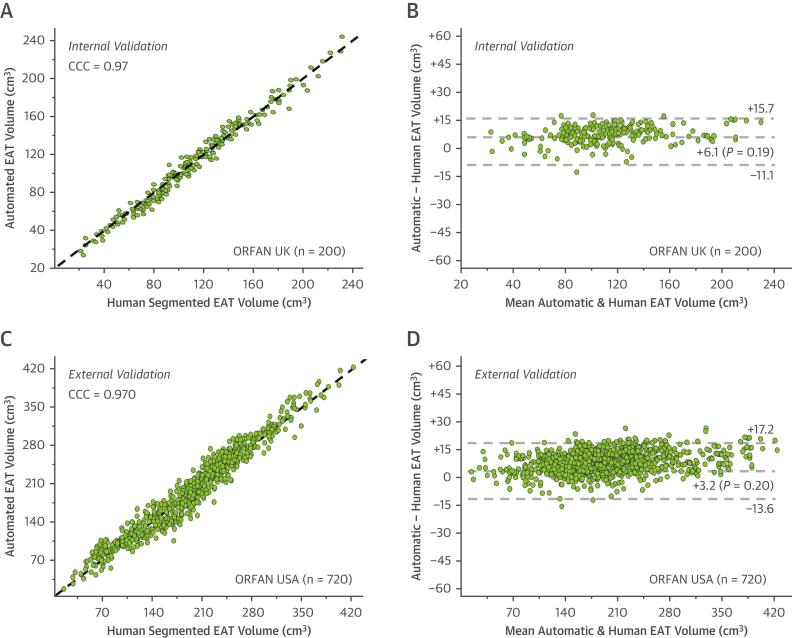
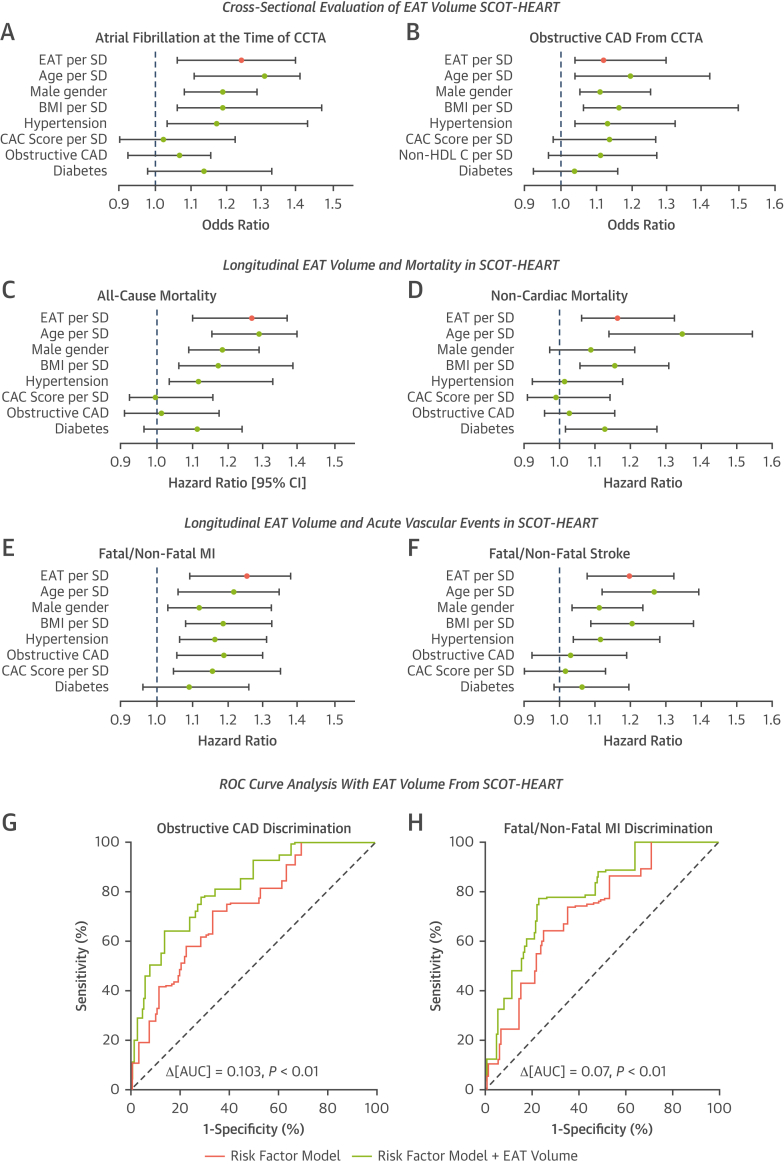
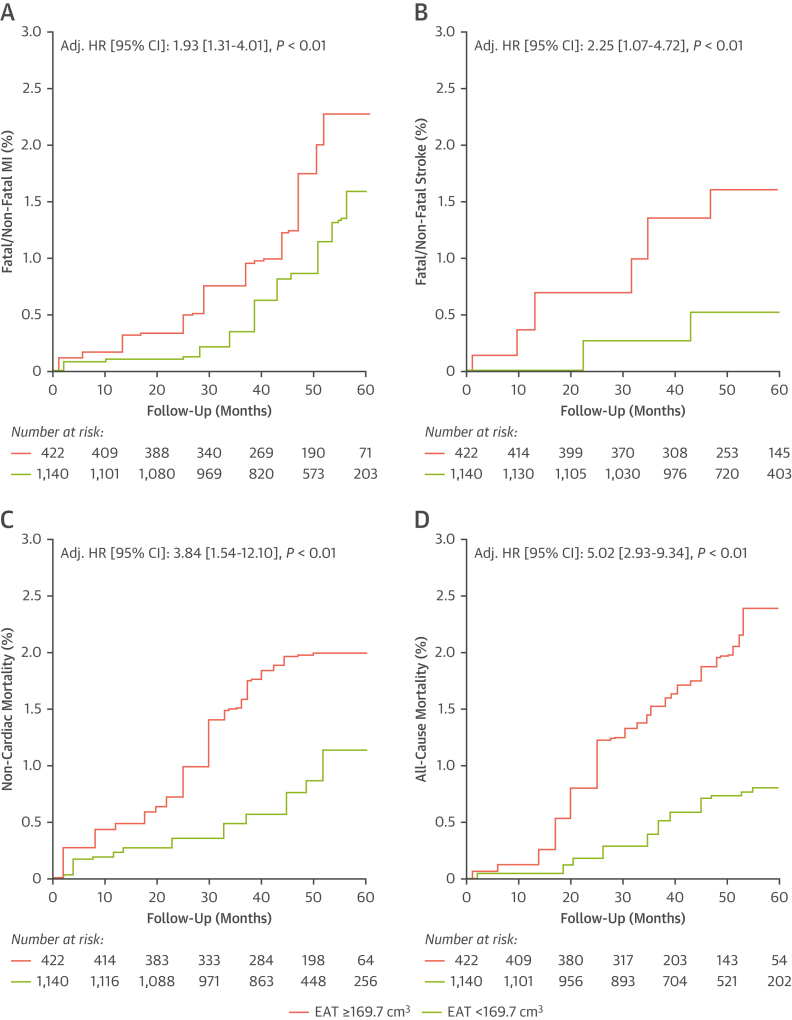
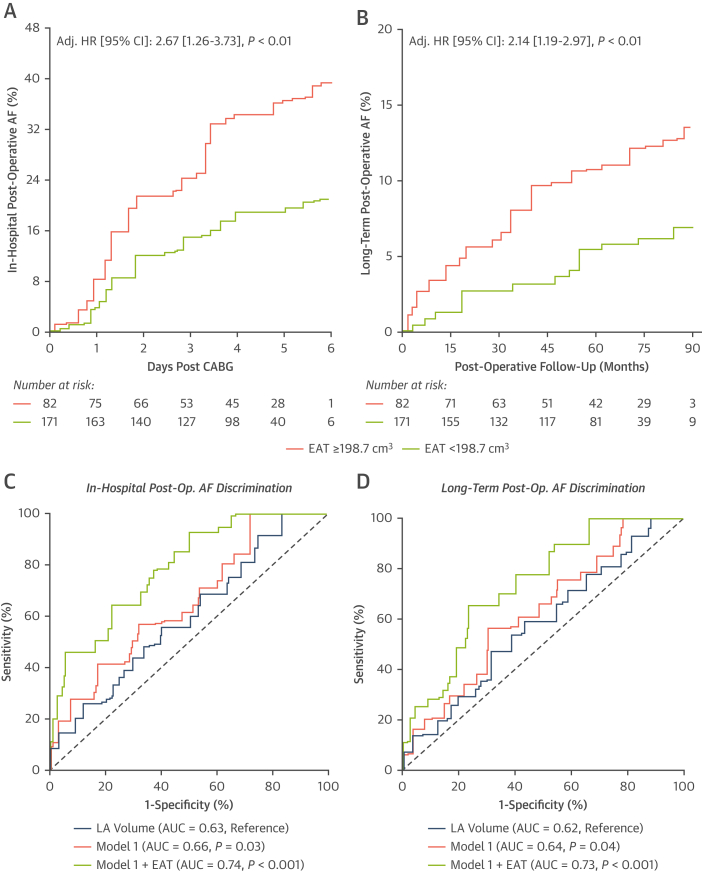
Results: External validation of the deep-learning network yielded a concordance correlation coefficient of 0.970 for machine vs human. EAT volume was associated with coronary artery disease (odds ratio [OR] per SD increase in EAT volume: 1.13 [95% CI: 1.04-1.30]; P = 0.01), and atrial fibrillation (OR: 1.25 [95% CI: 1.08-1.40]; P = 0.03), after correction for risk factors (including body mass index). EAT volume predicted all-cause mortality (HR per SD: 1.28 [95% CI: 1.10-1.37]; P = 0.02), myocardial infarction (HR: 1.26 [95% CI:1.09-1.38]; P = 0.001), and stroke (HR: 1.20 [95% CI: 1.09-1.38]; P = 0.02) independently of risk factors in SCOT-HEART (5-year follow-up). It also predicted in-hospital (HR: 2.67 [95% CI: 1.26-3.73]; P ≤ 0.01) and long-term post-cardiac surgery atrial fibrillation (7-year follow-up; HR: 2.14 [95% CI: 1.19-2.97]; P ≤ 0.01).

Conclusions: Automated assessment of EAT volume is possible in CCTA, including in patients who are technically challenging; it forms a powerful marker of metabolically unhealthy visceral obesity, which could be used for cardiovascular risk stratification.

Keywords: adipose tissue; atherosclerosis; atrial fibrillation; computed tomography; deep-learning; visceral fat.


Conflict of interest statement

Funding Support and Author Disclosures This study received support from the British Heart Foundation (grant TG/19/2/34831) and the European Union Commission Horizon 2020 program via the Machine Learning Artificial Intelligence Early Detection Stroke Atrial Fibrillation (MAESTRIA) Consortium (grant 965286). Drs Siddique, Tomlins, and Shirodaria are employees of Caristo Diagnostics Ltd. Dr Williams has received support from the British Heart Foundation (grant FS/ICRF/20/26002); and has served on the Speakers Bureau for Canon Medical Systems. Dr Adlam has received support from the Leicester National Institute of Health Research Biomedical Research Centre; has received research funding and in-kind support for unrelated research from AstraZeneca Inc; has received an educational grant from Abbott Vascular Inc to support a clinical research fellow for unrelated research; and has also conducted consultancy for GE Inc to support research funds for unrelated research. Drs Shirodaria, Neubauer, Channon, and Antoniades are founders, shareholders, and directors of Caristo Diagnostics Ltd, a CT-image analysis company. Dr Antoniades has received support from the British Heart Foundation (grants CH/F/21/90009, TG/19/2/34831, and RG/F/21/110040), Innovate UK (grant 104472), and the National Consortium of Intelligent Medical Imaging through the Industry Strategy Challenge Fund (Innovate UK grant 104688); and is also the inventor of patents US10,695,023B2, PCT/GB2017/053262, GB2018/1818049.7, GR20180100490, and GR20180100510, which are licensed through exclusive license to Caristo Diagnostics. All other authors have reported that they have no relationships relevant to the contents of this paper to disclose.

Figures

None
Graphical abstract
Central Illustration
Development, Testing, and External Application of an Artificial Intelligence–Powered Epicardial Adipose Tissue Quantification Tool for Clinical Practice (Top) A deep-learning model was trained to automatically extract the adipose tissue from CCTA. (Middle) The model performed excellently compared to human segmentation in internal and external testing, including in patient groups that are commonly occurring yet challenging for CCTA. (Bottom) The final automated artificial intelligence (AI) model for epicardial adipose tissue (EAT) quantification was applied to external clinical cohorts and revealed improved detection of prevalent disease risk for coronary artery disease (CAD) and atrial fibrillation (AF) and provided incremental prognostic benefit for key cardiovascular events such as myocardial infarction (MI), stroke, postoperative AF, and mortality in longitudinal cohorts. 3D = 3-dimensional; BMI = body mass index; CAC = coronary artery calcium; CCC = Lin concordance correlation coefficient; CNN = convolutional neural network; CCTA = coronary computed tomography angiography; CVD = cardiovascular disease; GPU = graphics processing unit.
Figure 1
Figure 1
The ORFAN Arm 4 Study The ORFAN (Oxford Risk Factors and Noninvasive Imaging Study) Arm 4 study is an international multicenter retrospective cohort study of patients undergoing clinically indicated CCTA. The initial cohort size is 75,000 patients within the United Kingdom and 25,000 internationally, with ethically approved expansion underway for 250,000 patients. Within the United Kingdom, the study includes 17 National Health Service (NHS) Trusts, 4 of which contributed data to the current study. Data collected for each participant includes the CCTA scan, data from the local hospital electronic patient record (EPR), and data from authorized third parties, including NHS Digital, all hospital event data from 2005 to now; NICOR (National Institute for Cardiovascular Outcomes Research), a national cardiac event registry; and SSNAP (Sentinel Stroke National Audit Programme), a national stroke event registry. CCTA = coronary computed tomography angiography.
Figure 2
Figure 2
Study Flowchart of Model Development, Testing, and External Application Schematic representation of the scientific approach to the development of the deep-learning model, the validation of the model through internal and external cohorts, and the application of the automated epicardial adipose tissue (EAT) volume quantification tool to 3 groups of patients from the AdipoRedOx (Adipose tissue and cardiovascular RedOx regulation) study and SCOT-HEART (Scottish Computed Tomography of the Heart) trial. AF = atrial fibrillation; DLN = deep-learning network; other abbreviations as in Figure 1.
Figure 3
Figure 3
Schematic of the Deep-Learning Model for Automated Segmentation of the Whole Heart Within the Pericardium and Example Automated Segmentation (A) Block diagram of the Residual U-Net–based convolutional neural network architecture. Details of each layer are provided in the Supplemental Methods. (B) A single CCTA from the ORFAN study demonstrating human expert segmentation as ground truth, automated machine segmentation and a merge. A = anterior; Concat = concatenation; Cov = convolution; I = inferior; L = left; P = posterior; R = right; RelU = rectified linear activation function; S = superior; other abbreviations as in Figures 1 and 2.
Figure 4
Figure 4
Validation of the Deep-Learning Model Following all training and fine-tuning of the algorithm, internal validation in 200 ORFAN UK cases occurred and is demonstrated in the scatterplot (A) and Bland-Altman plot (B). External validation in 720 ORFAN USA scans is shown in the scatterplot (C) and Bland-Altman plot (D). CCC = Lin concordance correlation coefficient; other abbreviations as in Figures 1 and 2.
Figure 5
Figure 5
Validation of the Automated Deep-Learning Model in Challenging Clinical Populations The automated EAT volume quantification tool was applied to groupings of unseen CCTA from the AdipoRedOx study and the SCOT-HEART trial. (A) Patients who underwent open heart surgery, specifically coronary artery bypass graft (CABG), up to 6 weeks prior to CCTA (green) and patients with body mass index (BMI) ≥40 kg/m2(red); (B) patients with coronary artery calcium (CAC) ≥400 (green) and patients with significant metallic artifact within the pericardium (red); (C) patients who underwent open heart surgery (CABG) up to 6 weeks prior to the CCTA, had BMI ≥30 kg/m2 and CAC ≥400. Abbreviations as in Figures 1, 2, and 4.
Figure 6
Figure 6
Cross-Sectional and Longitudinal Associations Between EAT Volume and Clinical Outcomes in the SCOT-HEART Trial Plots of cross-sectional adjusted risk models for atrial fibrillation at the time of the scan, adjusted for age, sex, BMI, hypertension, CAC score, diabetes, and obstructive coronary artery disease (CAD) as detected on CT (A); and obstructive CAD (any 1 coronary vessel with ≥50% stenosis on CCTA), adjusted for the same risk factors plus non-HDL cholesterol and without obstructive CAD (B). Odds ratio is shown per 1-SD increase in EAT volume for 1,558 patients randomized to receive CCTA in the SCOT-HEART trial. Plots of longitudinal HRs per SD increase in EAT volume in 1,558 patients randomized to receive CCTA in the SCOT-HEART trial are shown for all-cause mortality (C) and noncardiac mortality (D), both with the same adjustment as for A. MI (both fatal and nonfatal) (E) and stroke (both fatal and nonfatal) (F) are shown with the same adjustment. Receiver-operating characteristic (ROC) curves are shown for the discrimination of obstructive CAD at the time of the CCTA (G) and longitudinal MI (H). The risk factor model (green) for each curve includes age, male sex, BMI, hypertension, non-HDL cholesterol, diabetes, and CAC score, with obstructive CAD also included in the MI model. Red in both curve is the risk factor model with the addition of EAT volume. ∗Continuous variables per SD increase; †P < 0.05. AUC = area under the curve; CT = computed tomography; HDL = high-density lipoprotein; MI = myocardial infarction; other abbreviations as in Figures 1, 2, and 5.
Figure 7
Figure 7
High EAT Volume Increases Risk of Major Adverse Events When Assessed With a Single Cutpoint Utilizing a single cutpoint for patients considered at high risk in SCOT-HEART (high risk = EAT ≥169.9 cm3), Kaplan-Meier curves for (A) fatal/nonfatal MI, (B) fatal/nonfatal stroke, (C) noncardiac mortality, and (D) all-cause mortality are demonstrated. All HRs are adjusted for age, sex, BMI, hypertension, diabetes mellitus, CAC score (log-transformed) and obstructive CAD as derived from CCTA. Abbreviations as in Figures 1, 2, 5, and 6.
Figure 8
Figure 8
Prognostic Value of EAT Volume for Postoperative AF Kaplan-Meier curve and adjusted HR for in-hospital postoperative (post-op.) atrial fibrillation (AF) (A) and long-term postoperative AF (B), with sample dichotomized by Youden J index–derived cutpoint of EAT volume (high risk ≥198.7 cm3; low risk <198.7 cm3), expressed per SD increase of EAT volume. Adjustment is made for age, sex, hypertension, diabetes, CAC score, and BMI. (C,D) Time-dependent ROC curves for discrimination of in-hospital postoperative AF (C) and long-term postoperative AF (D). CCTA–derived left atrial (LA) volume (blue) is shown alone; model 1 (red) consists of age, sex, hypertension, diabetes, CAC score, and BMI. The addition of EAT volume into model 1 is demonstrated (green). Abbreviations as in Figures 1, 2, 5, and 6.

Comment in

References

    1. Antoniades C., West H.W. Coronary CT angiography as an “one-stop shop” to detect the high-risk plaque and the vulnerable patient. Eur Heart J. 2021;42(37):3853–3855. - PMC - PubMed
    1. Knuuti J., Wijns W., Saraste A., et al. 2019 ESC guidelines for the diagnosis and management of chronic coronary syndromes. Eur Heart J. 2020;41(3):407–477. - PubMed
    1. Gulati M., Levy P.D., Mukherjee D., et al. 2021 AHA/ACC/ASE/CHEST/SAEM/SCCT/SCMR guideline for the evaluation and diagnosis of chest pain: a report of the American College of Cardiology/American Heart Association Joint Committee on Clinical Practice Guidelines. J Am Coll Cardiol. 2021;78(22):e187–e285. - PubMed
    1. Oikonomou E.K., West H.W., Antoniades C. Cardiac computed tomography: assessment of coronary inflammation and other plaque features. Arterioscler Thromb Vasc Biol. 2019;39(11):2207–2219. - PubMed
    1. Oikonomou E.K., Antoniades C. The role of adipose tissue in cardiovascular health and disease. Nat Rev Cardiol. 2019;16(2):83–99. - PubMed

Publication types