. 2023 Mar 7:12:e84632.
doi: 10.7554/eLife.84632.

Room-temperature crystallography reveals altered binding of small-molecule fragments to PTP1B

Affiliations

Room-temperature crystallography reveals altered binding of small-molecule fragments to PTP1B

Tamar Skaist Mehlman et al. Elife. .

Abstract

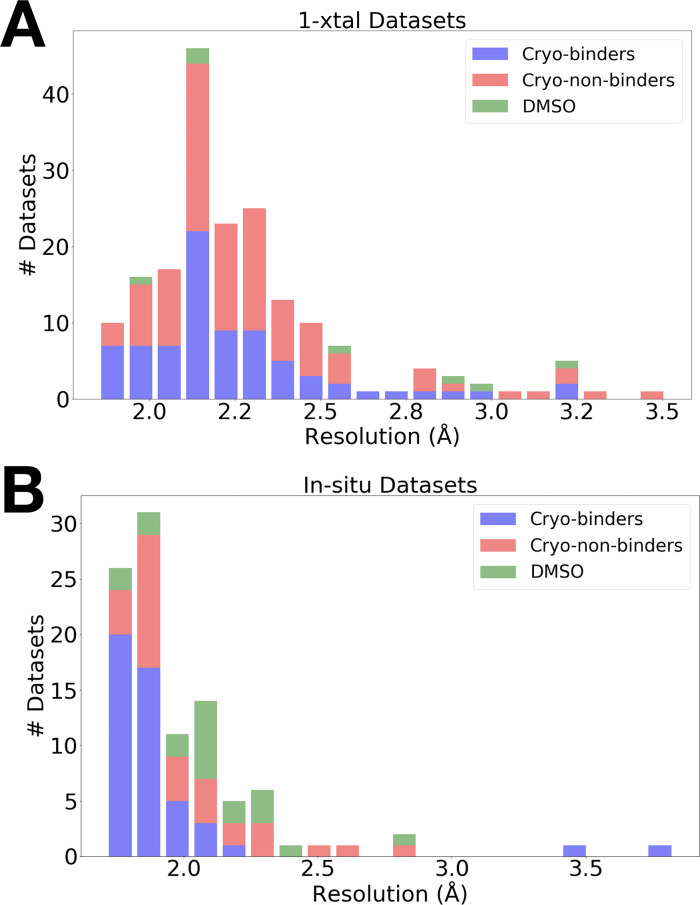
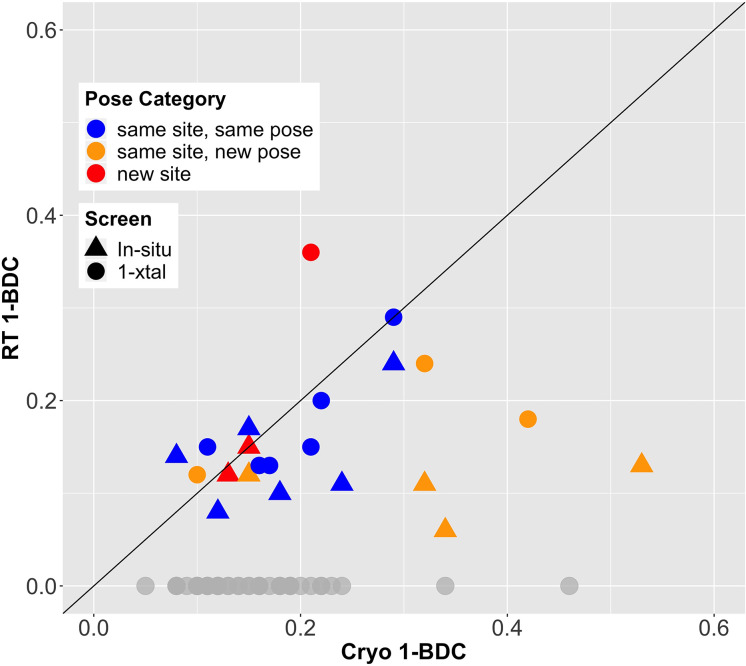
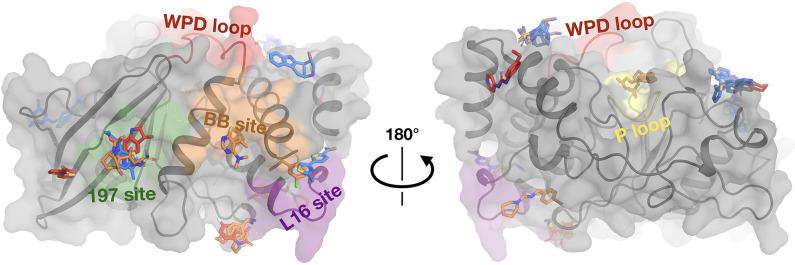
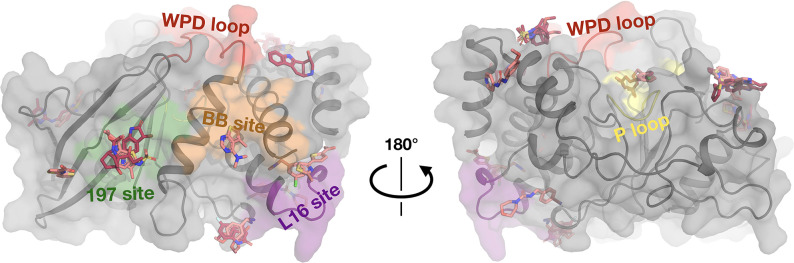
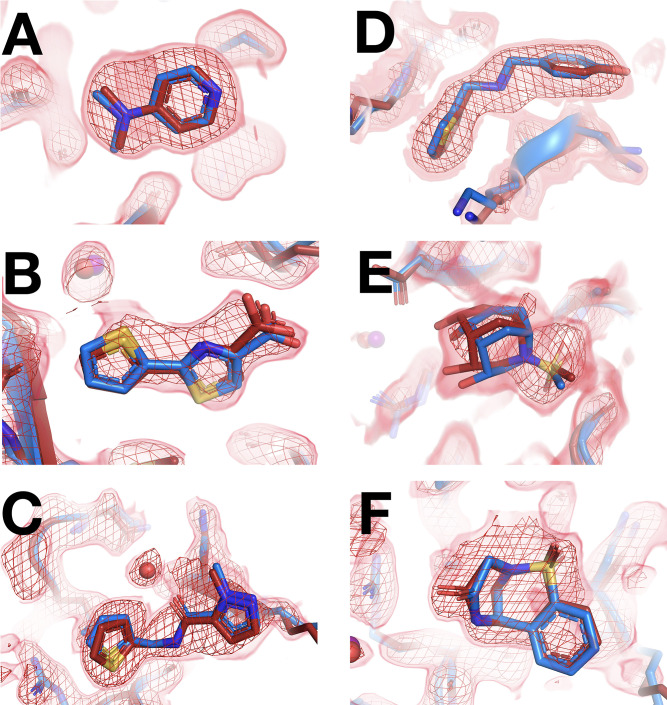
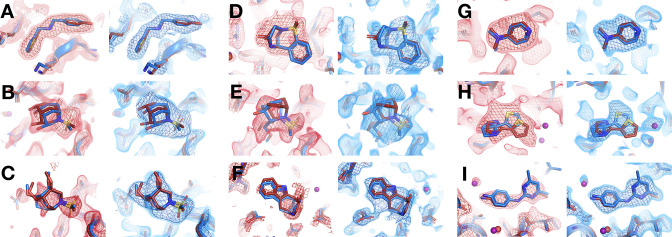
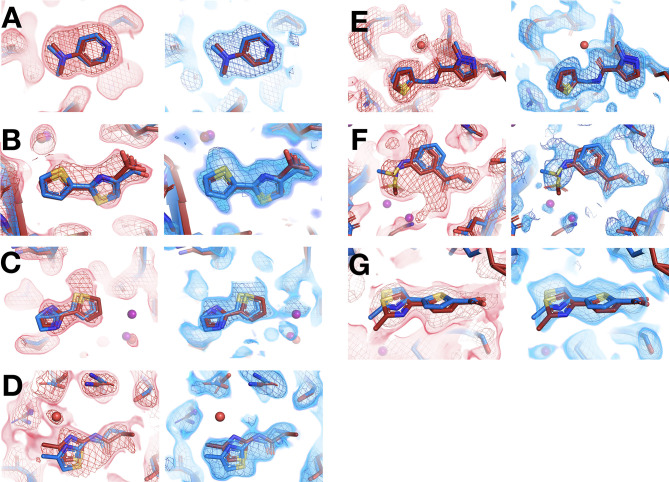
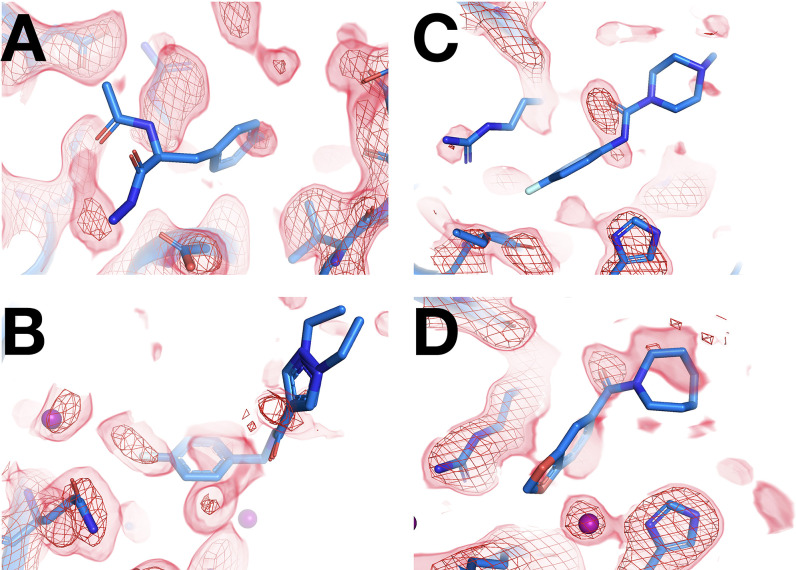
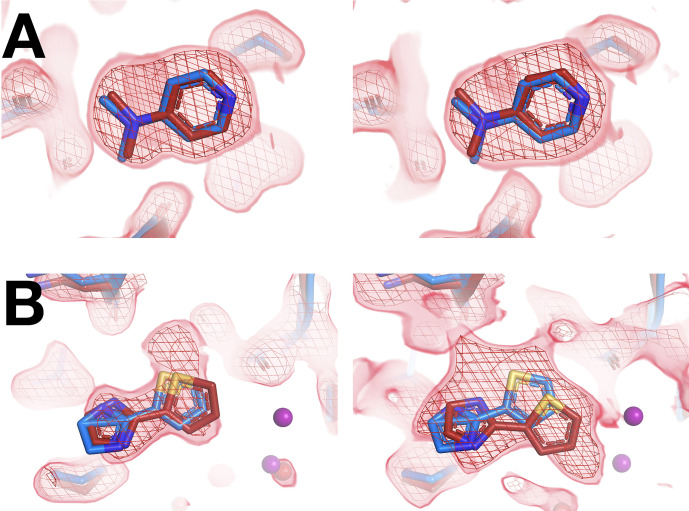
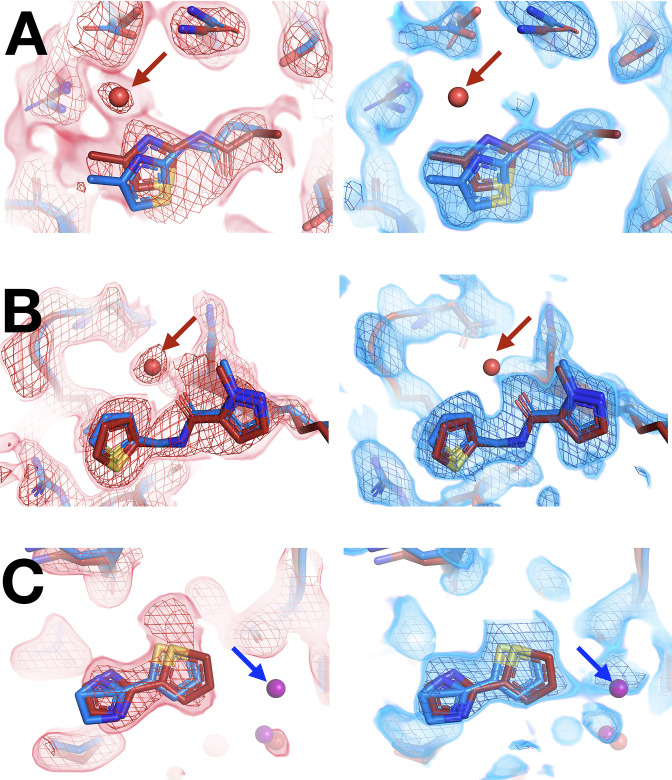
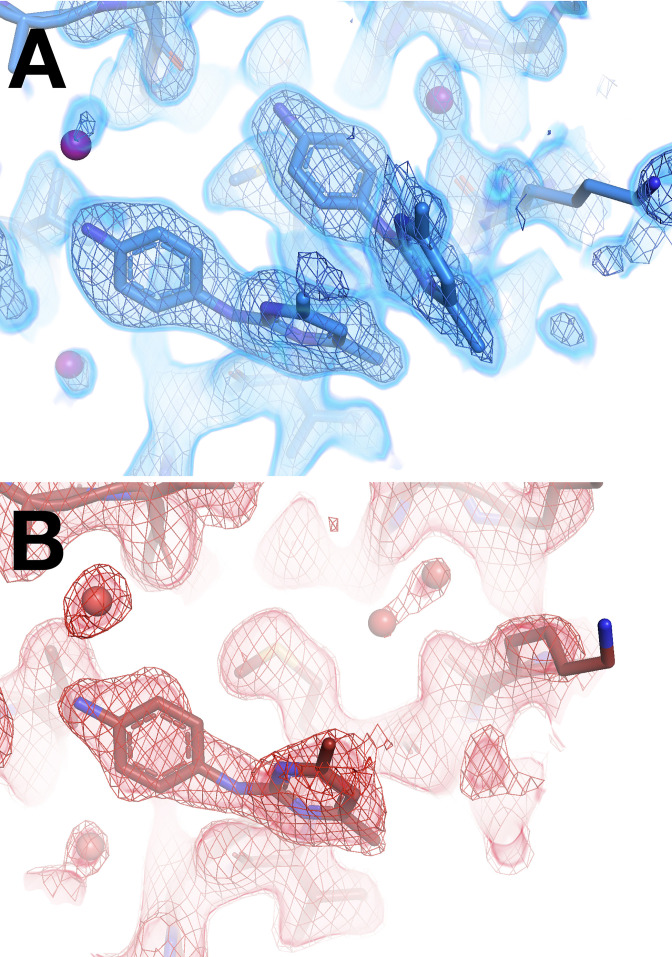
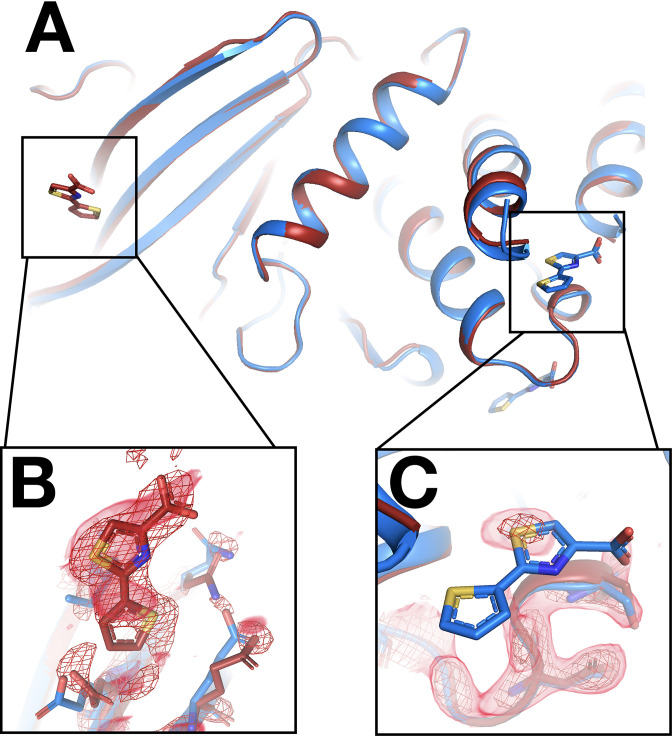
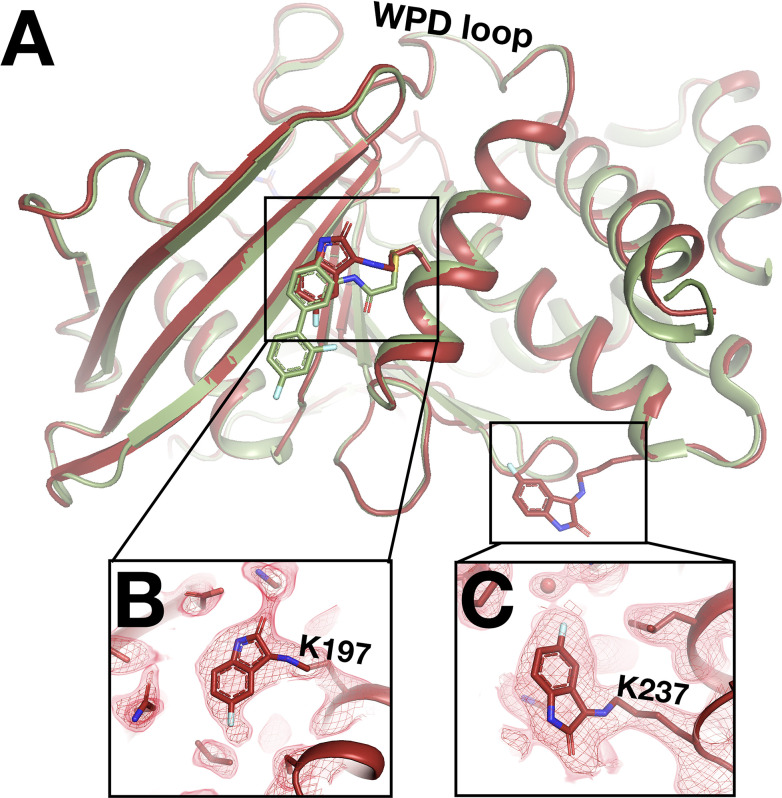
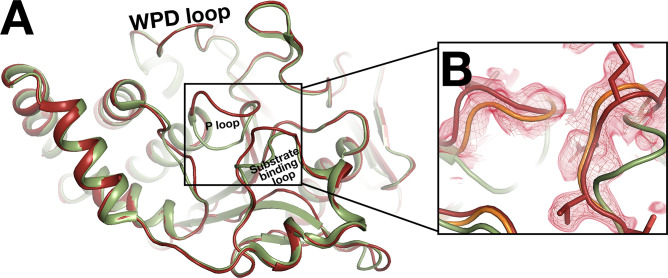
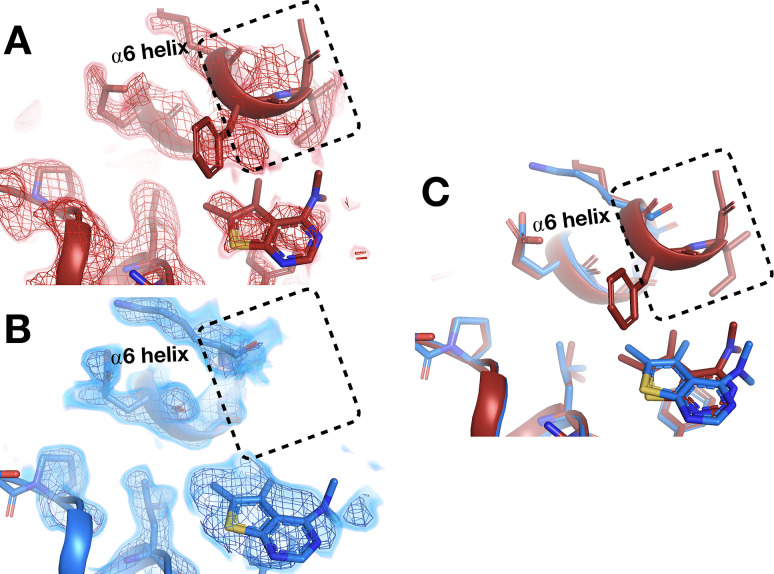
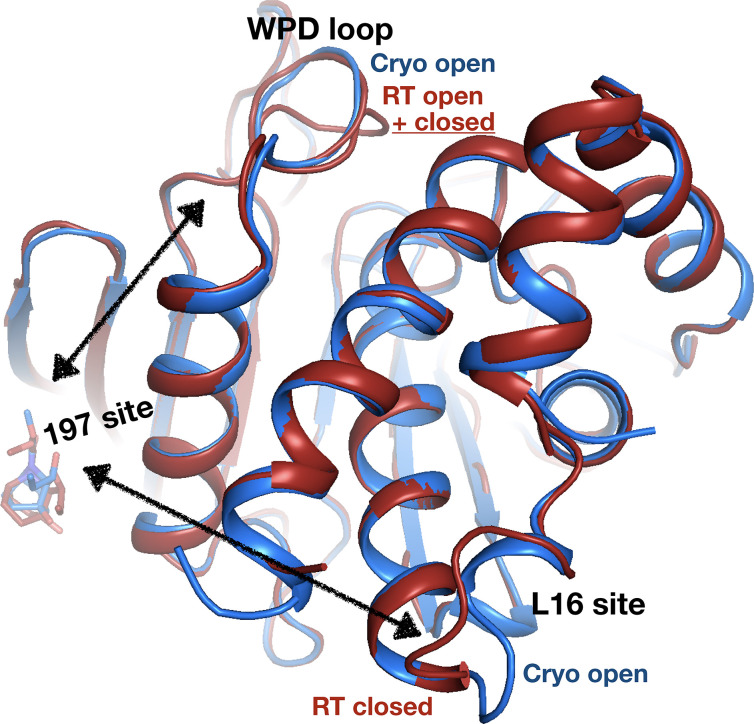
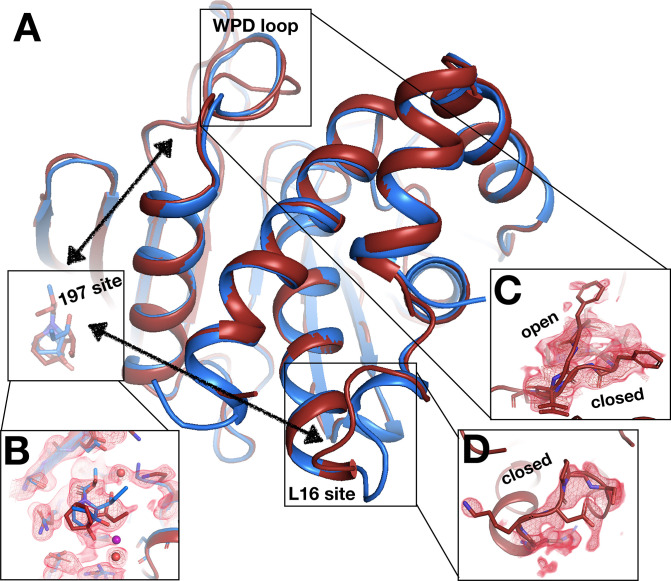
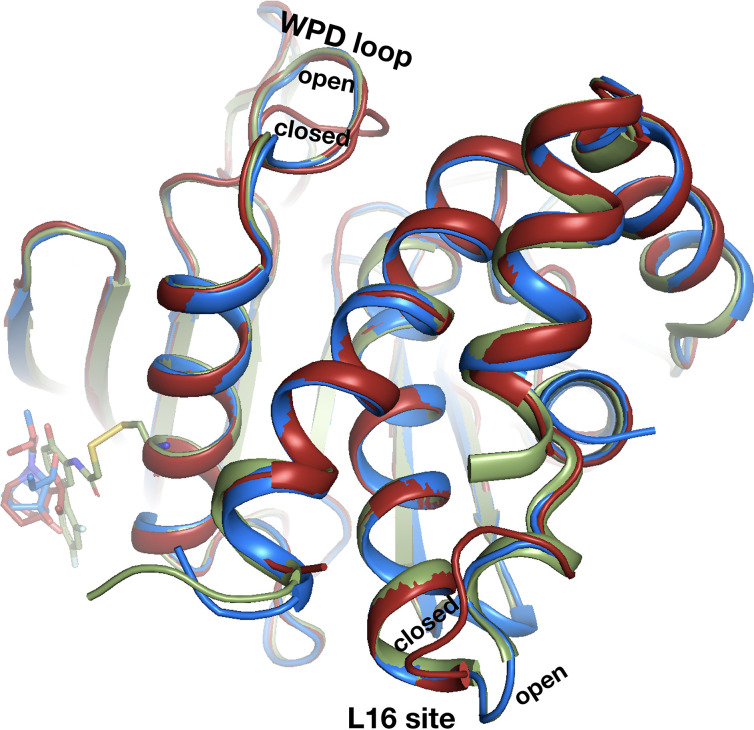
Much of our current understanding of how small-molecule ligands interact with proteins stems from X-ray crystal structures determined at cryogenic (cryo) temperature. For proteins alone, room-temperature (RT) crystallography can reveal previously hidden, biologically relevant alternate conformations. However, less is understood about how RT crystallography may impact the conformational landscapes of protein-ligand complexes. Previously, we showed that small-molecule fragments cluster in putative allosteric sites using a cryo crystallographic screen of the therapeutic target PTP1B (Keedy et al., 2018). Here, we have performed two RT crystallographic screens of PTP1B using many of the same fragments, representing the largest RT crystallographic screens of a diverse library of ligands to date, and enabling a direct interrogation of the effect of data collection temperature on protein-ligand interactions. We show that at RT, fewer ligands bind, and often more weakly - but with a variety of temperature-dependent differences, including unique binding poses, changes in solvation, new binding sites, and distinct protein allosteric conformational responses. Overall, this work suggests that the vast body of existing cryo-temperature protein-ligand structures may provide an incomplete picture, and highlights the potential of RT crystallography to help complete this picture by revealing distinct conformational modes of protein-ligand systems. Our results may inspire future use of RT crystallography to interrogate the roles of protein-ligand conformational ensembles in biological function.

Keywords: E. coli; X-ray crystallography; allostery; fragment screening; ligands; molecular biophysics; protein structure; structural biology.


Conflict of interest statement

TS, JB, SA, EN, SH, LD, NP, AD, RT, DA, HO, Fv, DK No competing interests declared

Figures

Figure 1.
Figure 1.. Resolution distributions from room-temperature (RT) crystallographic screens.
Histogram of X-ray resolutions of datasets soaked with DMSO (green), cryo-hits compounds (blue), or cryo-non-hits (red), collected at RT via (A) 1-xtal or (B) in situ data collection techniques.
Figure 1—figure supplement 1.
Figure 1—figure supplement 1.. Unit cell is more variable at cryogenic (cryo) than at room temperature (RT).
A comparison of RT vs. cryo unit cells (left: cryo a or b length vs. RT a or b length, right: cryo c length vs. RT c length) reveals the cryo datasets’ unit cell size has more variability than those at RT.
Figure 1—figure supplement 2.
Figure 1—figure supplement 2.. Pre-clustering partial datasets from in situ crystallography.
Partial datasets or ‘wedges’ are represented in a reduced dimensionality space based upon structure factor amplitude differences. These wedges can be approximately divided into three clusters (orange, purple, green). Some wedges at the cluster interfaces were used in multiple clusters. Wedges within a cluster were subsequently merged to generate complete datasets for input to PanDDA. Image from cluster4× (Ginn, 2020).
Figure 2.
Figure 2.. Fragment-binding occupancies are different and often lower at room temperature (RT).
1-BDC (a proxy for occupancy) is plotted for each binding event observed in either of two RT screens vs. in the previous cryogenic (cryo) screen. For two datasets, two binding events for the same fragment in the same structure are included as separate points. See Table 2 for definitions of pose categories. Those that did not show binding at RT are in gray along the x-axis. In some additional cases, RT event maps were calculated using the cryo 1-BDC to identify bound ligands at RT; these cases would sit artificially on the diagonal, and are not shown here.
Figure 3.
Figure 3.. Fragments have a similar distribution across protein sites but different binding modes at room temperature (RT).
Overview of fragments bound across PTP1B at RT, colored by RT pose compared to cryogenic (cryo) pose: same site, same pose (blue); same site, new pose (orange); new site (red). See Table 2 for more details on the definitions of these classifications. Also highlighted are the active-site WPD loop (red), P loop (yellow), 197 allosteric site (green), BB allosteric site (orange), and L16 allosteric site (purple) (Keedy et al., 2018). The protein is shown in its open conformation with the WPD loop and L16 in the open state. The α7 helix is not shown since it is disordered when the protein is in the open state, which is favored at higher temperatures (Keedy et al., 2018). α7 does become ordered in one RT fragment-bound structure, but is not shown here.
Figure 3—figure supplement 1.
Figure 3—figure supplement 1.. Fragments bound at room temperature (RT) colored by RT screen.
Same views and fragments as Figure 3, but with fragments colored based on the RT screen: 1-xtal (dark pink) or in situ (light pink).
Figure 4.
Figure 4.. Fragments that bind similarly at room (RT) vs. cryogenic (cryo) temperatures.
For each dataset, the RT PanDDA event map is in red (contour levels below), the RT model is in red (waters in red), and the corresponding cryo model is in blue (waters in purple). Datasets are named as follows: x####=RT in situ, z####=RT 1-xtal, y####=cryo. (A–C) in situ. (D–F) 1-xtal. (A) RT: x0224 (2.0 σ), cryo: y0118. (B) RT: x0285 (1.5 σ), cryo: y0772. (C) RT: x0262 (1.5 σ), cryo: y1656. (D) RT: z0007 (2.0 σ), cryo: y1710. (E) RT: z0015 (1.8 σ), cryo: y1554. (F) RT: z0025 (1.5 σ), cryo: y1294. This figure contains selected examples of fragments that bind similarly at RT vs. cryo; for all examples, see Figure 4—figure supplement 1 for 1-xtal and Figure 4—figure supplement 2 for in situ. For examples with no RT density for the cryo ligand using the cryo 1-BDC, see Figure 4—figure supplement 3.
Figure 4—figure supplement 1.
Figure 4—figure supplement 1.. All fragments that bind similarly at room (RT) vs. cryogenic (cryo) temperatures from 1-xtal screen.
For each panel: RT event map density on left, cryo event map density on right (blue). Same coloring as main Figure 4. (A) RT: z0007 (2 σ), cryo: y1710 (1.2 σ). (B) RT: z0015 (1.8 σ), cryo: y1554 (1.5 σ). (C) RT: z0021 (1.1 σ), cryo: y1312 (1.5 σ). (D) RT: z0025 (1.5 σ), cryo: y1294 (1.5 σ). (E) RT: z0028 (1.2 σ), cryo: y1819 (1.2 σ). (F) RT: z0033 (0.8 σ), cryo: y1842 (1.2 σ). (G) RT: z0089 (2 σ), cryo: y0118 (1.5 σ). (H) RT: x0267 (1.5 σ), cryo: y0112 (1.5 σ). (I) RT: z0115 (1.5 σ), cryo: y0660 (1.5 σ).
Figure 4—figure supplement 2.
Figure 4—figure supplement 2.. All fragments that bind similarly at room (RT) vs. cryogenic (cryo) temperatures from in situ screen.
For each panel: RT density on left, cryo on right. Same coloring as main Figure 4. (A) RT: x0224 (2 σ), cryo: y0118 (1.5 σ). (B) RT: x0285 (1.5 σ), cryo: y0772 (0.9 σ). (C) RT: x0267 (1.5 σ), cryo: y0112 (0.9 σ). (D) RT: x0228 (1.9 σ), cryo: y0076 (1.2 σ). (E) RT: x0262 (1.5 σ), cryo: y1656 (1.2 σ). (F) RT: x0158 (2 σ), cryo: y0175 (1 σ). (G) RT: x0283 (2 σ), cryo: y0829 (1.5 σ).
Figure 4—figure supplement 3.
Figure 4—figure supplement 3.. Fragments that bind at cryogenic (cryo) but not at room temperature (RT).
Using the same 1-BDC as cryo, there is no RT density for the cryo ligand. (A) RT: z0011 (1.5 σ), cryo: y0363. (B) RT: z0023 (2 σ), cryo: y0522. (C) RT: x0199 (1.8 σ), cryo: y0049. (D) RT: x0219 (1.5 σ), cryo: y0426.
Figure 4—figure supplement 4.
Figure 4—figure supplement 4.. Selected matching ligands across both screens have consistent binding poses.
For each panel: room temperature (RT) in situ density on left, RT 1-xtal density on right. Same coloring as main Figure 4. (A) RT: x0224 (2 σ), cryogenic (cryo): y0118; RT: z0089 (2 σ), cryo: y0118. (B) RT: x0267 (1.5 σ), cryo: y0112; RT: z0102 (1.5 σ), cryo: y0112.
Figure 4—figure supplement 5.
Figure 4—figure supplement 5.. Differences in solvation around fragments at room (RT) vs. cryogenic (cryo) temperature.
Red arrows indicate an RT water with only RT event map density. Blue arrows indicate a cryo water with only cryo event map density. Typical map contour levels used when modeling are shown, but conclusions were similar when visualizing at different map contour levels. For each panel: RT density on left, cryo on right. Same coloring as main Figure 4. (A) RT: x0228 (1.9 σ), cryo: y0076 (1.2 σ). (B) RT: x0262 (1.5 σ), cryo: y1656 (1.2 σ). (C) RT: x0267 (1.5 σ), cryo: y0112 (0.9 σ). This figure contains selected examples; see also Figure 6.
Figure 5.
Figure 5.. Temperature-dependent ligand conformational heterogeneity.
(A) In the room temperature (RT) dataset (x0227), the RT event map contoured at 2 σ (red) matches the RT model (red) rather than the cryogenic (cryo) model (blue) for both substituent groups of the ring. (B) In the cryo dataset (y0071), the cryo event map contoured at 1.2 σ (blue) matches the cryo model rather than the RT model.
Figure 6.
Figure 6.. Temperature modulates fragment pose and solvation within the same site.
(A) In the room temperature (RT) dataset (x0260), the RT event map contoured at 1.6 σ (red) matches the RT model (red), but shows little evidence for the cryogenic (cryo) model (y0180, blue). (B) In the corresponding cryo dataset, the cryo event map contoured at 1.6 σ (blue) matches both the cryo model (blue) and the RT model. Notably, only at cryo does the event map include density for a water molecule (purple ball) next to the fragment carbonyl group and well positioned for a hydrogen bond (pale green dashed line) with the cryo fragment pose.
Figure 7.
Figure 7.. Room-temperature (RT) fragment pose is flipped compared to the cryogenic (cryo) pose.
(A) Left: RT density (red) 1.5 σ, z0055 (red); y0884 (blue). Right: cryo density (blue) 1 σ, z0055 (red); y0884 (blue). (B) Left: RT density (red) 2 σ, x0256 (red); y0650 (blue). Right: cryo density (blue) 0.8 σ, x0256 (red); y0650 (blue) (not previously deposited to the PDB). Density is linked at RT (dashed box), consistent with the fragment pose, but is cut off at cryo, even at lower contour. There is little to no density for the open state of the WPD loop (not shown).
Figure 8.
Figure 8.. Fragments bind at new sites only at room temperature (RT).
(A–C) First example. (A) The two sites are ~38 Å away from one another. (B) In the RT dataset (z0042), the RT event map, calculated with 1-BDC of 0.36 and contoured at 1.5 σ (red), supports a bound fragment in the RT model (red) at a new site while the cryogenic (cryo) model (y1525) (blue) has no bound fragment. (C) By contrast, the RT event map (same contour) does not show any density for the cryo model (blue) from the previous cryo dataset (y1525). (D–F) Second example. (D) The two sites are ~46 Å away from one another. (E) The RT event map contoured at 1.75 σ (red) (same contour) does not support the cryo model (blue) from the previous cryo dataset (y0572). (F) By contrast, at a new site the RT event map (same contour) supports a bound fragment in the RT model (x0225) (red). The cryo model has no bound fragment.
Figure 8—figure supplement 1.
Figure 8—figure supplement 1.. Only half of a cryogenic (cryo) stacking artifact disappears at room temperature (RT).
(A) Cryo y0660 (blue); cryo density (blue) 1.5 σ. (B) RT z0115 (red); RT density (red) 0.7 σ.
Figure 8—figure supplement 2.
Figure 8—figure supplement 2.. Fragment that binds at a new site only at room temperature (RT).
(A) The two sites are ~40 Å away from one another. (B) In the RT event map contoured at 2.5 σ (red), the RT dataset (x0285) supports a bound fragment at a new site. The cryogenic (cryo) model (blue) from the previous cryo dataset (y0772) has no bound fragment. (C) By contrast, the RT event map, calculated with 1-BDC of 0.15 (same contour), does not support the cryo model. (The site where the RT map matches the cryo site is not shown.)
Figure 9.
Figure 9.. Unanticipated covalent adducts at previously reported allosteric sites only at room temperature (RT).
(A) RT structure with the fragment covalently bound to both K197 and K237 (z0048, red), aligned with cryogenic (cryo) structure with a previously reported allosteric inhibitor covalently bound to K197C (6b95, green). (B) Fragment bound to K197 at the 197 allosteric site, with RT event density at 1.5 σ. (C) Fragment bound to K237 at the L16 allosteric site, with RT event density at 1.5 σ.
Figure 9—figure supplement 1.
Figure 9—figure supplement 1.. Conformational difference for the active-site P loop.
(A) 180° rotation around the vertical axis of main Figure 9A, to view the backside of z0048 (red) aligned with 6b95 (green). The WPD loop remains open, but the P loop and the nearby substrate-binding loop adopt different conformations. (B) z0048 aligned with 6b95 and a structure with Cys215 in the P loop oxidized, PDB ID 1oes (orange). Room temperature (RT) event density is shown at 1.5 σ (red mesh). The new loop conformation at RT matches 1oes, not 6b95.
Figure 10.
Figure 10.. Temperature-dependent ordering of an α-helix augmenting a fragment-binding site.
(A) In the BB allosteric site, the room temperature (RT) density, x0222 (red); contoured at 1.25 σ, is consistent with an extended and more ordered α6 helix (dashed box). (B) In contrast, the cryogenic (cryo) density, y0205 (blue); contoured at 1.75 σ, becomes disordered and therefore the α6 helix is not modeled as extended as in the RT model (dashed box). (C) Overlay of the two models showing the fragment pose is extremely similar whereas the RT helix is extended and more ordered (dashed box).
Figure 11.
Figure 11.. Allosteric protein responses at key sites seen only at room temperature (RT).
Although the fragment binds in a similar manner and in the same allosteric site (the 197 site) in both the RT model (z0032) (red) and the cryogenic (cryo) model (y1763) (blue), the protein response is different between the two temperatures. At cryo, the protein retains the default open conformation, with loop 16 in the L16 site open and the WPD loop also open. Alternatively, at RT, the L16 site is fully closed, while the WPD loop exhibits alternate conformations with the loop both open and closed. The α7 helix (not shown) remains disordered in both temperatures.
Figure 11—figure supplement 1.
Figure 11—figure supplement 1.. Electron density evidence for allosteric protein responses at key sites seen only at room temperature (RT).
(A) Same as main Figure 11. (B) z0032 (red), y1763 (blue), RT density, 1.5 σ, indicate the fragment binds in the 197 site. (C) RT density, 1.5 σ, showing the WPD loop adopts alternative conformations with the WPD loop open and closed. (D) RT density, 1.5 σ, is consistent with loop 16 modeled in the closed conformation.
Figure 11—figure supplement 2.
Figure 11—figure supplement 2.. Covalent allosteric inhibitor matches fragment with allosteric response at room temperature (RT).
Overlay of z0032 with PDB ID 6b95, which includes a covalent inhibitor targeting the K197C mutation in the allosteric 197 site. Same coloring as in Figure 9.

Update of

  • doi: 10.1101/2022.11.02.514751

References

    1. Achdout H, Aimon A, Bar-David E, Barr H, The COVID Moonshot Consortium Open Science Discovery of Oral Non-Covalent SARS-CoV-2 Main Protease Inhibitor Therapeutics. bioRxiv. 2022 doi: 10.1101/2020.10.29.339317. - DOI
    1. Baek M, DiMaio F, Anishchenko I, Dauparas J, Ovchinnikov S, Lee GR, Wang J, Cong Q, Kinch LN, Schaeffer RD, Millán C, Park H, Adams C, Glassman CR, DeGiovanni A, Pereira JH, Rodrigues AV, van Dijk AA, Ebrecht AC, Opperman DJ, Sagmeister T, Buhlheller C, Pavkov-Keller T, Rathinaswamy MK, Dalwadi U, Yip CK, Burke JE, Garcia KC, Grishin NV, Adams PD, Read RJ, Baker D. Accurate prediction of protein structures and interactions using a three-track neural network. Science. 2021;373:871–876. doi: 10.1126/science.abj8754. - DOI - PMC - PubMed
    1. Berman HM, Westbrook J, Feng Z, Gilliland G, Bhat TN, Weissig H, Shindyalov IN, Bourne PE. The protein data bank. Nucleic Acids Research. 2000;28:235–242. doi: 10.1093/nar/28.1.235. - DOI - PMC - PubMed
    1. Bradford SYC, El Khoury L, Ge Y, Osato M, Mobley DL, Fischer M. Temperature artifacts in protein structures bias ligand-binding predictions. Chemical Science. 2021;12:11275–11293. doi: 10.1039/d1sc02751d. - DOI - PMC - PubMed
    1. Bury CS, Brooks-Bartlett JC, Walsh SP, Garman EF. Estimate your dose: RADDOSE-3D. Protein Science. 2018;27:217–228. doi: 10.1002/pro.3302. - DOI - PMC - PubMed

Publication types

Substances