

Review
doi: 10.1021/acs.chemrev.2c00814.
Epub 2023 Mar 7.
Phase Transitions of Associative Biomacromolecules
Affiliations
- PMID: 36881934
- PMCID: PMC11513790
- DOI: 10.1021/acs.chemrev.2c00814
Item in Clipboard
Review
Phase Transitions of Associative Biomacromolecules
Chem Rev.
.
Abstract
Multivalent proteins and nucleic acids, collectively referred to as multivalent associative biomacromolecules, provide the driving forces for the formation and compositional regulation of biomolecular condensates. Here, we review the key concepts of phase transitions of aqueous solutions of associative biomacromolecules, specifically proteins that include folded domains and intrinsically disordered regions. The phase transitions of these systems come under the rubric of coupled associative and segregative transitions. The concepts underlying these processes are presented, and their relevance to biomolecular condensates is discussed.
Conflict of interest statement
The authors declare no competing financial interest
Figures
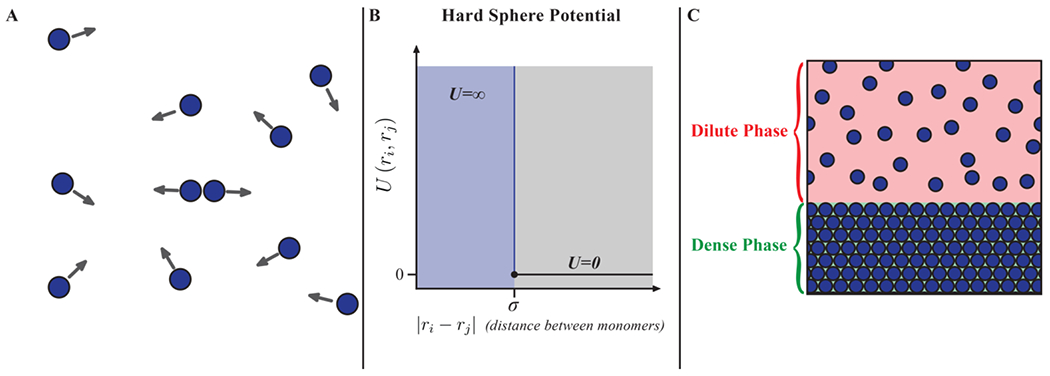
(A) System of hard spheres. The arrows indicate that the collisions among the molecules are purely elastic. (B) Potential for a pair of hard spheres. (C) A segregative density transition gives rise to two coexisting phases of different densities separated by an interface, as depicted here.
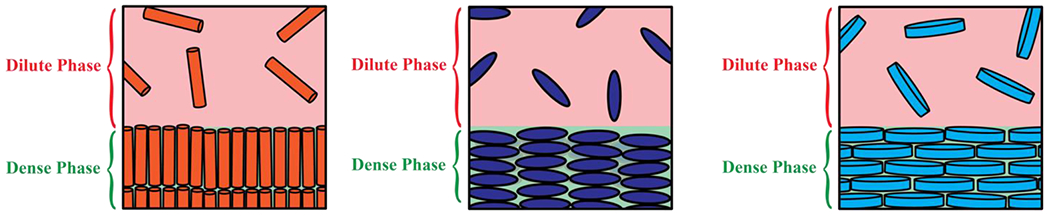
Systems of hard aspherical molecules including rods, ellipsoids, and discoids can also undergo segregative transitions.
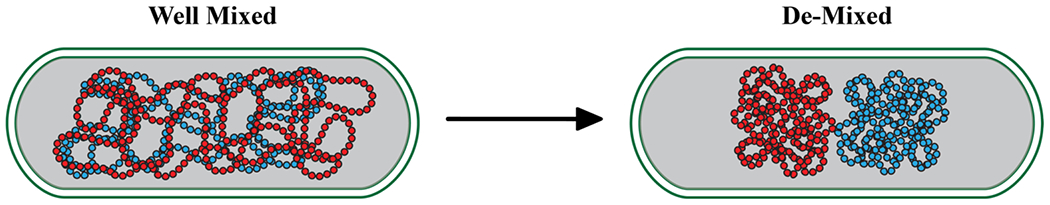
Entropically-driven phase separation helps explain bacterial chromosomal segregation.
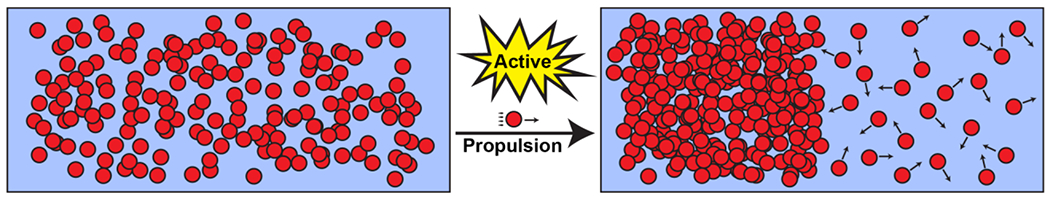
The figure shows active Brownian particles that are self-propelled in an external field. Propulsion creates flows and local inhomogeneities that can drive segregative transitions.
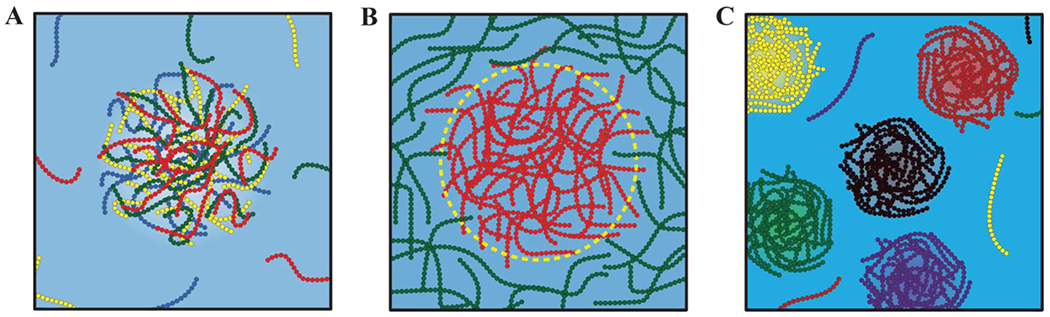
(A) The coexistence of two phases, one that is polymer-rich and another that is solvent-rich. (B) A scenario that is reminiscent of the ternary PEG, dextran, water system whereby two phases, rich in different types of polymers, coexist with one another. (C) The formation of distinct phases, each enriched in a specific type of polymer.
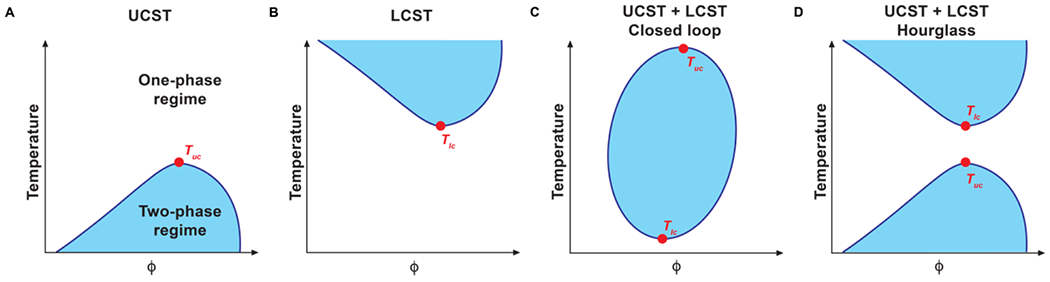
The systems depicted in (A) and (B) have an upper critical solution temperature (UCST) and a lower critical solution temperature (LCST), respectively. (C) shows a system with both a UCST and an LCST, where the two-phase regime exists between these critical temperatures, resulting in a closed loop. (D) shows a system with both a UCST and an LCST, with a two-phase regime above the UCST and below the LCST, resulting in an hourglass shape.
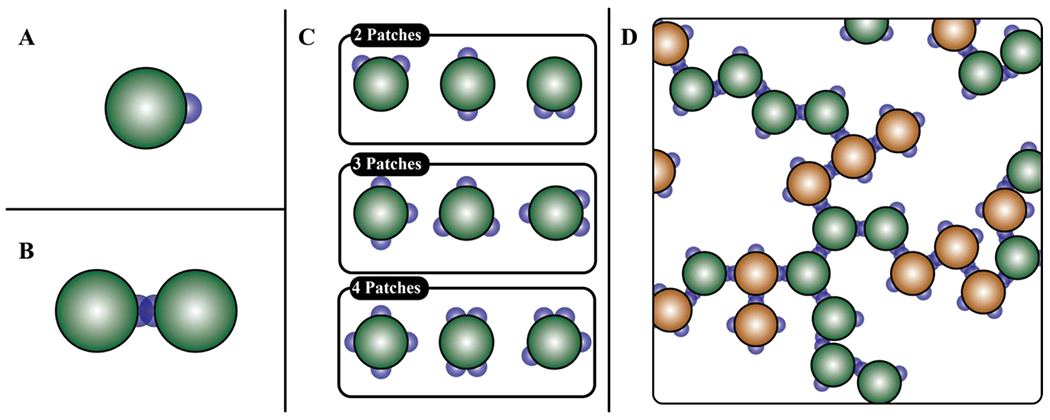
(A) Particle with a single patch. (B) Dimer formed by the interaction of particles, each with a single patch. (C) Particles with two, three, and four patches. (D) System spanning network formed by particles with three and four patches.
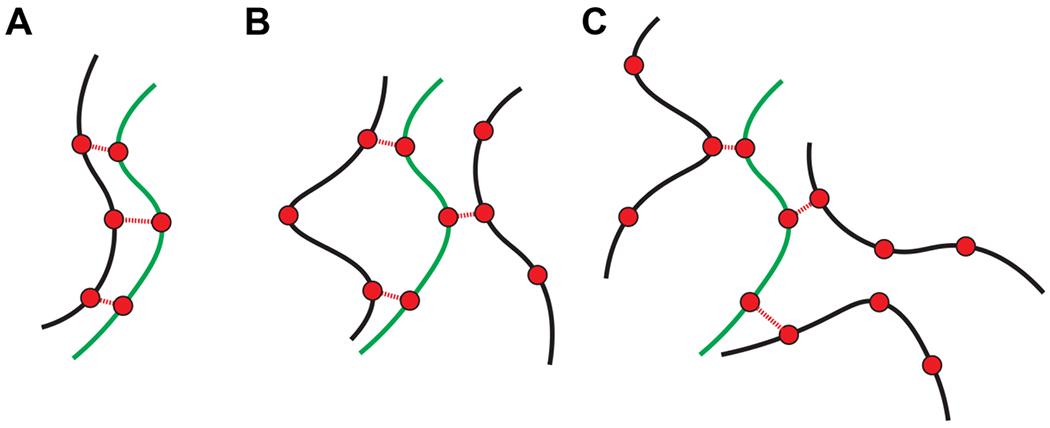
(A) A dimer forms that cannot grow into a network. (B) and (C) Trimers of different topologies featuring unsatisfied stickers that poise the system to grow and become a percolated network.
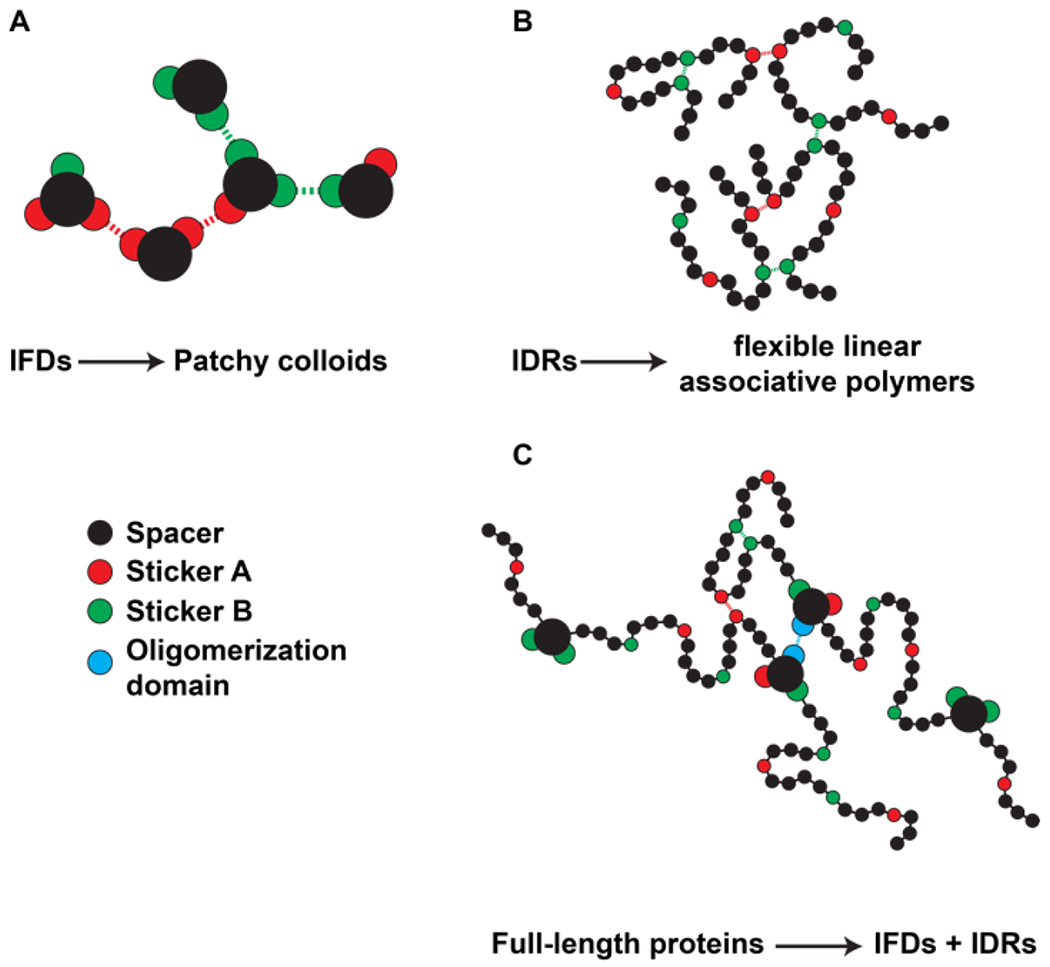
(A) shows how intrinsically foldable domains (IFDs) may be mapped onto patchy colloids. (B) shows how intrinsically disordered regions (IDRs) may be mapped onto flexible, linear associative polymers. (C) shows how full-length proteins with IFDs and IDRs may be mapped onto specific combinations of patchy colloids and linear polymers. In all cases, black regions indicate spacers, and red and green regions indicate different types of stickers. Blue regions in (C) indicate oligomerization domains that behave as strong stickers.
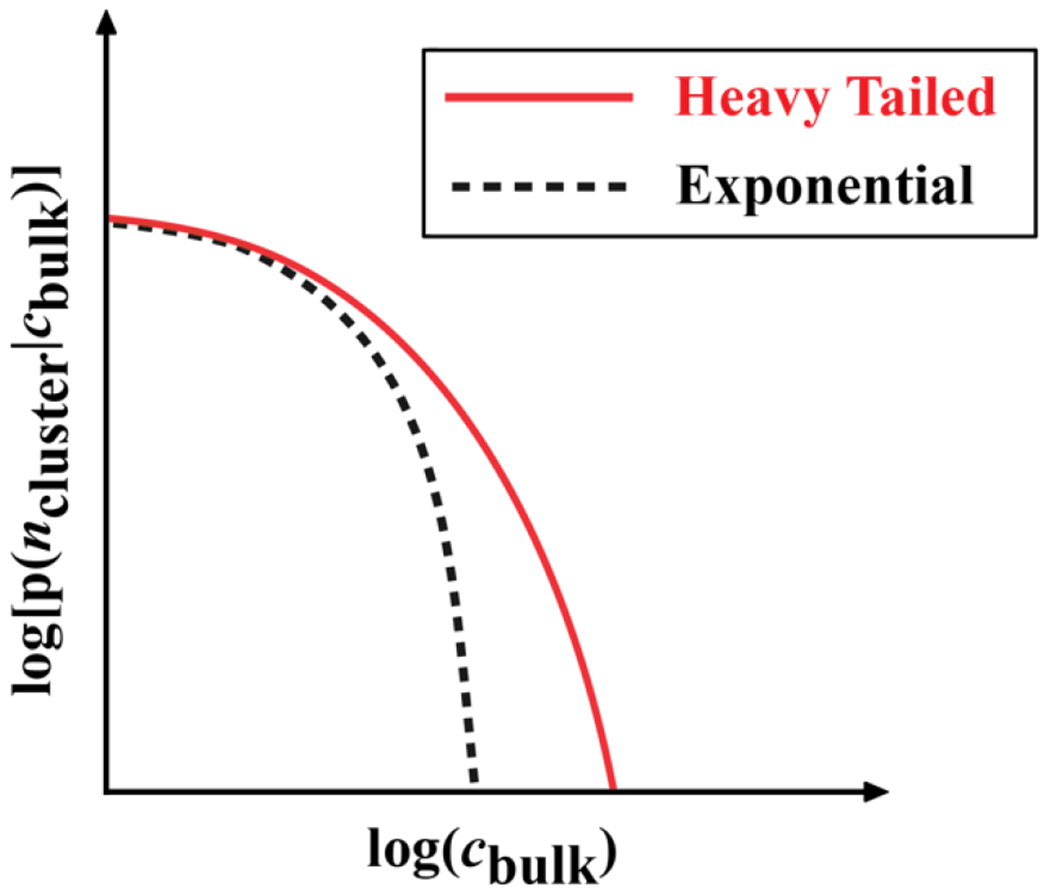
Schematic of an exponentially bounded (black dashed curve) versus heavy-tailed (red solid curve) version of p(ncluster|cbulk).
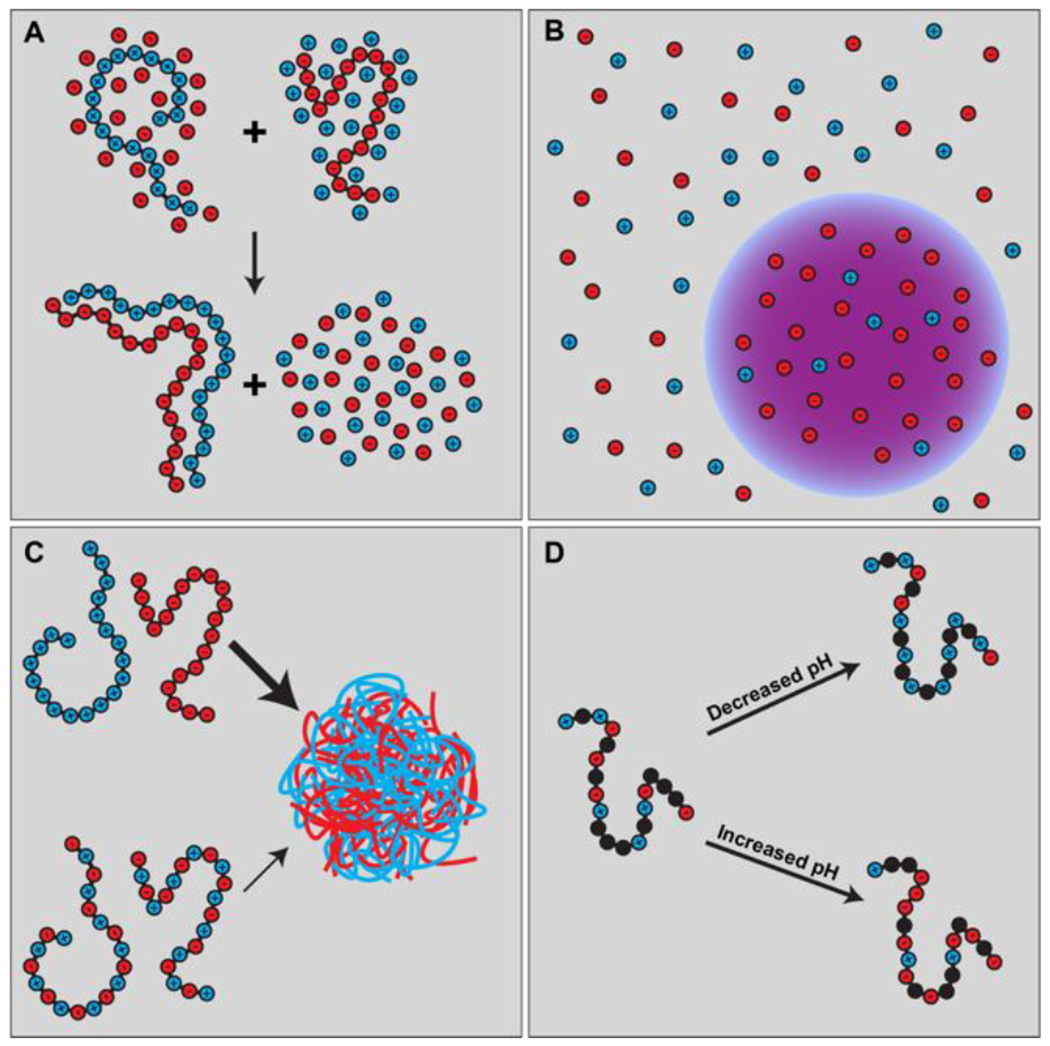
(A) Two polyelectrolytes, a polycation (left) and polyanion (right) can form a complex driven by a combination of complementary electrostatic interactions and the release of counterions. (B) and (C) show the formation of coexisting dilute and dense phase (coacervate) from the vantage point of the salt (B) and the polyelectrolytes (C). (D) The charge states of ionizable residues will be sensitive to pH and this can affect the complexation and coacervation of polyelectrolytes and polyampholytes (schematic shows the latter).
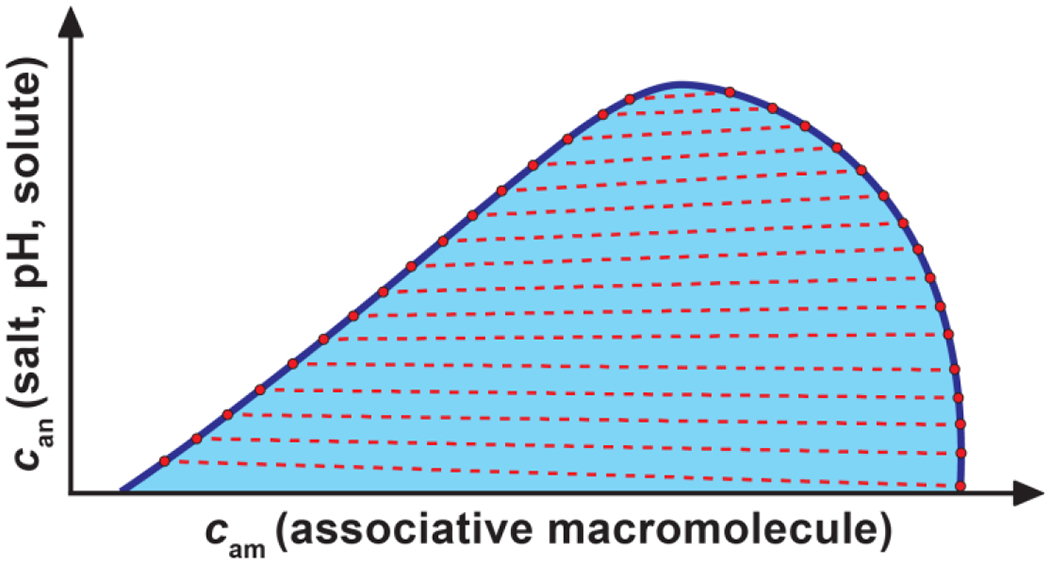
The phase boundary is in blue, the two-phase region is in pale blue, and the coexisting phases are joined by dashed red lines, which are tie lines. Tie lines may have positive slopes, implying an accumulation of the analyte in the dense phase, negative slopes, implying a depletion of the analyte from the dense phase, or horizontal slopes, implying equal preference of the analyte for the dense and dilute phases. Note that the slopes of tie lines can change sign as the critical point is approached, which is what we depict in this schematic.
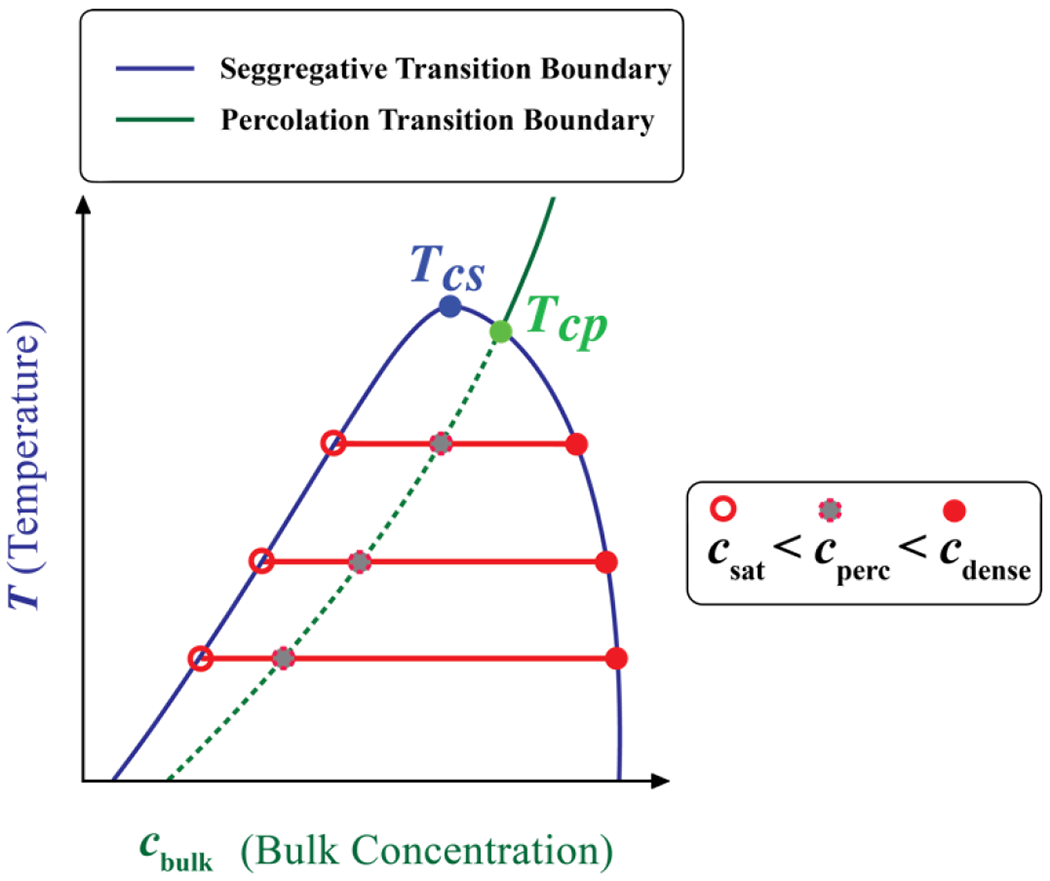
The red lines are tie lines (see section 6.1) that connect coexisting dilute and dense phases. There are two critical temperatures, Tcs for the segregative transition and Tcp for the percolation transition. For temperatures below Tcs and above Tcp there is the formal possibility of phase separation without percolation. Whether this regime is accessible or not will depend on the gap between the two critical temperatures Tcs and Tcp.
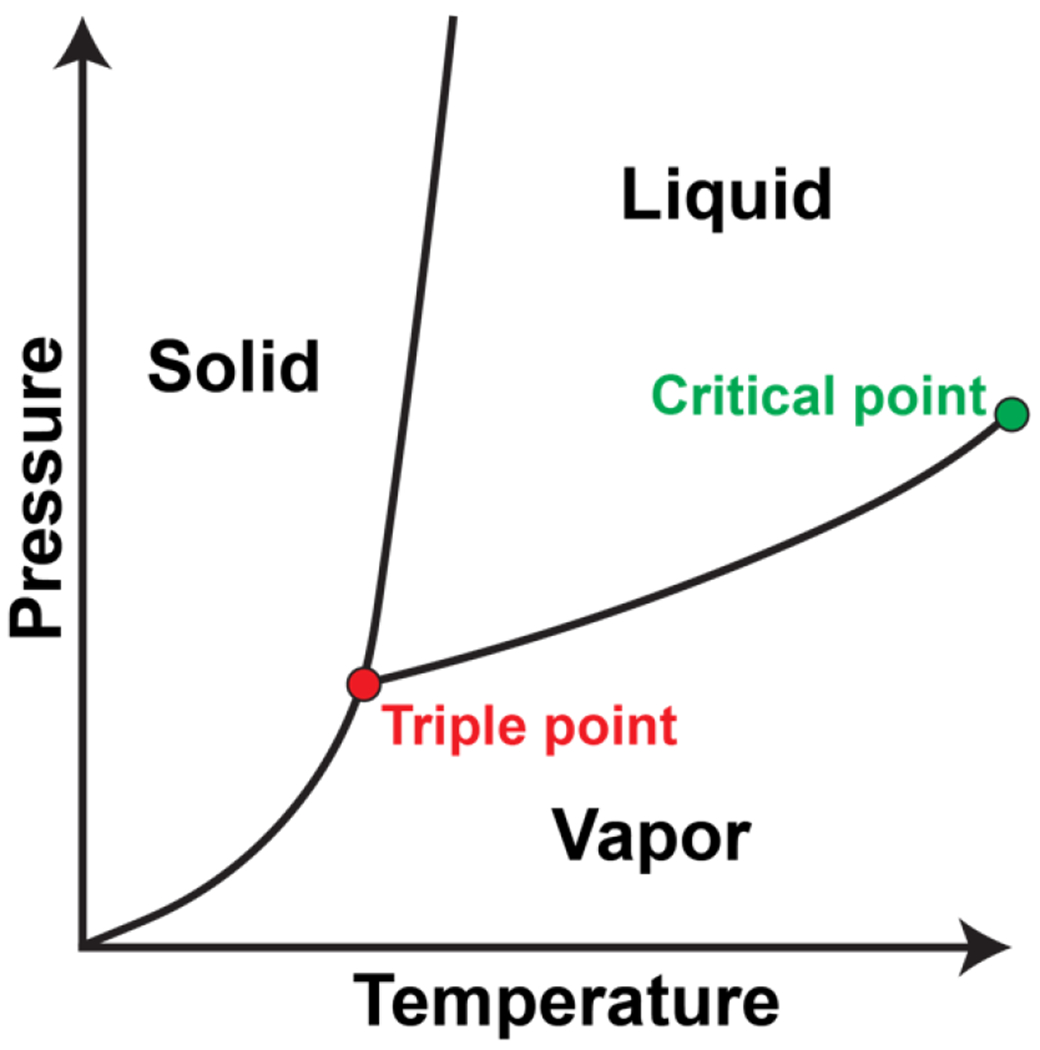
The red circle indicates the triple point where all three phases coexist. The green circle indicates the critical point where the vapor-liquid coexistence curve terminates. Beyond this critical point, the system forms a single fluid phase.
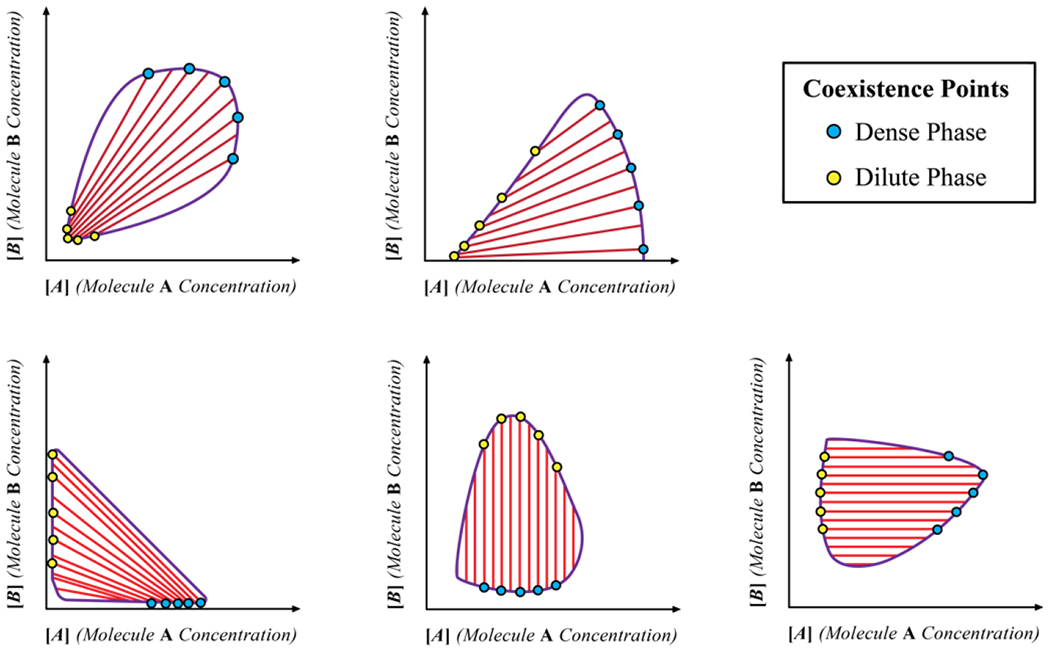
The solution conditions are fixed. The top left panel shows the case of a system where the phase behavior is driven purely by heterotypic interactions. The top middle panel shows the case where homotypic interactions among A molecules are equivalent to or outcompeting the heterotypic interactions. The bottom left panel shows the converse scenario. The bottom middle and bottom right panels show phase boundaries for the mixture where the drivers of phase transitions are purely A-A or B-B homotypic interactions. In all cases, the yellow circles designate coexisting dilute phases, and the blue circles are coexisting dense phases. Intercepts drawn from the yellow and blue circles to the abscissa and ordinate will quantify the concentrations of the coexisting dilute and dense phases, respectively. In each panel, the red lines are the tie lines.
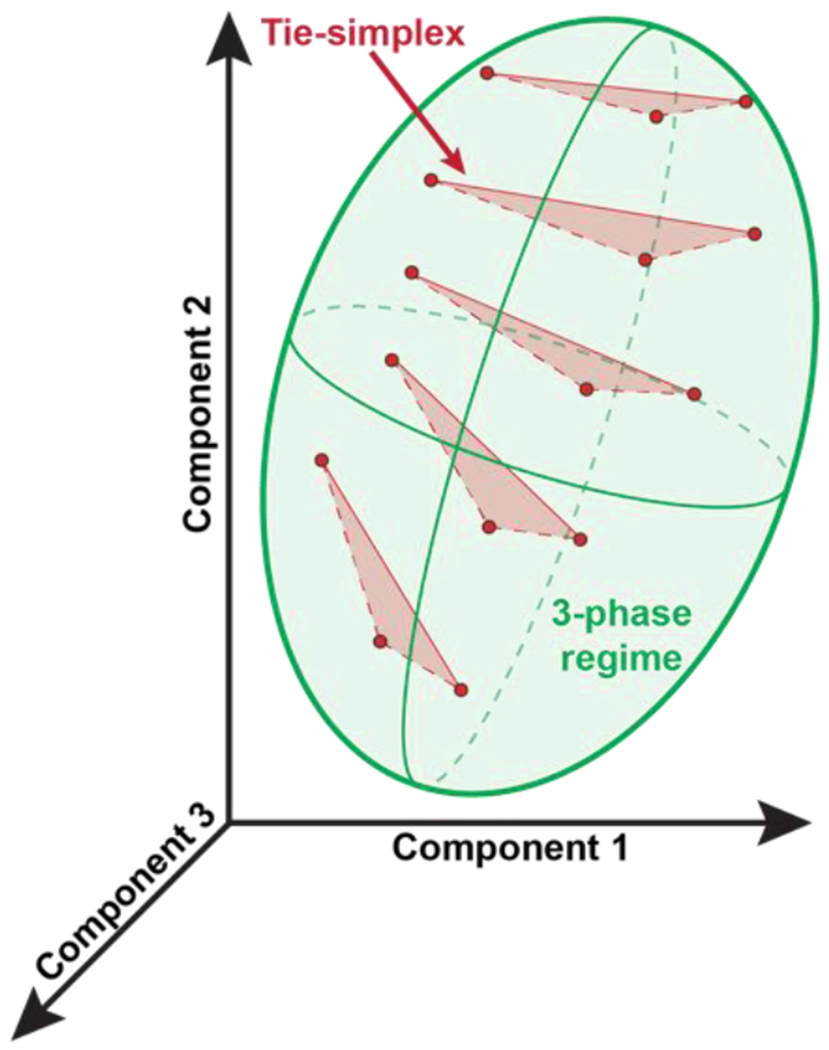
If three phases can coexist, as would be the case for the nucleolus or nuclear speckle , then the tie simplex is a 2-simplex, which is a triangle. The concentrations of the macromolecules in the three coexisting phases will be determined by the direction cosines that define each side of the triangle.
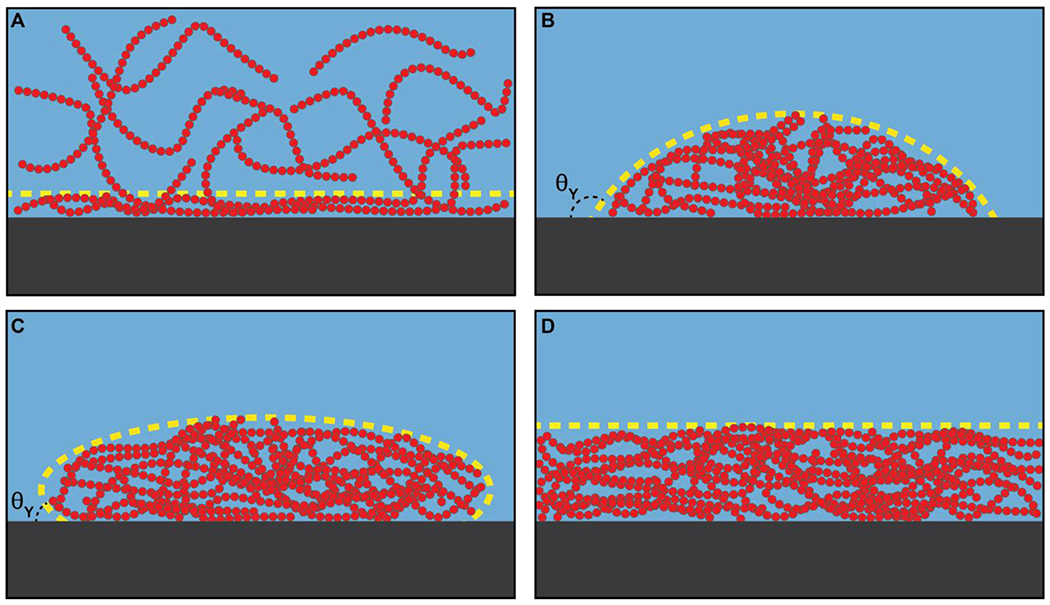
The solvent is shown in blue and the solid surface is shown in gray. The red chains indicate a polymeric species able to undergo phase separation at the proper conditions. The yellow dashed curves outline the adsorbing or wetting polymers. In (A), the polymer is in the one-phase regime and adsorbs onto the substrate. In (B) and (C), the polymer has undergone phase separation and the nascent dense phase partially wets the surface. The contact angle, θY, may be above 90°, indicating poor wetting (B), or below 90°, indicating good wetting (C). In (D), the polymer-rich dense phase completely wets the surface.
References
-
- Powers SK; Holehouse AS; Korasick DA; Schreiber KH; Clark NM; Jing H; Emenecker R; Han S; Tycksen E; Hwang I; et al. Nucleo-Cytoplasmic Partitioning of Arf Proteins Controls Auxin Responses in Arabidopsis Thaliana. Mol. Cell 2019, 76, 177–190.e175. DOI: 10.1016/j.molcel.2019.06.044. - DOI - PMC - PubMed
Publication types
MeSH terms
Substances
Grants and funding
LinkOut - more resources
Full Text Sources
Other Literature Sources
