

Integrative analysis of multi-omics and imaging data with incorporation of biological information via structural Bayesian factor analysis
- PMID: 36882008
- PMCID: PMC10387302
- DOI: 10.1093/bib/bbad073
Integrative analysis of multi-omics and imaging data with incorporation of biological information via structural Bayesian factor analysis
Abstract
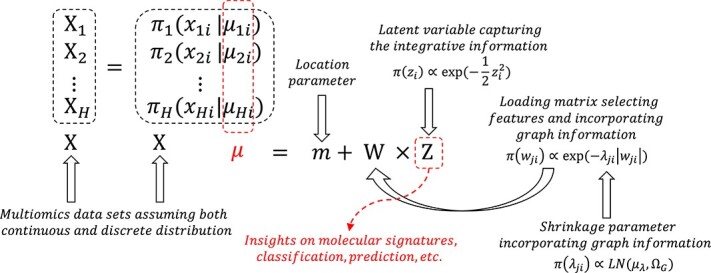
Motivation: With the rapid development of modern technologies, massive data are available for the systematic study of Alzheimer's disease (AD). Though many existing AD studies mainly focus on single-modality omics data, multi-omics datasets can provide a more comprehensive understanding of AD. To bridge this gap, we proposed a novel structural Bayesian factor analysis framework (SBFA) to extract the information shared by multi-omics data through the aggregation of genotyping data, gene expression data, neuroimaging phenotypes and prior biological network knowledge. Our approach can extract common information shared by different modalities and encourage biologically related features to be selected, guiding future AD research in a biologically meaningful way.
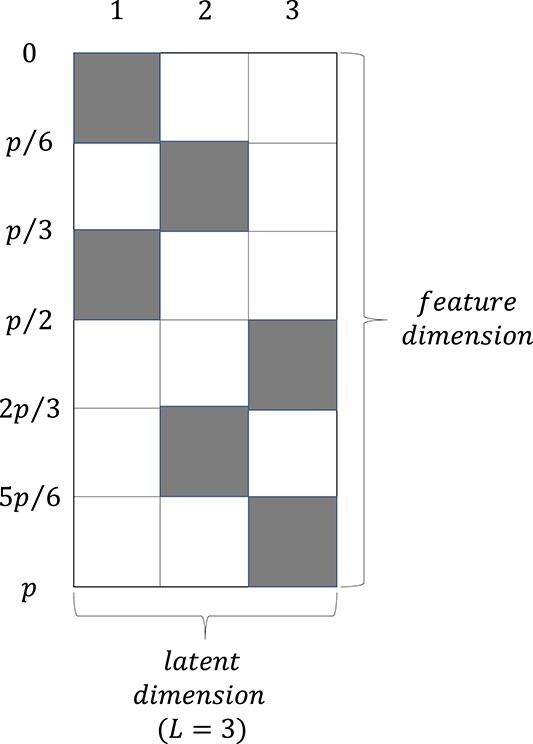
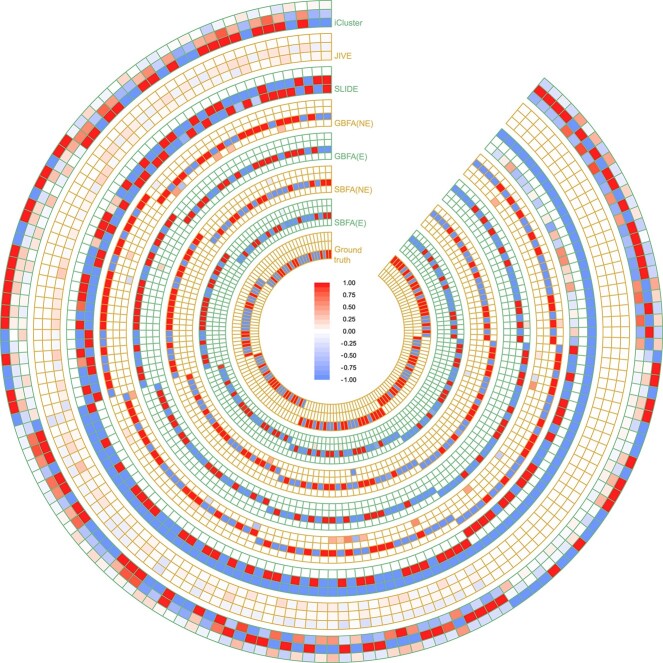
Method: Our SBFA model decomposes the mean parameters of the data into a sparse factor loading matrix and a factor matrix, where the factor matrix represents the common information extracted from multi-omics and imaging data. Our framework is designed to incorporate prior biological network information. Our simulation study demonstrated that our proposed SBFA framework could achieve the best performance compared with the other state-of-the-art factor-analysis-based integrative analysis methods.
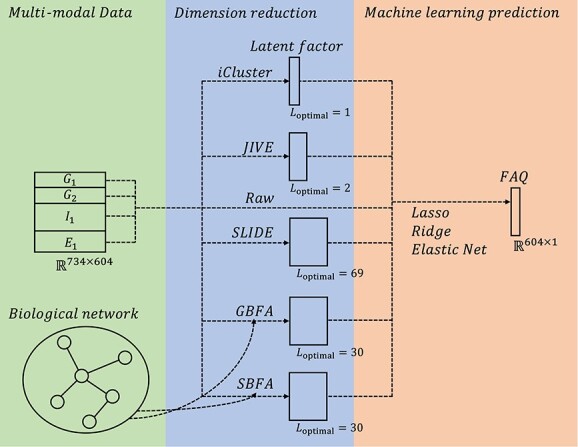
Results: We apply our proposed SBFA model together with several state-of-the-art factor analysis models to extract the latent common information from genotyping, gene expression and brain imaging data simultaneously from the ADNI biobank database. The latent information is then used to predict the functional activities questionnaire score, an important measurement for diagnosis of AD quantifying subjects' abilities in daily life. Our SBFA model shows the best prediction performance compared with the other factor analysis models.
Availability: Code are publicly available at https://github.com/JingxuanBao/SBFA.
Contact: qlong@upenn.edu.
Keywords: Alzheimer’s disease; biological network; multi-omics; structural Bayesian factor analysis.
© The Author(s) 2023. Published by Oxford University Press. All rights reserved. For Permissions, please email: journals.permissions@oup.com.
Figures
Similar articles
-
Bayesian linear mixed model with multiple random effects for prediction analysis on high-dimensional multi-omics data.Bioinformatics. 2023 Nov 1;39(11):btad647. doi: 10.1093/bioinformatics/btad647. Bioinformatics. 2023. PMID: 37882747 Free PMC article.
-
NetMIM: network-based multi-omics integration with block missingness for biomarker selection and disease outcome prediction.Brief Bioinform. 2024 Jul 25;25(5):bbae454. doi: 10.1093/bib/bbae454. Brief Bioinform. 2024. PMID: 39288230 Free PMC article.
-
A supervised Bayesian factor model for the identification of multi-omics signatures.Bioinformatics. 2024 May 2;40(5):btae202. doi: 10.1093/bioinformatics/btae202. Bioinformatics. 2024. PMID: 38603606 Free PMC article.
-
Deciphering the genetic architecture of human brain structure and function: a brief survey on recent advances of neuroimaging genomics.Brief Bioinform. 2023 Mar 19;24(2):bbad060. doi: 10.1093/bib/bbad060. Brief Bioinform. 2023. PMID: 36847697 Review.
-
Review of multi-omics data resources and integrative analysis for human brain disorders.Brief Funct Genomics. 2021 Jul 17;20(4):223-234. doi: 10.1093/bfgp/elab024. Brief Funct Genomics. 2021. PMID: 33969380 Free PMC article. Review.
Cited by
-
Employing Informatics Strategies in Alzheimer's Disease Research: A Review from Genetics, Multiomics, and Biomarkers to Clinical Outcomes.Annu Rev Biomed Data Sci. 2024 Aug;7(1):391-418. doi: 10.1146/annurev-biodatasci-102423-121021. Epub 2024 Jul 24. Annu Rev Biomed Data Sci. 2024. PMID: 38848574 Free PMC article. Review.
-
Preference matrix guided sparse canonical correlation analysis for mining brain imaging genetic associations in Alzheimer's disease.Methods. 2023 Oct;218:27-38. doi: 10.1016/j.ymeth.2023.07.007. Epub 2023 Jul 27. Methods. 2023. PMID: 37507059 Free PMC article.
-
Knowledge-guided learning methods for integrative analysis of multi-omics data.Comput Struct Biotechnol J. 2024 Apr 30;23:1945-1950. doi: 10.1016/j.csbj.2024.04.053. eCollection 2024 Dec. Comput Struct Biotechnol J. 2024. PMID: 38736693 Free PMC article. Review.
-
A genetically informed brain atlas for enhancing brain imaging genomics.Nat Commun. 2025 Apr 14;16(1):3524. doi: 10.1038/s41467-025-57636-6. Nat Commun. 2025. PMID: 40229250 Free PMC article.
-
Graph-guided Bayesian Factor Model for Integrative Analysis of Multi-modal Data with Noisy Network Information.Stat Biosci. 2024 Aug 11:10.1007/s12561-024-09452-7. doi: 10.1007/s12561-024-09452-7. Online ahead of print. Stat Biosci. 2024. PMID: 40693697 Free PMC article.
References
-
- Trambaiolli LR, Lorena AC, Fraga FJ, et al. Improving alzheimer’s disease diagnosis with machine learning techniques. Clin EEG Neurosci 2011; 42(3): 160–5. - PubMed
Publication types
MeSH terms
Grants and funding
LinkOut - more resources
Full Text Sources
Miscellaneous
