. 2023 Jun 23;51(11):5301-5324.
doi: 10.1093/nar/gkad121.

Dynamic interplay between RPL3- and RPL3L-containing ribosomes modulates mitochondrial activity in the mammalian heart

Affiliations

Dynamic interplay between RPL3- and RPL3L-containing ribosomes modulates mitochondrial activity in the mammalian heart

Ivan Milenkovic et al. Nucleic Acids Res. .

Abstract

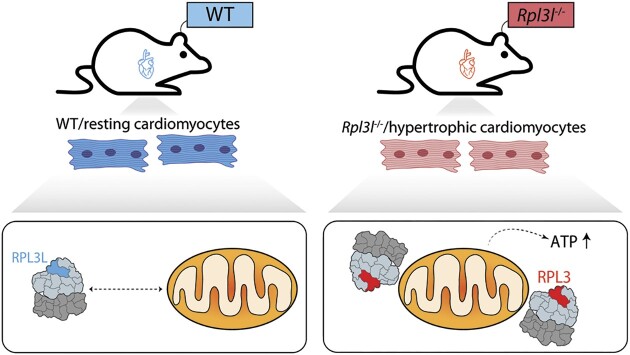
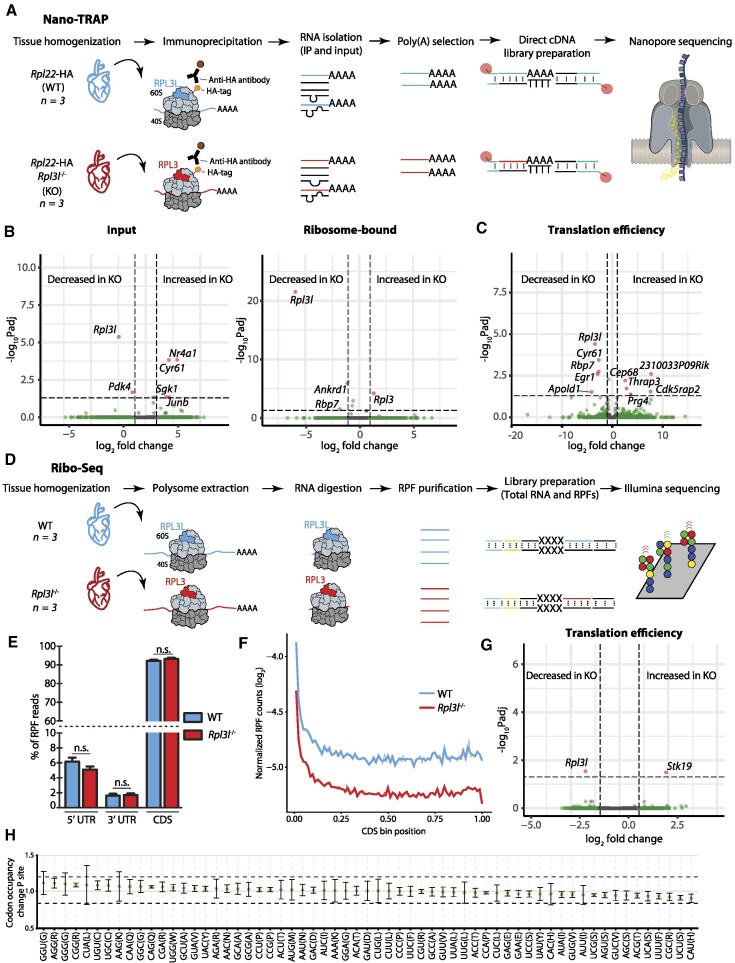
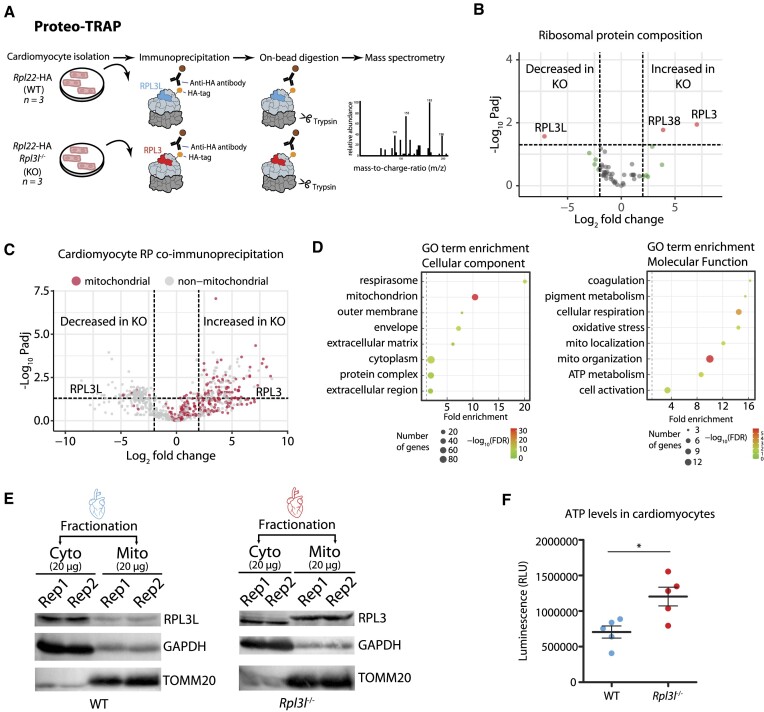
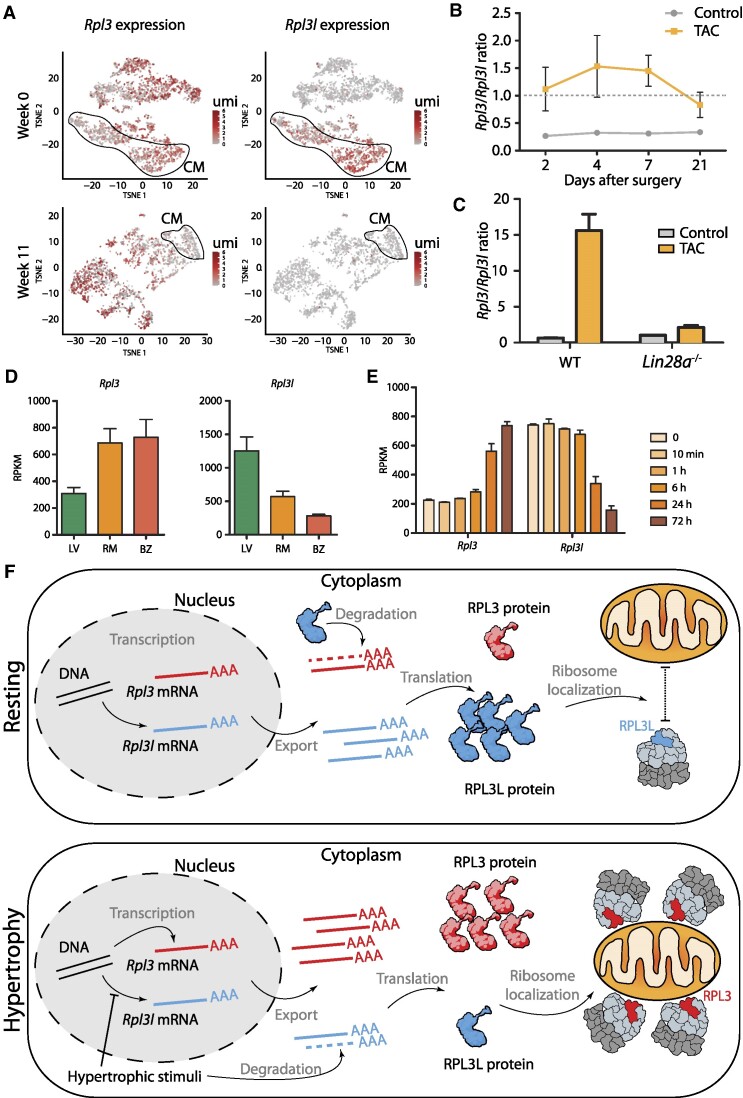
The existence of naturally occurring ribosome heterogeneity is now a well-acknowledged phenomenon. However, whether this heterogeneity leads to functionally diverse 'specialized ribosomes' is still a controversial topic. Here, we explore the biological function of RPL3L (uL3L), a ribosomal protein (RP) paralogue of RPL3 (uL3) that is exclusively expressed in skeletal muscle and heart tissues, by generating a viable homozygous Rpl3l knockout mouse strain. We identify a rescue mechanism in which, upon RPL3L depletion, RPL3 becomes up-regulated, yielding RPL3-containing ribosomes instead of RPL3L-containing ribosomes that are typically found in cardiomyocytes. Using both ribosome profiling (Ribo-seq) and a novel orthogonal approach consisting of ribosome pulldown coupled to nanopore sequencing (Nano-TRAP), we find that RPL3L modulates neither translational efficiency nor ribosome affinity towards a specific subset of transcripts. In contrast, we show that depletion of RPL3L leads to increased ribosome-mitochondria interactions in cardiomyocytes, which is accompanied by a significant increase in ATP levels, potentially as a result of fine-tuning of mitochondrial activity. Our results demonstrate that the existence of tissue-specific RP paralogues does not necessarily lead to enhanced translation of specific transcripts or modulation of translational output. Instead, we reveal a complex cellular scenario in which RPL3L modulates the expression of RPL3, which in turn affects ribosomal subcellular localization and, ultimately, mitochondrial activity.

Plain language summary

Ribosomes are macromolecular machines responsible for protein synthesis in all living beings. Recent studies have shown that ribosomes can be heterogeneous in their structure, possibly leading to a specialized function. Here, we focus on RPL3L, a ribosomal protein expressed exclusively in striated muscles. We find that the deletion of the Rpl3l gene in a mouse model triggers a compensation mechanism, in which the missing RPL3L protein is replaced by its paralogue, RPL3. Furthermore, we find that RPL3-containing ribosomes establish closer interactions with mitochondria, cellular organelles responsible for energy production, leading to higher energy production when compared with RPL3L-containing ribosomes. Finally, we show that the RPL3–RPL3L compensation mechanism is also triggered in heart disease conditions, such as hypertrophy and myocardial infarction.


Figures

Graphical Abstract
Graphical Abstract
Ribosome-mitochondria interactions in cardiomyocytes are modulated by the RPL3-RPL3L ribosomal protein paralog pair, where RPL3-containing ribosomes establish tighter interactions with mitochondria and lead to increased ATP levels.
Figure 1.
Figure 1.
RPL3L (uL3L) is a vertebrate RP paralogue with restricted tissue and developmental expression patterns, such as post-natal expression in mouse cardiomyocytes. (A) Heatmap of mRNA expression levels (log RPKM) of ribosomal proteins and their respective paralogues across embryonic (green: E10.5, E11.5, E12.5, E13.5, E14.5, E15.5, E16.5, E17.5 and E18.5) and post-natal mice tissues (pink: P0, P3, P14, P28 and P63). Processed data (RPKM) were obtained from Cardoso-Moreira et al. (40). See also Supplementary Figure S7 for a heatmap containing all RPs. (B) mRNA expression levels of ribosomal paralogue pairs (RPKM) in three different tissues (brain, liver and heart) for Rpl3/Rpl3l (upper panel), Rpl22/Rpl22l1 (middle panel) and Rpl7/Rpl7l1 (bottom panel). The developmental stages, shown on the x-axis, have been coloured depending on whether they correspond to embryonic (green) or post-natal (pink) stages. (C) Structural alignment of human RPL3 (red) and RPL3L (uL3L) (cyan); the C-terminus is highlighted (left) as is the location of RPL3 (uL3)/RPL3L (uL3L) within the ribosome (right). The C-terminus of RPL3 (uL3) and RPL3L (uL3L) is located at the surface of the ribosome, whereas the N-terminus of both proteins lies closer to the peptidyltransferase centre (PTC). The ribosome structure has been obtained from the cryo-electron microscopy structure of the human 80S ribosome, corresponding to PDB code 6IP5 (101), which includes RPL3. The Homo sapiens RPL3L (uL3L) structure was obtained from the ModBase (102) database and structurally superimposed to the RPL3 structure in the 80S ribosome. (D) T-distributed stochastic neighbour embedding (T-SNE) plot depicting Rpl3l expression across mouse heart cell types. Expression data have been extracted from publicly available single-cell RNA-seq data from Ren et al. (60). Each dot represents a cell. Expression levels are shown as umi (unique molecular identifiers). Abbreviations: CM, cardiomyocytes; EC, endothelial cells; FB, fibroblasts; MP, macrophage; T, T cells.
Figure 2.
Figure 2.
Phenotypic and molecular characterization of Rpl3l−/− knockout mice. (A) Strategy for generation of Rpl3−/− and Rpl3l−/− mice using the CRISPR/Cas9 system. Rpl3l−/− mice were successfully generated by introducing a 13 bp deletion in exon 5. Rpl3−/− mice have an embryonic-lethal phenotype. See also Supplementary Figure S1. (B) Relative expression levels of Rpl3l (left) and Rpl3 (right) measured using RT–qPCR and normalized to Gapdh. Rpl3 is ubiquitously expressed, while Rpl3l is heart and muscle specific. Rpl3l−/− mice do not express Rpl3l in any of the tissues (n = 3). Statistical significance was assessed using the unpaired t-test (*P <0.05, **P <0.01, ***P <0.001). (C) Immunofluorescence staining of RPL3 and RPL3L in both WT (left) and Rpl3l−/− mice heart tissues (right). Nuclei have been stained with DAPI and are shown in blue; actin is depicted in green and RPL3L (uL3L) (top) and RPL3 (uL3) (bottom) in red. (D) Western blot analysis of RPL3L (uL3L) (left) and RPL3 (uL3) (right) in cardiomyocytes isolated from WT and Rpl3l−/− hearts (n = 3 and n = 6, respectively). At the bottom, barplots depicting the fold change of RPL3 (uL3) and RPL3L (uL3L) expression in cardiomyocytes is shown. RPL3L (uL3) and RPL3 (uL3) levels were normalized to GAPDH. See also Supplementary Figure S4 for full blot images, and Supplementary Figure S5 for western blot results using total heart samples from WT and Rpl3l−/− mice. (E) Representative histological sections of WT and Rpl3l−/− heart tissues stained with H&E. A total of 10 mice were included in the histological analyses. See also Supplementary Figure S9. (F) EchoMRI analyses of aged (55-week-old) WT and Rpl3l−/− mice, in which weight, fat and lean mass were measured for each animal (n = 5). Statistical significance was assessed using unpaired t-test (*P <0.05).
Figure 3.
Figure 3.
RPL3L and RPL3 are incorporated into translating ribosomes in WT and Rpl3l−/− hearts, respectively. (A) Polysome profiles of liver (top), WT heart (middle) and Rpl3l−/− heart (bottom) were performed in 10–50% sucrose gradients with corresponding western blot analyses, in two biological replicates. Two hearts were pooled together per replicate. Membranes were probed with anti-RPL3L (uL3L), anti-RPL3 (uL3) and anti-RPS6 (eS6) antibodies to show the incorporation of both paralogues in translating ribosomes. (B) Polysome profiles fractions of a WT heart (top) and an Rpl3l−/− heart (bottom), analysed with western blot and probed with anti-RPL3L (uL3L), anti-RPL3 (uL3) and anti-RPS6 (eS6). Fractions 8 and 9, corresponding to the monosome peak of the polysome profile, of a Rpl3l−/− heart and WT heart, respectively, were used as positive controls. (C) Puromycin incorporation assay performed on WT and Rpl3l−/− hearts in biological triplicates. GAPDH was used as loading control and for normalization in the densitometric analysis. Statistical significance was assessed using unpaired t-test. Puro stands for puromycin.
Figure 4.
Figure 4.
RPL3L usage does not lead to preferential translation or altered translation efficiency. (A) Schematic representation of the Nano-TRAP method. (B) Volcano plots representing differentially expressed input mRNA (left) and ribosome-bound mRNA (right) transcripts identified using Nano-TRAP, which correspond to those with a fold change >1 and an FDR-adjusted P-value <0.05. Nano-TRAP results show minor differences in transcripts captured in RPL3L (uL3L)- and RPL3 (uL3)-bearing ribosomes. Each dot represents a gene, and they have been coloured depending on: (i) adjusted P-value <0.05 and fold change >1 (red); (ii) only fold change >1 (green) or only adjusted P-value <0.05 (blue); or (iii) neither fold change >1 nor adjusted P-value <0.05 (grey). See also Supplementary Table S5. (C) Translation efficiency analysis using NanoTrap. Counts were normalized by the sum of counts for each sample. Every dot represents a gene. See also Supplementary Table S5. (D) Schematic representation of the Ribo-seq method. (E) Percentage of RPF reads mapping to the 5′-untranslated region (UTR), 3′-UTR, and the coding sequence (CDS) of identified genes. The values shown are the mean of three biological replicates. Error bars represent the standard deviation. Statistical significance was assessed using the unpaired t-test (*P <0.05). (F) Metagene analysis of RPF reads from WT and Rpl3l−/− hearts. (G) Analysis of differential translation efficiency, calculated as the ratio between RPFs and mRNAs (see the Materials and Methods), between WT and Rpl3l−/− ribosomes. See also Supplementary Table S13. (H) Codon occupancy change between WT and Rpl3l−/− at the P-site.
Figure 5.
Figure 5.
RPL3 (uL3)-containing ribosomes establish physical contact with mitochondria. (A) Schematic representation of the Proteo-TRAP method. (B) Analysis of differential ribosome composition in cardiomyocytes from WT and Rpl3l−/− mice. See also Supplementary Table S9. (C) Volcano plot showing mitochondrial (red) and non-mitochondrial (grey) proteins co-precipitating with ribosomes in WT and Rpl3l−/− cardiomyocytes. See also Supplementary Table S14 and Supplementary Figure S17. (D) GO term enrichment plots showing top hits for cellular components (left) and molecular function (right). (E) Western blot analysis of cytosolic and mitochondrial fractions of WT (left) and Rpl3l−/− (right) hearts. GAPDH and TOMM20 were used as cytosolic and mitochondrial fraction markers, respectively. See also Supplementary Figure S17 for full membrane images with marker sizes. (F) Luminometric measurement of ATP levels in WT and Rpl3l−/− cardiomyocytes. Statistical significance was assessed using unpaired t-test (*P <0.05).
Figure 6.
Figure 6.
Pressure overload leads to an increase in Rpl3 expression and a decrease in Rpl3l expression in the heart. (A) The expression of Rpl3 and Rpl3l across cell types in mouse hearts before (week 0) and after hypertrophy (week 8) induced by transverse aortic constriction (TAC). Cardiomyocytes (CM) are circled. Expression levels are shown as umi (unique molecular identifiers). (B) TAC leads to heart hypertrophy that correlates with increased Rpl3 expression and decreased Rpl3l expression. The Rpl3/Rpl3l ratio is significantly increased at all time points (2, 4, 7 and 21 days after surgery) when compared with control hearts. See also Supplementary Figures S19 and S20 and Supplementary Table S15. (C) Effects of TAC-induced hypertrophy on Rpl3–Rpl3l interplay are impaired in Lin28a−/− mice. See also Supplementary Figure S22. (D) Rpl3 (left) and Rpl3l (right) nuclear mRNA levels in cardiomyocytes from the left ventricle (LV), remote myocardium (RM) and border zone (BZ) after myocardial infarction. Processed data (RPKM) were obtained from Günthel et al. (81). (E) Rpl3 and Rpl3l mRNA expression levels at different time points (0 min, 10 min, 1 h, 6 h, 24 h and 72 h) after myocardial infarction. Processed data (RPKM) were obtained from Liu et al. (82). (F) Model showing the Rpl3–Rpl3l interplay in resting (top) and hypertrophic (bottom) conditions. In the resting heart, Rpl3l is predominantly expressed in cardiomyocytes, and the RPL3L protein negatively regulates Rpl3 expression, while RPL3L (uL3L)-containing ribosomes do not establish close contact with mitochondria. Upon hypertrophic stimuli, Rpl3l expression is impaired and Rpl3l mRNA is degraded in the cytoplasm, leading to an increased expression of Rpl3. RPL3 (uL3)-containing ribosomes establish close contact with mitochondria.

References

    1. Genuth N.R., Barna M.. The discovery of ribosome heterogeneity and its implications for gene regulation and organismal life. Mol. Cell. 2018; 71:364–374. - PMC - PubMed
    1. Kondrashov N., Pusic A., Stumpf C.R., Shimizu K., Hsieh A.C., Ishijima J., Shiroishi T., Barna M.. Ribosome-mediated specificity in Hox mRNA translation and vertebrate tissue patterning. Cell. 2011; 145:383–397. - PMC - PubMed
    1. Komili S., Farny N.G., Roth F.P., Silver P.A.. Functional specificity among ribosomal proteins regulates gene expression. Cell. 2007; 131:557–571. - PMC - PubMed
    1. Mauro V.P., Edelman G.M.. The ribosome filter hypothesis. Proc. Natl Acad. Sci. USA. 2002; 99:12031–12036. - PMC - PubMed
    1. Williams M.E., Sussex I.M.. Developmental regulation of ribosomal protein L16 genes in Arabidopsis thaliana. Plant J. 1995; 8:65–76. - PubMed

Publication types